2947
Human In Vivo 25Mg Spectroscopy and Imaging at 7T1Medical Physics in Radiology, German Cancer Research Center (DKFZ), Heidelberg, Germany, 2Institute of Radiology, University Hospital Erlangen, Erlangen, Germany
Synopsis
25Mg spectroscopy and imaging were performed for the first time in vivo. T1 and T2* of 25Mg were evaluated in model solutions and T2* was additionally estimated in vivo for the human calf. 25Mg spectroscopy of an MgCl2 model solution exhibits a single resonance attributed to free 25Mg2+ ions, while in vivo spectroscopy of a human calf displays an additional resonance possibly attributable to bound 25Mg. Phantom and in vivo 25Mg imaging of the human calf were performed with a voxel size of 25×25×25 mm3.
Purpose
Magnesium plays an important role in many mammalian cellular processes.1 It is known that in several disease processes the intracellular Mg content or binding state is altered.2 However, up to now, the total or the intracellular in vivo concentrations of Mg have only been indirectly detected, e.g. by 31P spectroscopy3,4,5,6,7 and no 25Mg imaging has been attempted. Among the three naturally occurring Mg isotopes (24Mg, 25Mg, 26Mg), only 25Mg exhibits a nuclear spin and is detectable by MRI. However, due to low in-vivo concentrations and the low natural abundance of 25Mg (10%), in-vivo MRI of 25Mg should result in an approximately 100-fold lower signal intensity as compared to e.g. 35Cl or 39K MRI.8 For this reason, 25Mg MRI greatly benefits from ultrahigh field. Furthermore, the in vivo relaxation properties of 25Mg are largely unexplored.Methods
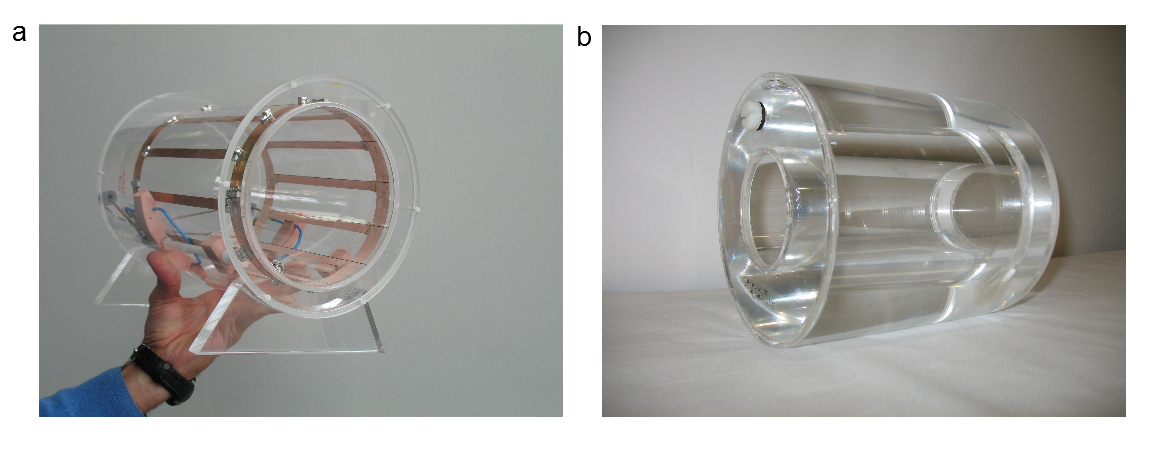
The measurements were performed on a 7T whole-body MR scanner (Magnetom 7T, Siemens Healthcare, Erlangen, Germany) using a custom-built quadrature birdcage coil tuned to the Larmor frequency of 25Mg at 7T (18.2MHz) with an inner diameter of 17cm (Fig.1a). The loops for inductive coupling to the rungs of the birdcage coil were also used for 1H shimming and imaging. T1 and T2* of 25Mg were evaluated in model solutions containing 200ml MgCl2 solution with a concentration of 100mmol/l and agarose concentrations varying from 0% to 5%. T2* was assessed using a nonselective FID sequence with echo times TE=0.5ms–100ms (BW=20kHz, TRO=3ms). An inversion recovery sequence with inversion times TI=6ms–600ms was used for the assessment of T1.
25Mg spectroscopy and imaging were performed on a model solution containing 100mmol/l MgCl2 (cylindrical shell with outer diameter 15cm, inner diameter 11cm, Fig.1b), as well as in vivo (healthy volunteer, female, 27y/o). The sequence parameters for spectroscopy were TE=0.225ms, TR=40ms, averages Nav=2048 (in vivo: Nav=15000), and flip angle α=33°, corresponding to the Ernst angle for T1=220ms (in vivo: α=90°).
A density adapted 3D radial pulse sequence9 was used for imaging with TE=0.2ms, TR=40ms (in vivo: TR=20ms), α=33° (in vivo α=90°), readout time TRO = 2ms, projections Nproj=800, Nav=32 (in vivo: Nav=150), Δx3=(25mm)3, TAQ≈17min (in vivo: TAQ≈40min). The data were reconstructed to a 16×16×16 grid using a Nonuniform Fast Fourier Transform (NUFFT)10 and zero padded to a 64×64×64 grid. T2* was also estimated by fitting the first 12 points from the acquired FID of the human calf.
Results
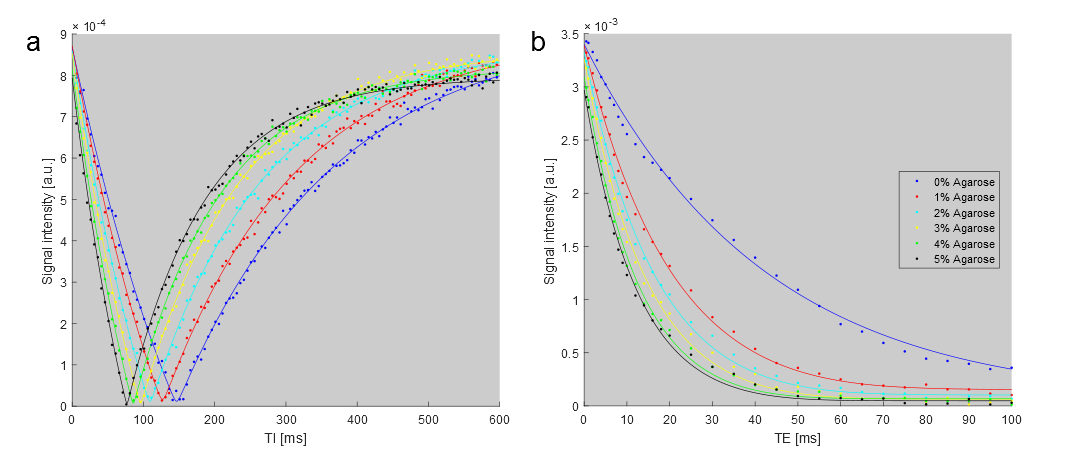
The relaxation times T1 and T2* for the model solutions were evaluated by fitting the data from the inversion recovery and FID sequences using a non-linear least squares method (Fig.2). The resulting values for T2* range from 12.3ms (5% agarose) to 42.6ms (0% agarose). The values for T1 range from 111.1ms (5% agarose) to 219.8ms (0% agarose) (Table1).
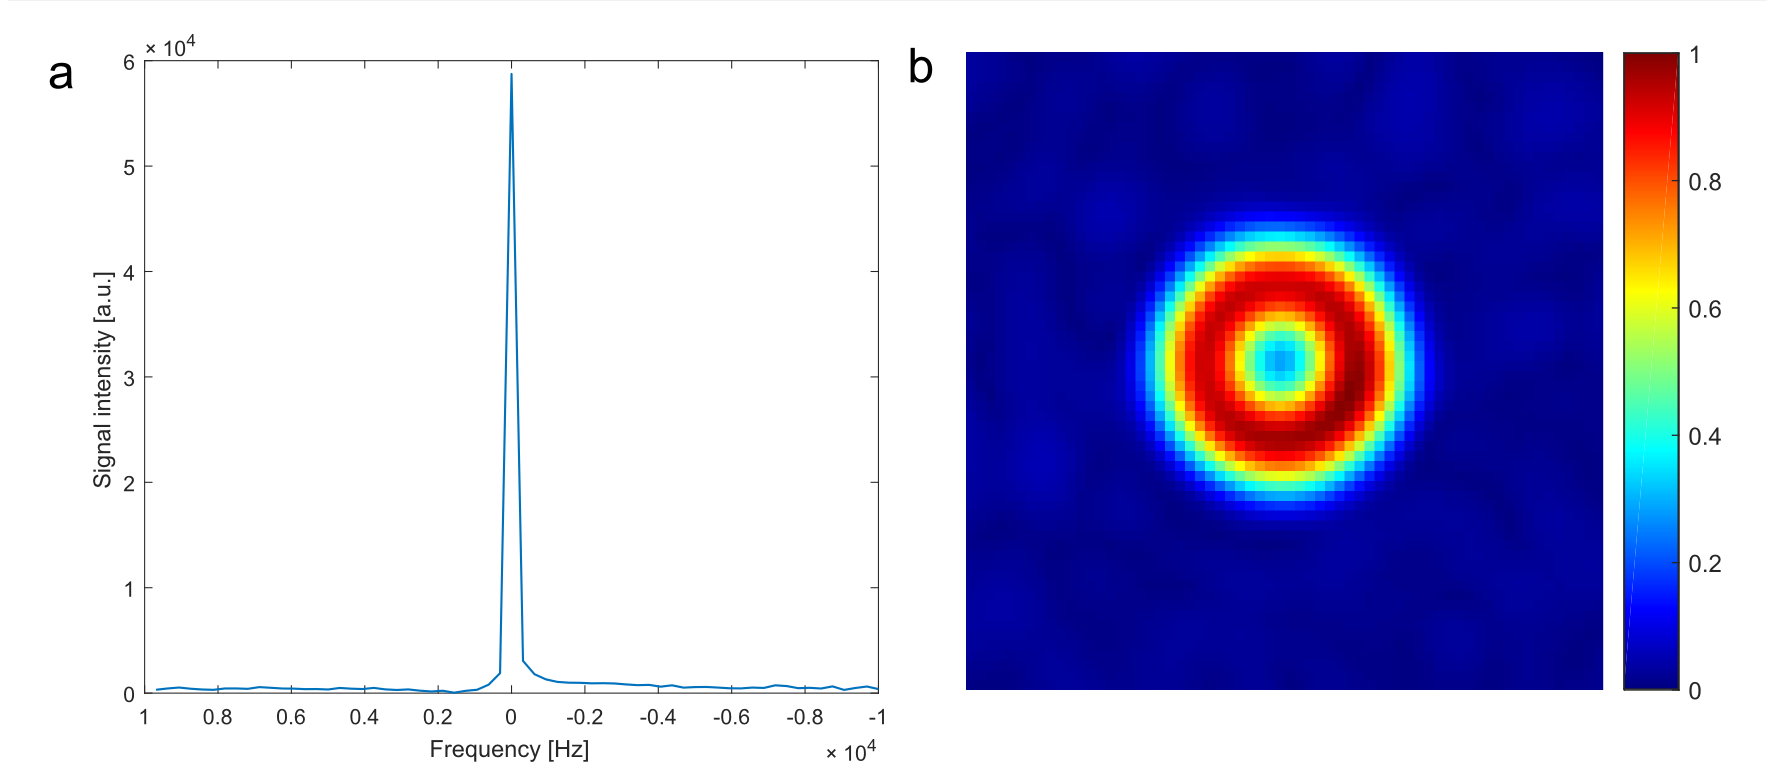
The spectrum obtained from the model solution displays a single peak attributed to free magnesium, which is also used as a reference for the frequency scale (Fig.3a). The corresponding image clearly depicts the cylindrical shape of the phantom with the cylindrical air cavity in the center of the transversal slice (Fig.3b).
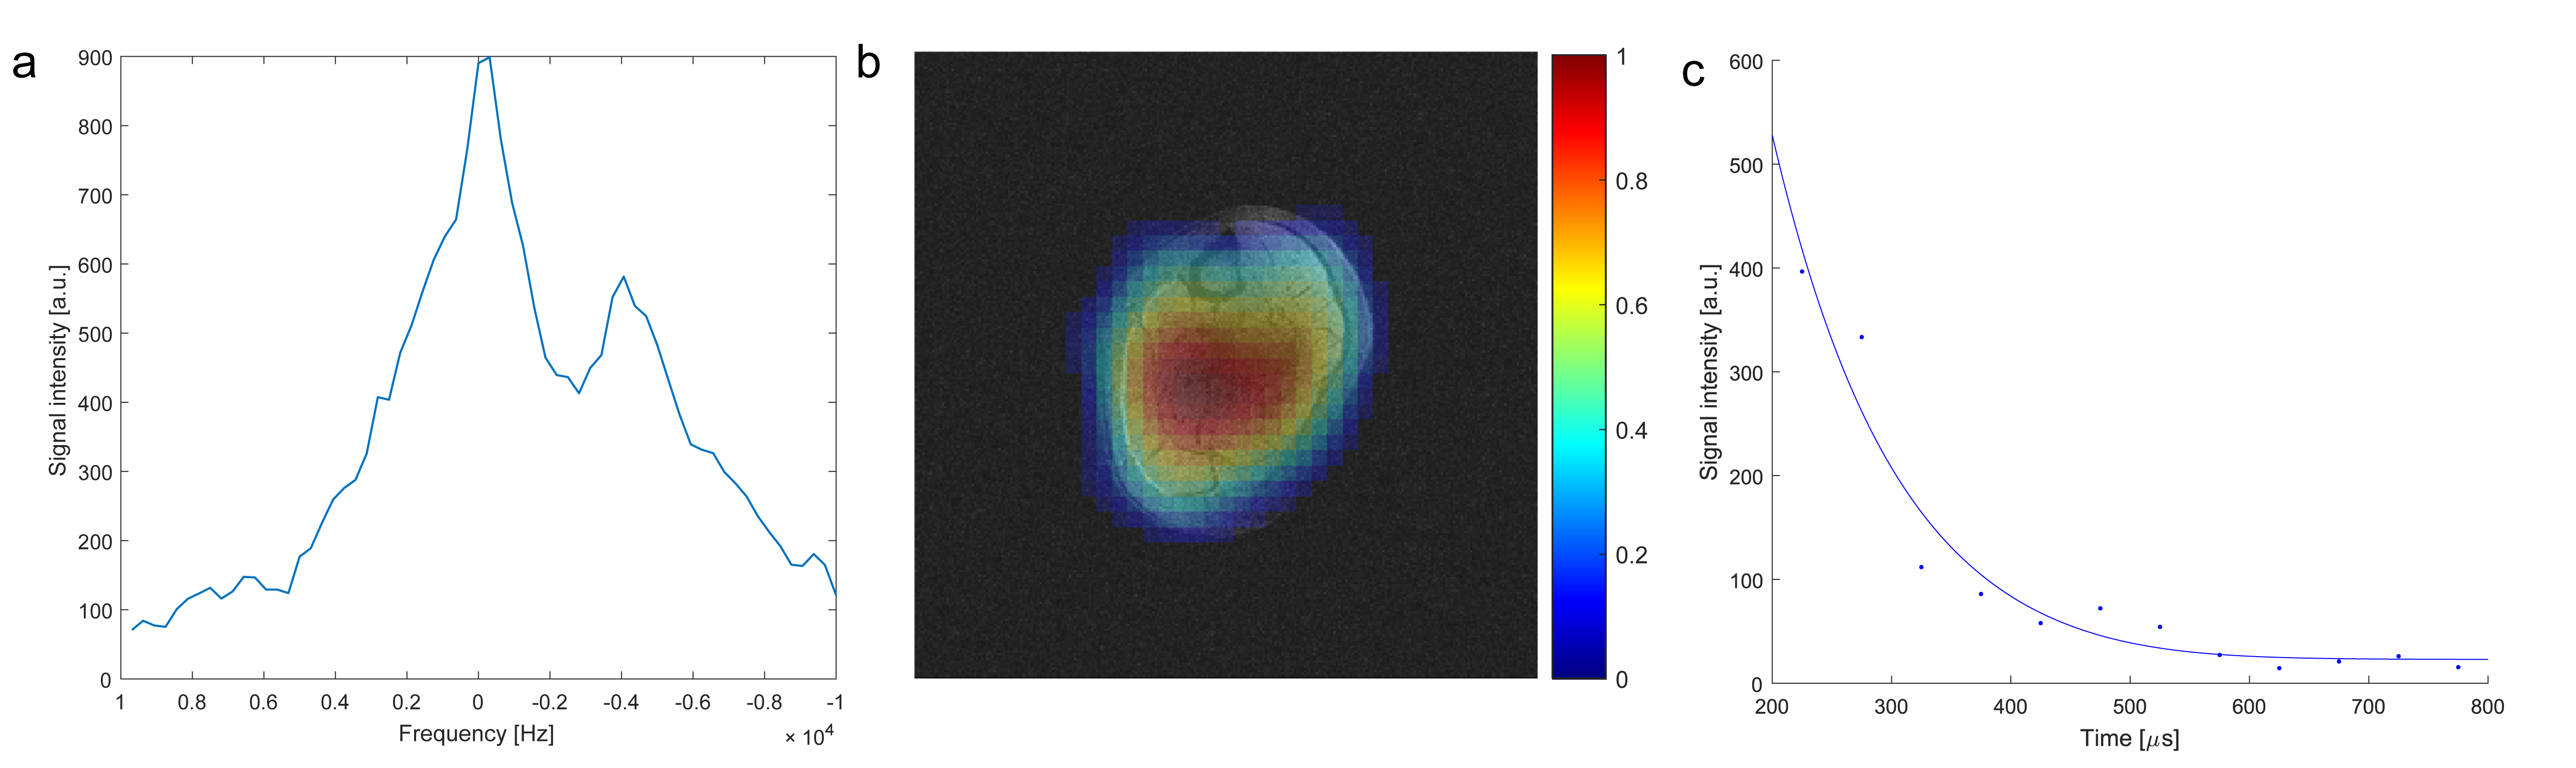
The in vivo spectrum (Fig.4a) displays a substantially increased linewidth, as well as an additional resonance at a frequency 4.3kHz lower than that of free magnesium. Fig.4b displays a transversal slice through a 3D 25Mg image of a human calf. The superposition with the 1H image, which is intrinsically co-registered since the same coil was used for both measurements, shows that the majority of the signal originates from the soleus and gastrocnemius muscles. T2* was estimated to be 107±36μs in the human calf (Fig.4c).
Discussion & Conclusion
Our work demonstrates that 25Mg spectroscopy and imaging of human muscle is feasible despite the challenges arising from its low NMR sensitivity and in vivo concentration. We were able to assess T1 and T2* in model solutions with varying agarose concentrations, as well as to give an estimate for T2* in vivo, which is considerably lower than for the agarose models. However, the SNR of 25Mg NMR was too low to give an estimate for T1 using inversion recovery sequences. In future work, in vivo T1 measurements for 25Mg could benefit from faster, less accurate methods. The second peak in in vivo spectroscopy suggests that, in addition to free 25Mg2+ ions, it is possible to detect 25Mg in a bound state.
For the first time, to our best knowledge, a spatially resolved method for in vivo investigation of 25Mg is presented.
Acknowledgements
The authors thank Barbara Dillenberger and Christian Kindtner for their support.References
[1] Murphy, Circ Res 2000; 86(3):326-33
[2] Thouyz et al., Am J Physiol Heart Circ Physiol 2008; 294(3):1103-18
[3] London, Annu Rev Physiol 1991; 53:241-58
[4] Gupta et al, J Biol Chem 1978; 253:6172-176
[5] Gupta et al, Ann Rev Biophys Bioeng 1984; 13:221-46
[6] Golding et al, Magn Reson Med 1996; 35(2):174:85
[7] Halverson et al, NMR Biomed; 5:53-58
[8] Chung et al, Chem Phys Lett 1990; 172(1) :94-98
[9] Nagel et al, Magn Reson Med 2009; 62(6):1565-73
[10] Fessler et al, IEEE Trans Signal Process; 2003 ; 51(2):560-74
Figures