2942
Automated Kinetic Modeling of Hyperpolarized 13C Metabolism in Human Brain Tumors1UCSF, San Francisco, CA, United States
Synopsis
Methods for dynamic spectroscopic imaging of hyperpolarized (HP) 13C substrates are rapidly evolving and accessible tools are required for reconstructing the data and for validating quantitative kinetic models. This study presents processing tools for automatic analysis of data from dynamic HP 13C experiments. The methods were implemented in the open-source SIVIC software package and applied to the fitting of data from a human brain tumor trial to derive metabolic Kpl maps.
Purpose
The purpose of this study was to firstly develop automated processing methods for analysis of data from dynamic hyperpolarized 13C experiments in order to extract quantitative parameter maps characterizing in vivo 13C brain tumor metabolism and secondly to implement the modeling methods as open-source software that can be easily extended to support kinetic analysis of other models and systems.Introduction
Dynamic spectroscopic imaging of hyperpolarized (HP) 13C substrates enables the measurement of real-time in vivo metabolic activity1. These methods show promise for elucidating normal and pathological metabolic pathways and response to therapy. Kinetic parameters are typically derived from these experiments by fitting data to model functions. Several models have been proposed2,3 that vary in the number of metabolic species, assumptions about reverse rate constants, number of signal decay pathways and the role of substrate perfusion. For dynamic HP methods to evolve into clinically viable techniques, the models and quantification methods need to be validated, standardized and implemented in automated and widely-available software packages. Another challenge is that sequences used in dynamic HP experiments use fast acquisition strategies and may employ specialized variable flip angle schemes4 requiring custom reconstruction software as part of an overall kinetic modeling pipeline. The present work describes an extensible open-source modeling package designed to support the application and validation of HP kinetic models. The goal is to provide an accessible and automated platform for comparing different kinetic models and for applying models to data from multiple platforms (Varian, GE, Philips, etc.) and that provides quantitative results in standard DICOM format. Kinetics models were developed to fit initial data from a human 13C brain tumor trial.Kinetic Modeling Implementation
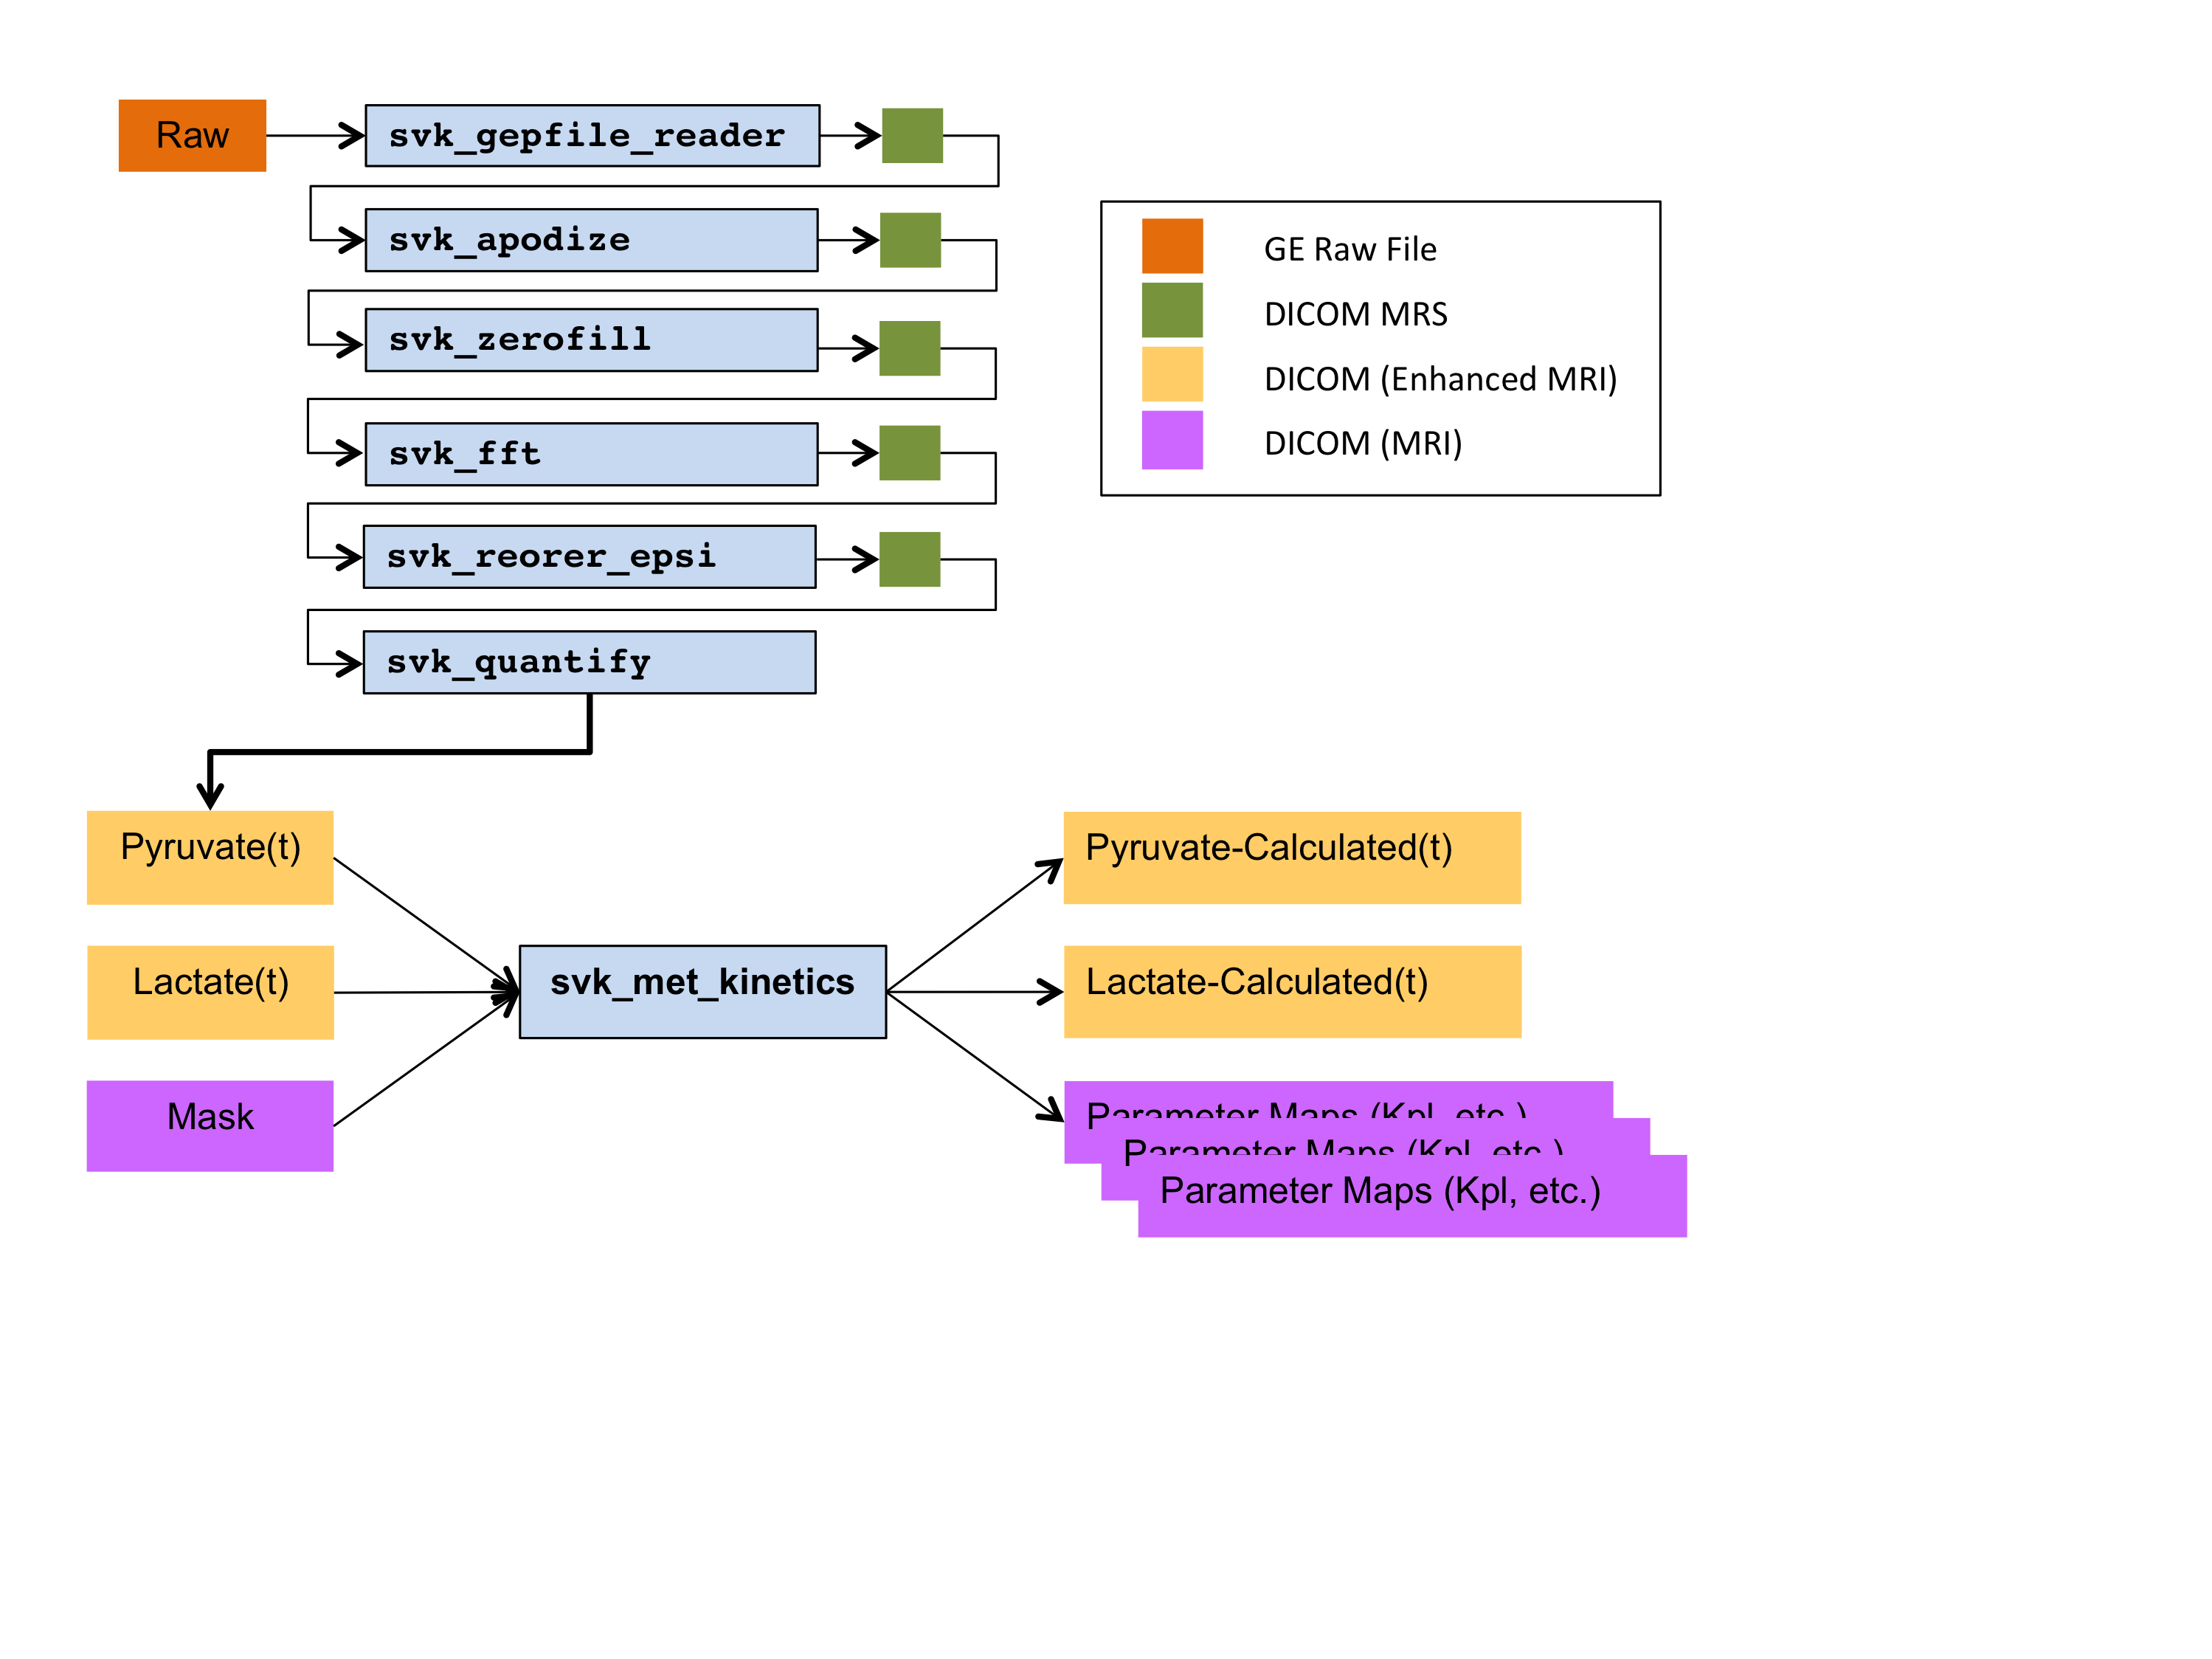
Reconstruction and kinetic modeling software was implemented in C++ as command line tools in the open-source SIVIC5 package (fig. 1). The application fits quantified dynamic HP data using an instance of the svkMRSKinetics class6, which performs a numerical optimization of a kinetic model cost function using an ITK particle swarm optimizer7. Model cost functions were implemented as subclasses of svkKineticModelCostFunction that define a model by implementing 7 pure abstract methods. Two models were implemented initially to test the framework. The first was a piecewise 5 parameter, 2-site exchange model8 that fits the complete time evolution of the signals including rising and decaying regions. The second model was a simplified 2 parameter, 2-site model9 that only fits the decaying edge of the pyruvate and lactate signals. All source code for the models and complete analysis pipeline are available on GitHub6.Methods
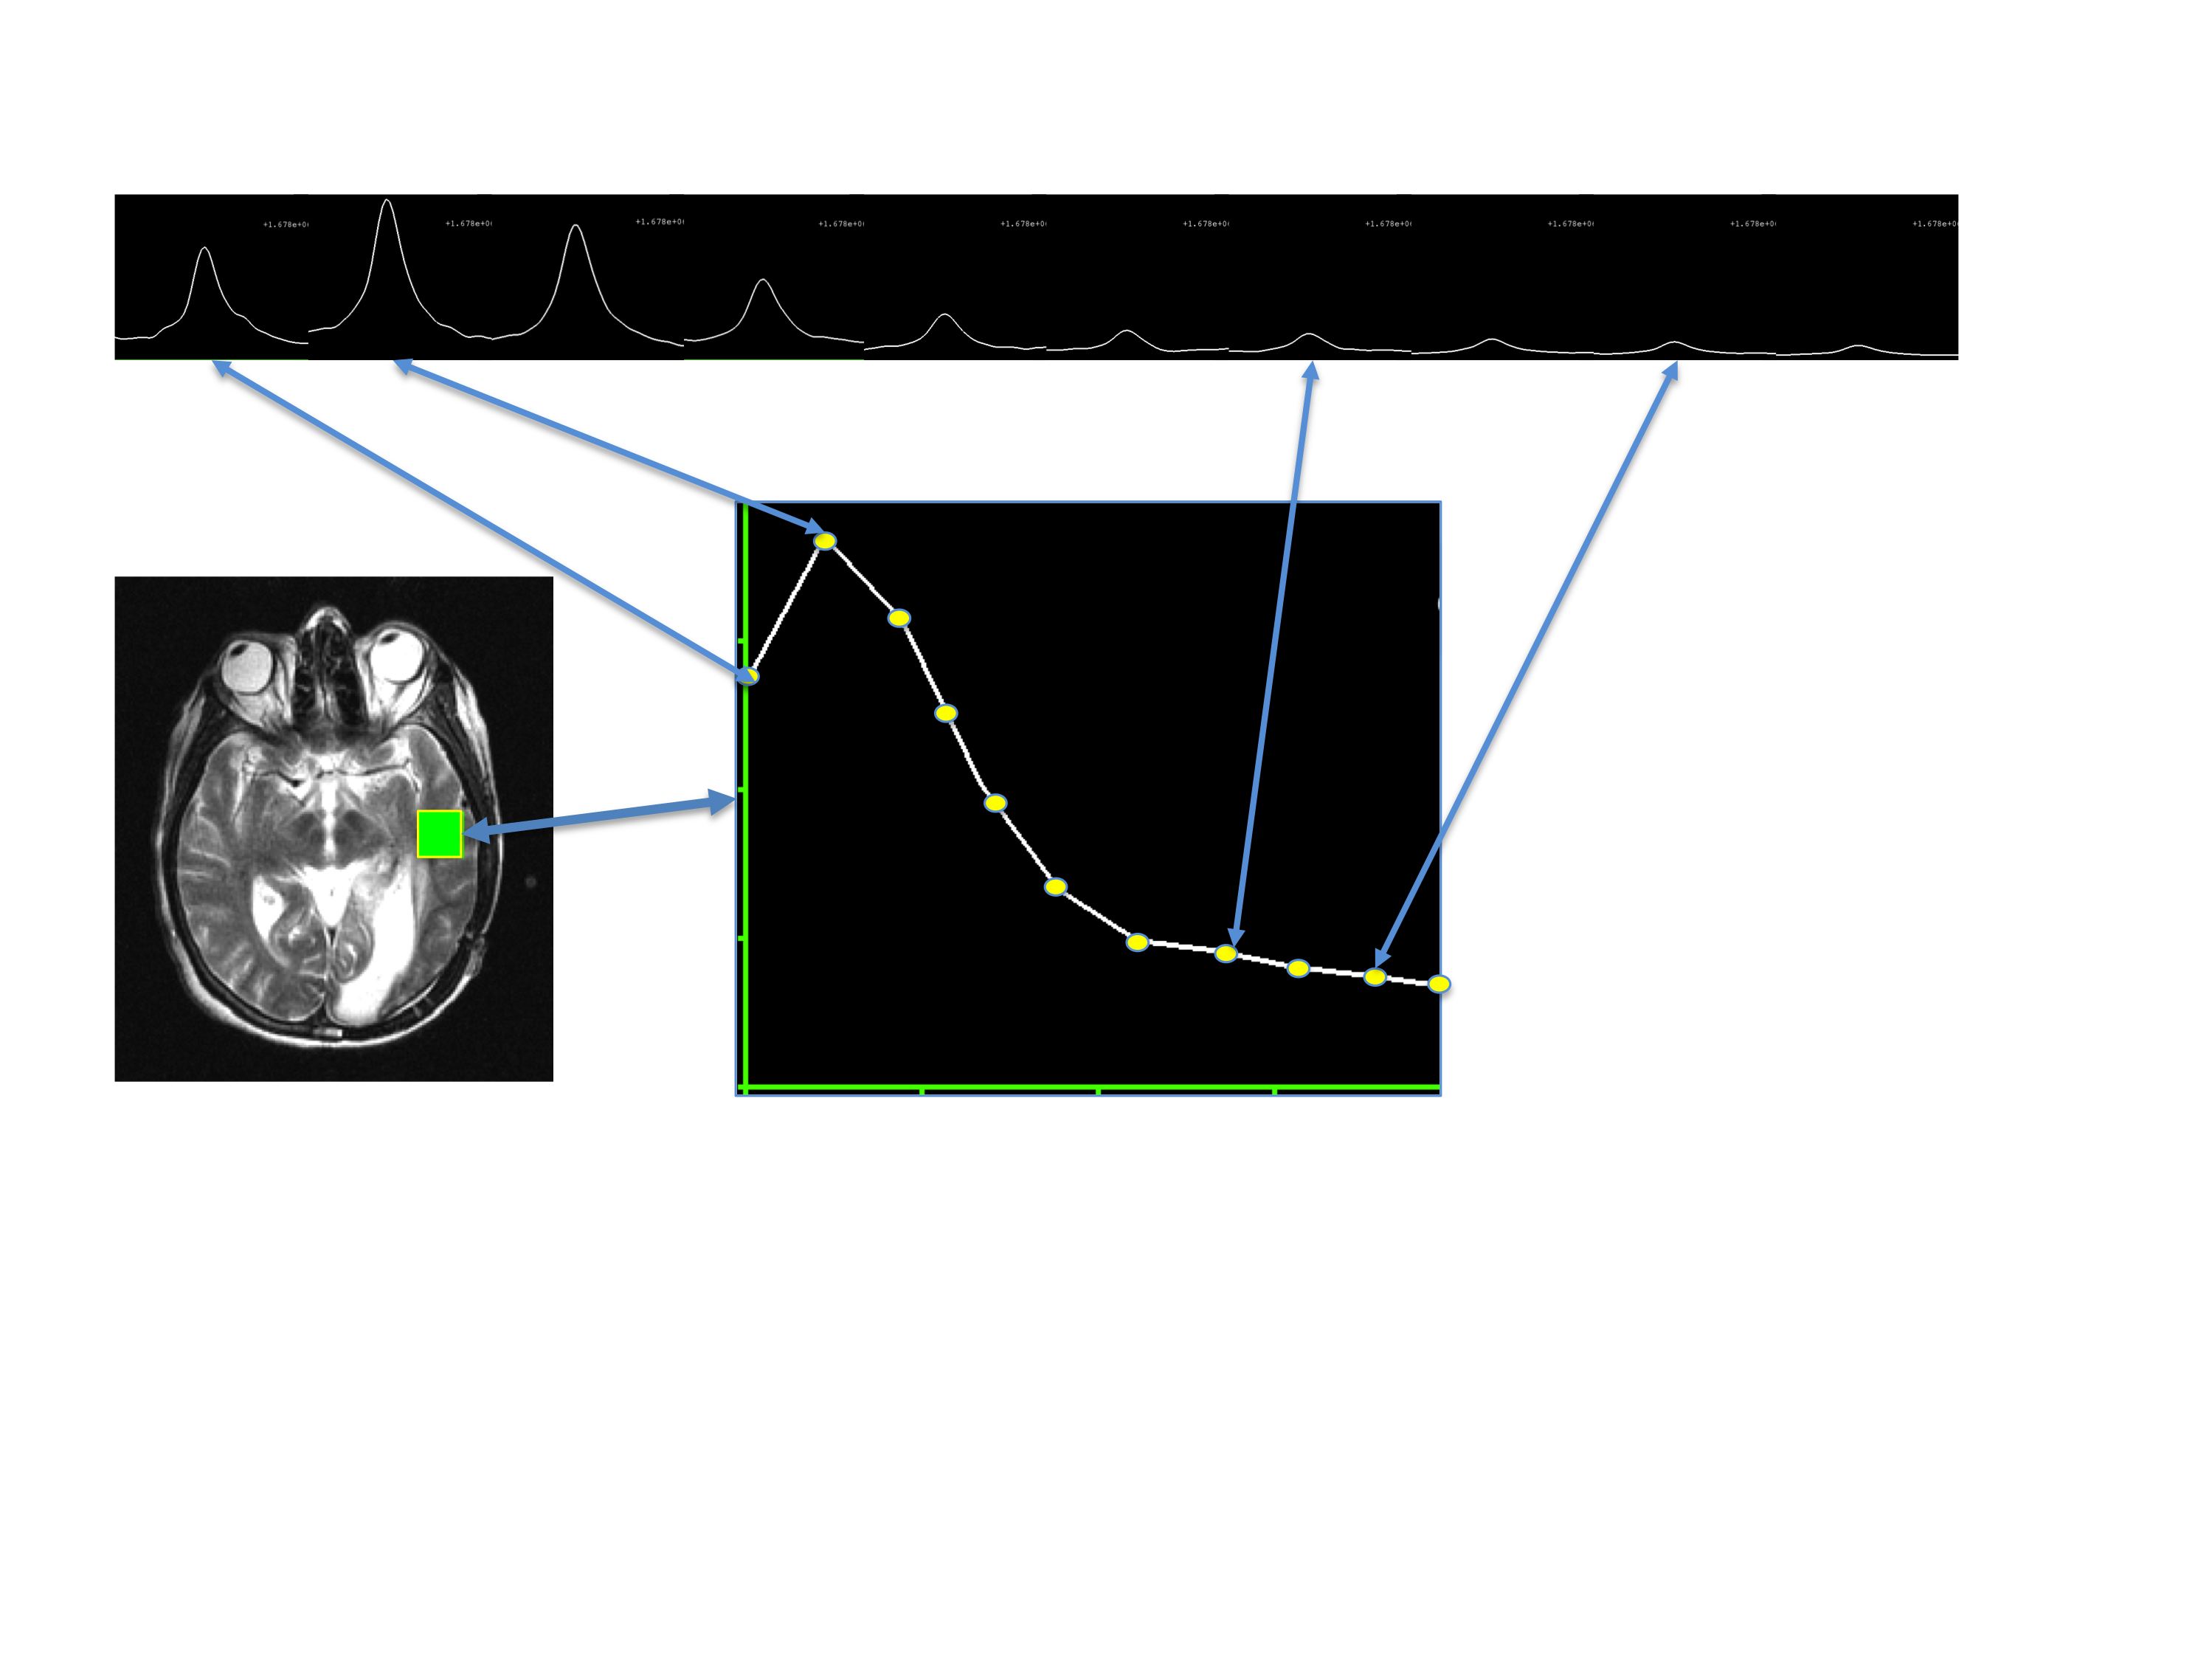
Two 2D dynamic EPSI 13C exams from a UCSF human brain tumor study1 that is evaluating HP [1-13C]pyruvate were used for model development. SIVIC command line tools were used to convert GE pfiles to DICOM MRS objects, apodize, zero-fill, FFT and quantify the data. Data were acquired with a two-band variable flip angle scheme and reconstructed data were corrected for the flip angle in each band for each time point prior to quantification. Magnitude peak heights of the 13C-pyruvate and 13C-lactate resonances were quantified for each voxel and time point (fig. 2) and results written to DICOM Enhanced MR Image storage objects. Quantified metabolite signals as a function of time were then given as input to the svk_met_kinetics application with a model number, the experimental temporal resolution and a mask to define which voxels to fit. All fitted parameter maps and computed signals based on the model fit were written to DICOM files (MRImageStorage or Enhanced MRImageStorage SOP classes).Results
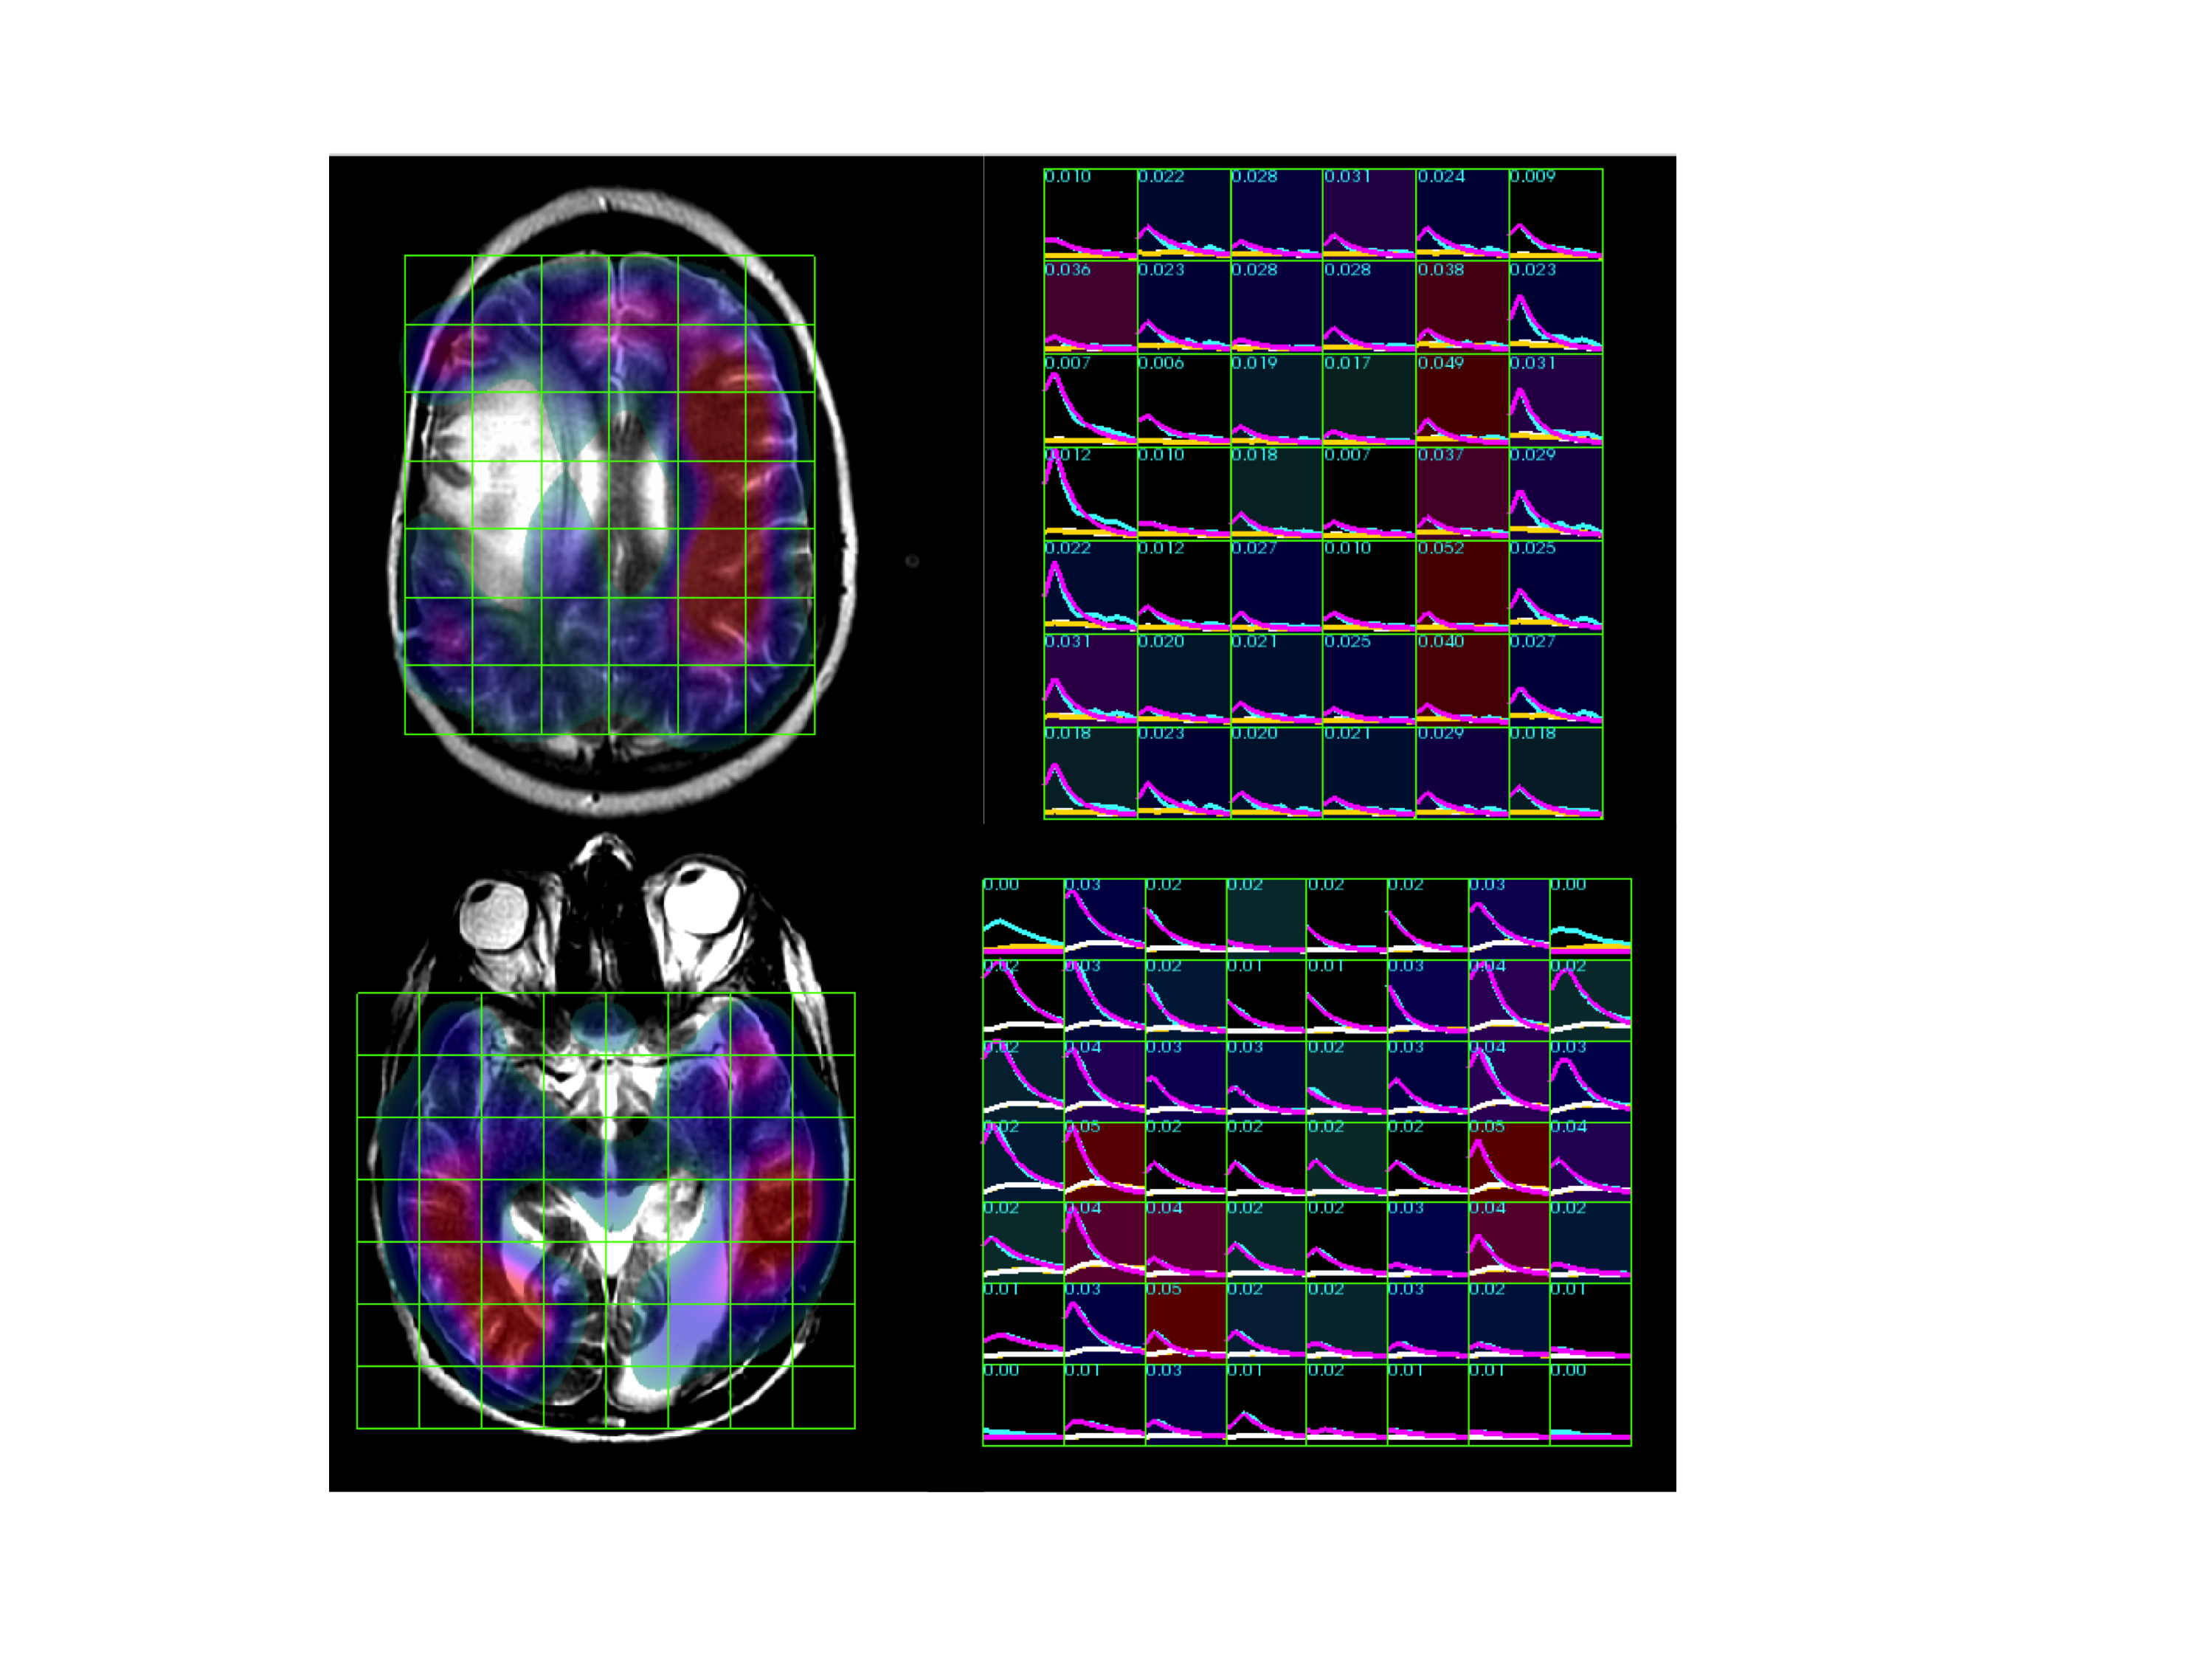
Models were implemented with 50-100 C++ statements and without extensive knowledge of C++, but require compiling into the SIVIC package. Parameter maps were generated automatically and permitted fits from different models to be compared visually. 3D maps of fitted parameters can be viewed in any standard DICOM viewer. The SIVIC GUI was able to display the time series of signal intensity maps as arrays of dynamic curves (fig. 2,3) for visualizing dynamic signals and fits. Run times on a 2.3 GHz MacBook Pro ranged from 1-3 seconds per voxel depending on the model, and optimizer parameters Kpl values from the 2-site exchange model applied to both data sets are shown in figure 3. Fitted Kpl values ranged from approximately .01 - .05 s-1. Contralateral values were symmetrically distributed except within the lesions.Conclusions
Future work will focus on comparison and validation of models, and correlation with tissue sample histology. The robustness of the tools will be improved by comparing different optimizer algorithms and methods for defining initial parameter values. Comparison of results obtained using variable and constant flip angle schemes will be compared.Acknowledgements
This work was supported by NIH grant P41 EB013598.References
1. Park I, Larson PEZ, Gordon J, Carvajal L, Chen HY, Bok R, Wilson D, Chow J, Ferrone M, Kurhanewicz J, Vigneron DB, Chang S, Nelson1 SJ. Hyperpolarized 13C Metabolic Imaging of Patients with Brain Tumors. World Molecular Imaging Congress, 7-10 September 2016, New York, United States
2. Harrison C. et al. Comparison of kinetic models for analysis of pyruvate-to-lactate exchange by hyperpolarized 13C NMR. NMR Biomed. 2012;(25):1286–1294.
3. Gómez Damián PA et al. Multisite Kinetic Modeling of (13)C Metabolic MR Using [1-(13)C]Pyruvate. Radiol. Res. Pract. 2014; 871619.
4. Xing Y, Reed GD, Pauly JM, Kerr AB, Larson PEZ, Optimal variable flip angle schemes for dynamic acquisition of exchanging hyperpolarized substrates, J. Magn.Reson. 2013;(234):75-81.
5. Crane JC, Olson MP, Nelson SJ, SIVIC: Open-Source, Standards-Based Software for DICOM MR Spectroscopy Workflows. Int. J. Biomed. Imaging 2013;169526.
6. SIVIC source code on GitHub: https://github.com/SIVICLab/sivic, accessed 11/16.
7. The National Library of Medicine. ITK, Insight Segmentation and Registration Toolkit. at <https://itk.org/>,accessed 11/16.
8. Zierhut ML et al. Kinetic modeling of hyperpolarized 13C1-pyruvate metabolism in normal rats and TRAMP mice. J. Magn. Reson. 2010;(202):85–92.
9. Swisher CL et al. Automated Kinetic Modeling of Perfusion and Metabolism Based on Dynamic Hyperpolarized 13 C Data With Open- Source SIVIC Software ISMRM Annu. Meet. 2014:3793.
Figures