2938
31P MR spectroscopy of peripheral artery occlusive disease patients with and without diabetes1MR-unit, Institute for Clinical and Experimental Medicine, Prague, Czech Republic, 2First Faculty of Medicine, Charles University, Prague, Czech Republic, 3Transplant Surgery Dept., Institute for Clinical and Experimental Medicine, Prague, Czech Republic, 4Dept. Diabetology, Institute for Clinical and Experimental Medicine, Prague, Czech Republic, 5Dept. Diagnostic and Interventional Radiology, Institute for Clinical and Experimental Medicine, Prague, Czech Republic
Synopsis
Reduced blood supply limits the oxidative muscle metabolism and causes acidosis due to anaerobic glycolysis. Similar results were found in patients with peripheral artery occlusive disease (PAOD) in which chronic ischemia causes claudication and restricts walking distance. 31P MR spectroscopy of calf muscles of healthy controls and patients show that PAOD significantly influences muscular metabolism which is reflected in dynamic parameters of PAOD patients. The effect of diabetes is significantly pronounced in diabetic PAOD patients at rest compared to controls and PAOD patients without diabetes.
Introduction
Reduced blood supply limits the oxidative muscle metabolism and causes acidosis due to anaerobic glycolysis. Similar results were found in patients with peripheral artery occlusive disease (PAOD) in which chronic ischemia causes claudication and restricts walking distance. With the progression and duration of ischemia the incidence of ulcers formation, limb gangrene and amputation of lower extremity increases. One of the diseases which is involved in forming critical ischemia in PAOD patients is diabetes mellitus (DM).Subjects and methods
66 subjects were divided into: a) control group (CG) - 19 healthy subjects (body mass index (BMI) = 27.1±4.1 kg/m2, mean age = 58±10 years); b) nondiabetic patients (PAOD) - 19 subjects (BMI = 26.4±4.3 kg/m2, mean age = 70±8 years, ankle brachial index (ABI) = 0.59±0.19, walking distance on the belt (treadmill test) = 400±310 m); c) diabetic PAOD patients (DPAOD) – 28 subjects, Fontaine criteria stage IV; (23 patients with DM2 and 5 patients with DM1; BMI = 28.6±4.2 kg/m2, mean age = 67±8 years, TcPO2 = 26+12 mmHg). Patients with DM1 and DM2 were pooled.
All the subjects provided their informed consent in line with local Ethical Committee rules.
Spectra were analyzed by AMARES (jMRUI 5.0 software). Lorentzian line shapes were applied for signals: phosphocreatine (PCr, 0 ppm), inorganic phosphate (Pi, 4.94 ppm), phosphodiesters (PDE: glycerol-3-phosphorylcholine and glycerol‑3‑phosphorylethanolamine; 2.99 resp. 3.51 ppm), adenosine triphosphate (ATP: α -7.35 ppm, γ -2.28 ppm, β -15.5 ppm). The relative chemical shift of Pi and PCr was used to calculate intracellular pH [1].
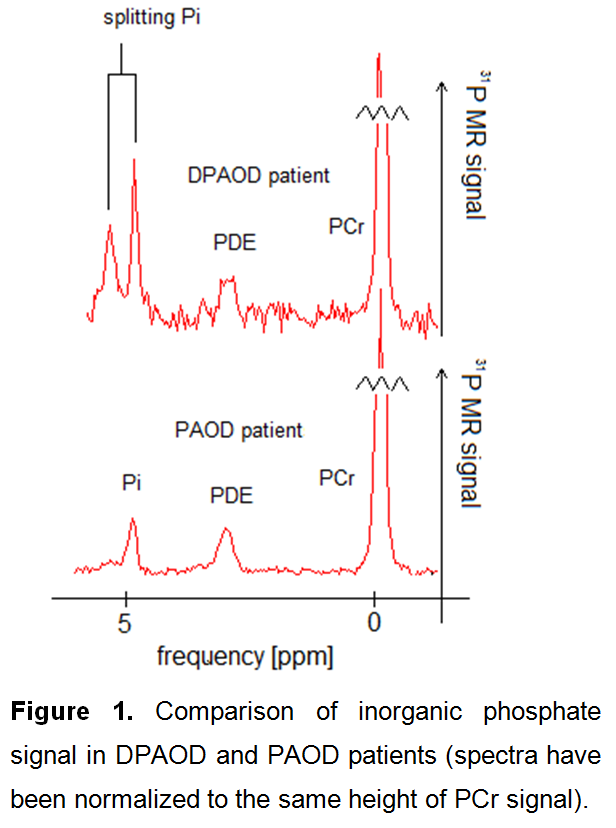
Spectra obtained during the exercise and recovery periods were used to calculate a drop of PCr (∆PCr), PCr recovery rate (τPCr), pH at the end of the exercise (pHend). Mitochondrial capacity Qmax was calculated according to [2]. Typical spectra are shown in Figure 1.
Results
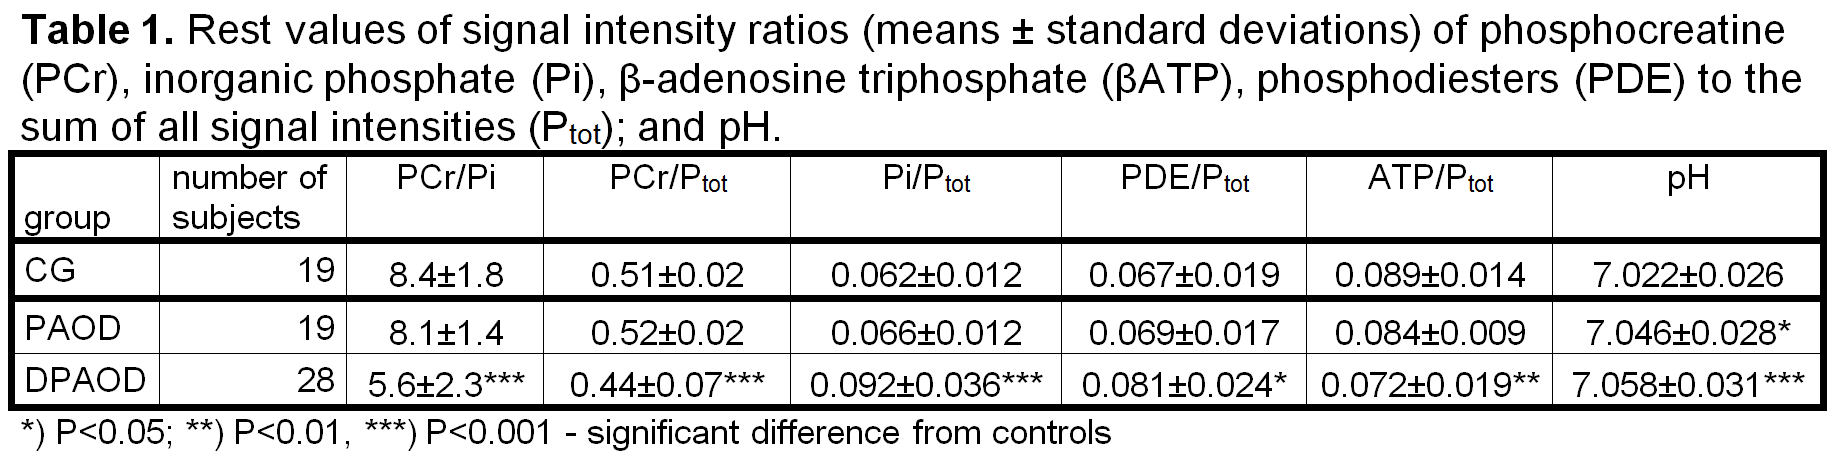
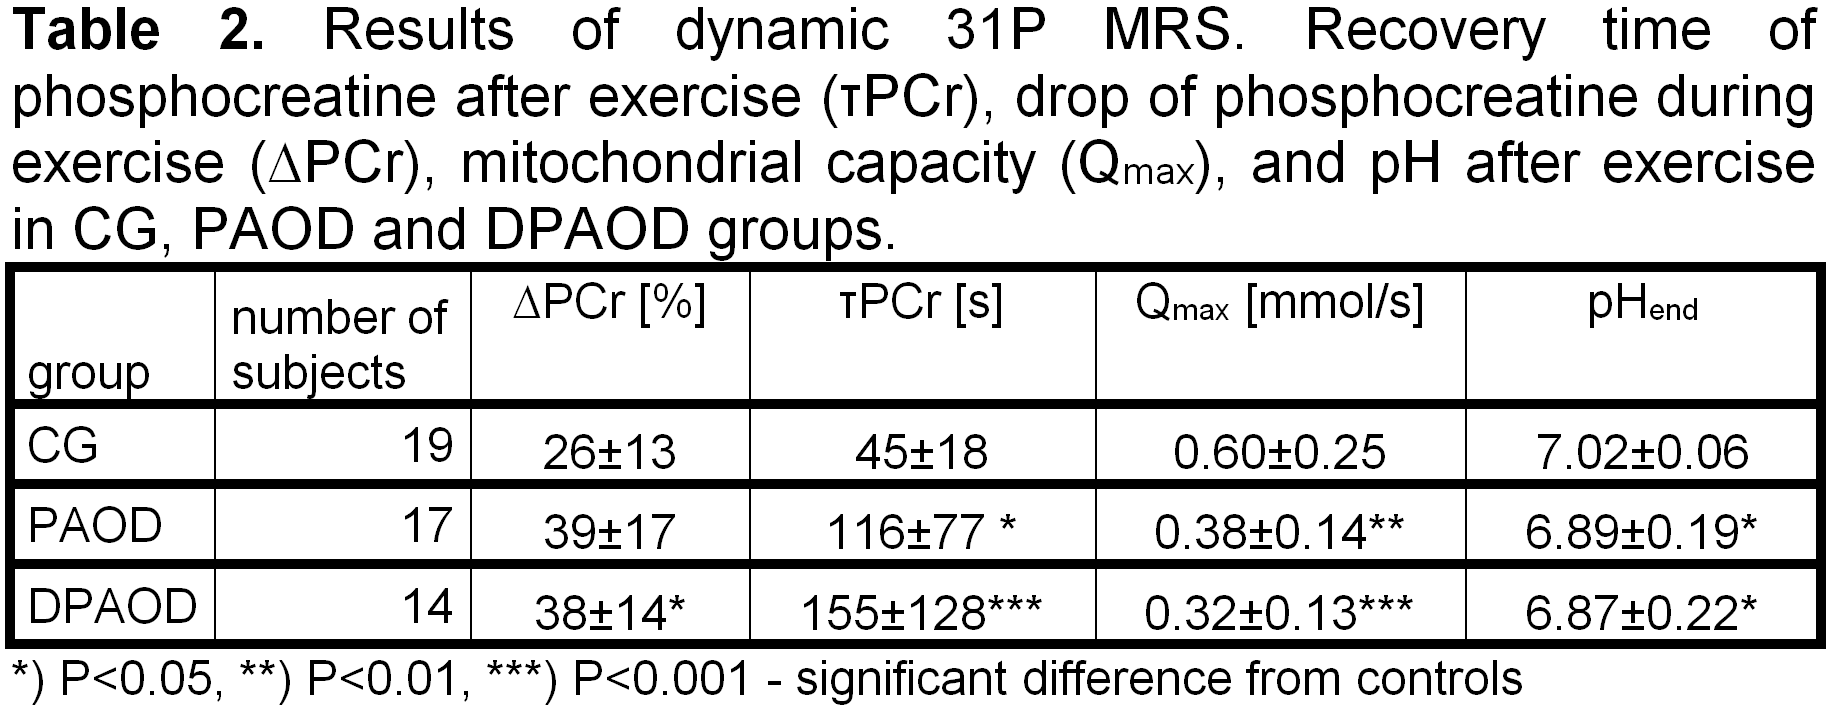
Signal intensity ratios of PCr, Pi, βATP, and PDE to the sum of all 31P intensities (Ptot) were used for the characterization of calf muscles at rest and results are summarized in Table 1. Significant differences were found in DPAOD patients from controls as well as between DPAOD and PAOD groups. Dynamic 31P MR parameters obtained during exercise and recovery periods are summarized in Table 2. ANOVA analysis showed significant differences in dynamic parameters between controls and both PAOD and DPAOD groups, no differences between patient groups in dynamic parameters were observed. Significant correlation between MRS and clinical data was only found in Pi/βATP and ABI (Pearson's correlation coefficient r=0.40, P=0.044); PDE/Ptot ratio correlates well with BMI in all subjects (r>0.26).Discussion
We did not find any significant difference in rest parameters between GC and PAOD groups with the exception of pH similarly as in [3,4]. By contrast, rest parameters in the DPAOD group significantly differed both from the controls and PAOD patients. The PCr/Pi ratio in our PAOD group is not significantly changed compared to controls and its reduction occurs only in DPAOD patients similarly as in many severe muscular diseases, e.g. dystrophies. Increasing phosphodiesters concentrations are consistent with the development of muscular myopathies in these DPAOD patients.
A Qmax decrease of approximately 40%, more than a double prolongation of post exercise τPCr recovery and increasing pH and ∆PCr in both PAOD and DPAOD groups are in agreement with former dynamic 31P MRS studies of PAOD patients, see Table 2. PAOD patients’ muscles suffer from malnutrition and insufficient oxygen supply. It results in a significant bioenergetic deterioration in the PAOD legs. These effects are even more pronounced in the presence of diabetes. In five DPAOD subjects, the split of the Pi signal at rest was detected. Contrary to findings at 7T [5], we suppose that the signal of alkaline phosphate in our patients originates from the swelling of muscular cells, hence the signal of alkaline phosphate Pi can be attributed to extracellular inorganic phosphate.
Conclusion
31P parameters of muscles of healthy controls and patients show that PAOD significantly influences muscular metabolism which is reflected in dynamic parameters of both the PAOD and DPAOD patients. The effect of diabetes is significantly pronounced in DPAOD patients at rest compared to controls and PAOD patients without diabetes.Acknowledgements
The study was supported by GAUK no. 315 and 00023001 IKEM Institutional support.References
[1] Moon RB, Richards JH. Determination of intracellular pH by 31P magnetic resonance. J Biol Chem. 1973; 248:7276-8.
[2] Kemp GJ. Interactions of mitochondrial ATP synthesis and the creatine kinase equilibrium in skeletal muscle. J Theor Biol. 1994; 170:239-46.
[3] Isbell DC, Berr SS, Toledano AY, Epstein FH, Meyer CH, Rogers WJ, Harthun NL, Hagspiel KD, Weltman A, Kramer CM. Delayed calf muscle phosphocreatine recovery after exercise identifies peripheral arterial disease. J Am Coll Cardiol. 2006; 47(11):2289-95.
[4] Kemp GJ, Hands LJ, Ramaswami G, Taylor DJ, Nicolaides A, Amato A, Radda GK. Calf muscle mitochondrial and glycogenolytic ATP synthesis in patients with claudication due to peripheral vascular disease analysed using 31P magnetic resonance spectroscopy. Clin Sci (Lond).1995; 89(6):581-90 .
[5] Valkovic L, Chmelík M, Ukropcová B, Heckmann T, Bogner W, Frollo I, Tschan H, Krebs M, Bachl N, Ukropec J, Trattnig S Krššák M. Skeletal muscle alkaline Pi pool is decreased in overweight-to-obese sedentary subjects and relates to mitochondrial capacity and phosphodiester content. Sci Rep. 2016; 6:20087.
Figures