2936
In vivo 31P spectroscopy of ATP levels during a fructose challenge in the liver at 7TIrene M.L. van Kalleveen1,2, Jurgen H. Runge1,3, Wybe J.M. van der Kemp4, Debra S. Rivera1,2,5, Jaap Stoker1, Dennis W.J. Klomp4, and Aart J. Nederveen1
1Radiology, Academic Medical Center, Amsterdam, Netherlands, 2Spinoza Centre, Amsterdam, Netherlands, 3Division of Imaging Sciences and Biomedical Engineering, King's College London, London, United Kingdom, 4Radiology, UMC Utrecht, Utrecht, Netherlands, 5MR Coils, Zaltbommel, Netherlands
Synopsis
The standard evaluation of detecting liver parenchyma is invasive liver biopsy, while MRS is a non-invasive measurement to monitor metabolites. Using 31P spectroscopy it is possible to follow metabolic changes in the liver and the functionality of the liver during fructose uptake by measuring ATP levels. Going to ultra-high field strength, we are more sensitive to ATP levels and are able to use more localized MRS sequences (e.g. 3D CSI). We have shown we are able to monitor ATP levels during fructose uptake in vivo in the liver at 7T and see a decrease in ATP levels during the uptake.
Purpose
The reference standard for the evaluation of liver parenchyma is invasive liver biopsy. MR spectroscopy (MRS) facilitates non-invasive measurements of several relevant metrics (e.g. steatosis1,2). Especially non-proton MRS3 opens the gateway to metabolic imaging, by which metabolic processes can be followed in vivo. However, these methods are less sensitive due to the low abundance of the relevant nuclei, resulting in a reduced signal-to-noise ratio (SNR). At ultra-high field MRI (e.g. 7T), the spectral resolution and sensitivity to obtain metabolic information are increased. However, B0 and B1 field inhomogeneities become more pronounced at ultra-high-field, while the energy deposition of RF pulses becomes more challenging. With 31P spectroscopy the functionality of the liver during fructose uptake4 can be tracked by measuring ATP signals (α, β, γ). During the uptake of fructose hepatic ATP levels are depleted during the phosphorylation of fructose to fructose-1-phosphate as this process (unlike glucose metabolism) has no negative feedback loop. This process is altered in certain liver diseases. Several studies have been performed at 1.5 and 3T4,5. The use of ultra-high field MRI could help further investigate this metabolic process and use the increase in SNR to localize the fructose uptake using 3D CSI with fewer averages.Methods
A surface coil consisting of two antennas tuned for proton and two loop coils tuned for phosphorus (MR Coils B.V., Zaltbommel, The Netherlands) were used with a 7T whole body MR scanner (Philips, Cleveland, USA). 1H scout images for planning the spectroscopy sequences were made. For the fructose challenge we used a dynamic 3D CSI scan with an adiabatic half passage for excitation (FOV = 320×320×320 mm3; TR = 700 ms; TE = 0.4 ms NSA = 1; voxel size = 40×40×40 mm3; NSA = 1; scan time = 4:42 min; 31P transmitter offset = -12 ppm ). For the fructose challenge a solution of 75 grams of fructose for oral intake was given to a fasted healthy volunteer before going into the scanner. The spectra from four neighbouring voxels in the liver were averaged prior to the spectral fitting in JMRUI (AMARES). Mean and standard deviation of the mean were plotted in the time domain of 20-100 minutes.Results
We obtained 3D CSI spectra in the liver (figure 1) and monitored an uptake of fructose by following ATP levels as shown in figure 2. The black banding in the scout image is due to signal cancelling between the two 1H antennas, however this effect is not present in the 31P spectroscopy, due to a difference in hardware settings. In figure 2 the levels of the different ATP components are plotted. Note the decrease in ATP levels, especially in the β –ATP, as a result of the fructose uptake in the liver.Discussion
The change over time during the fructose uptake seems to be the most pronounced in β-ATP. This might be caused by the residual PCr signal close to γ-ATP, resulting in some mismatch of the spectral fitting. For α-ATP, the NADH resonance frequency might contaminate the spectral analysis. This metabolite is closely positioned next to α-ATP and during the fructose uptake α-ATP is converted to NADH6. This will cause some errors during the spectral fitting of α-ATP, resulting in a smaller decrease of α-ATP during the uptake. On average, after 50 minutes the fructose uptake reaches the maximal effect and the ATP levels should be at the lowest4, resulting in long scan time. Additionally there is some intersubject variability, which necessitates adding some extra dynamic scans. However, together with the preparation scans and the time during uptake of the fructose, scan time can increase drastically. According to Bawden et al.4 it might be possible to use a combination of fructose and glucose. This will accelerate the uptake in the liver and hence the ATP-depletion. However, fructose is converted in the liver, while glucose is converted in the whole body, resulting in less change in ATP levels in the liver. Therefore some loss in sensitivity can be expected. If only the nadir of the ATP levels is required (and not full recovery), this could also shorten the scan time.Conclusion
We have shown as a proof of principle that we are able to monitor the fructose uptake in the liver using a 3D CSI sequence at 7T. We can see the ATP dropping during the fructose uptake, as expected. This effect seems to be best visible and quantifiable in β -ATP.Acknowledgements
No acknowledgement found.References
1. Cowin et al. J magn reson imag 2008; 2. Georgoff et al. Am J Roentgenol. 2012; 3. Chmelik et al. NMR in biomed; 4. S.J. Bawden et al. Clin Nutr ESPEN 2015; 5. Boesch et al. Magn Reson Imaging 1997; 6. Tappy et al. Nutr Metab 2013.Figures
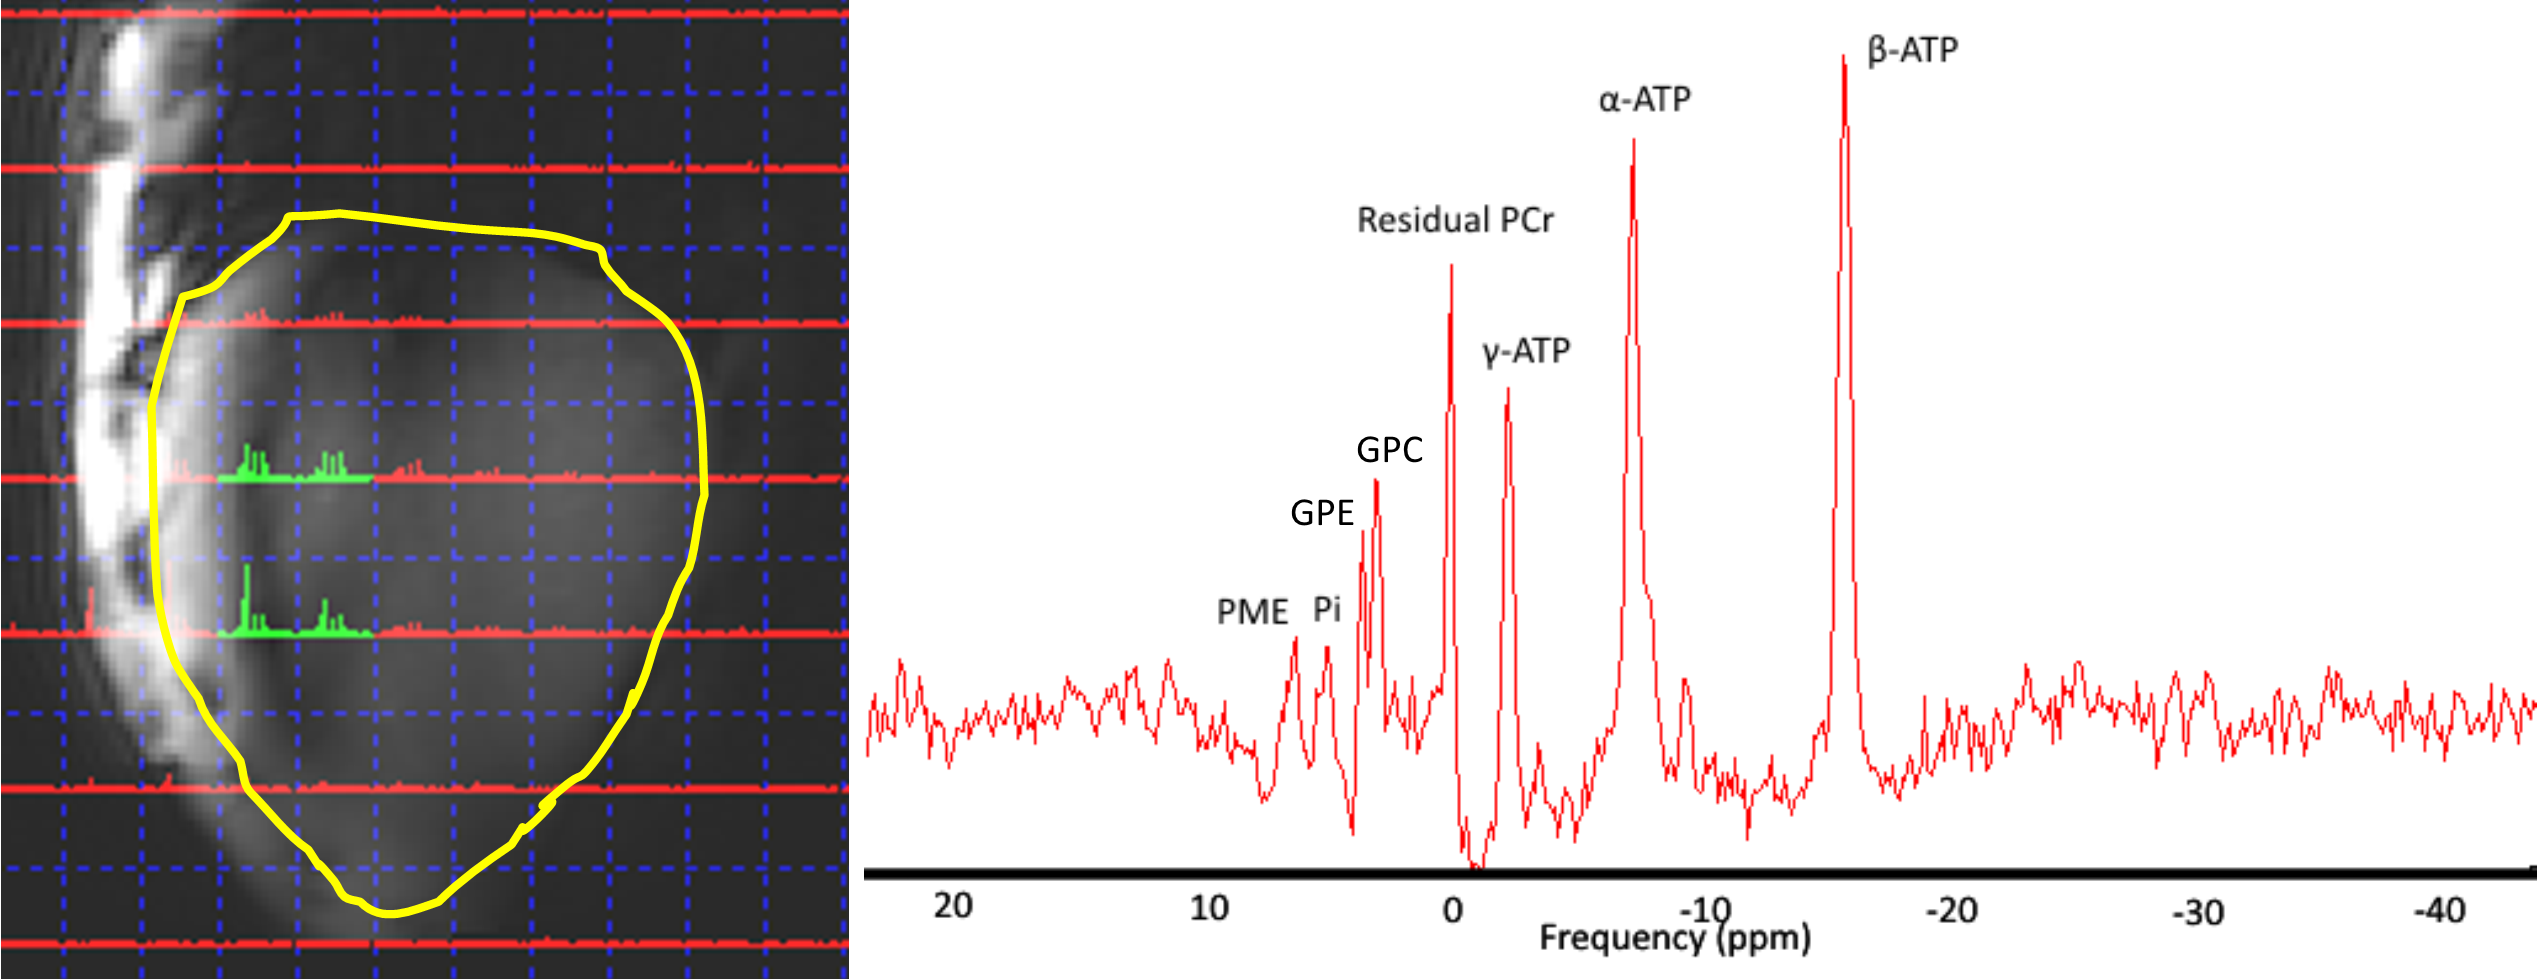
Figure 1. Location of
the four selected spectroscopic voxels in the liver (yellow contour) used for the
quantification of α, β and γ-ATP (left) and a
spectrum from one of the selected voxels (right).
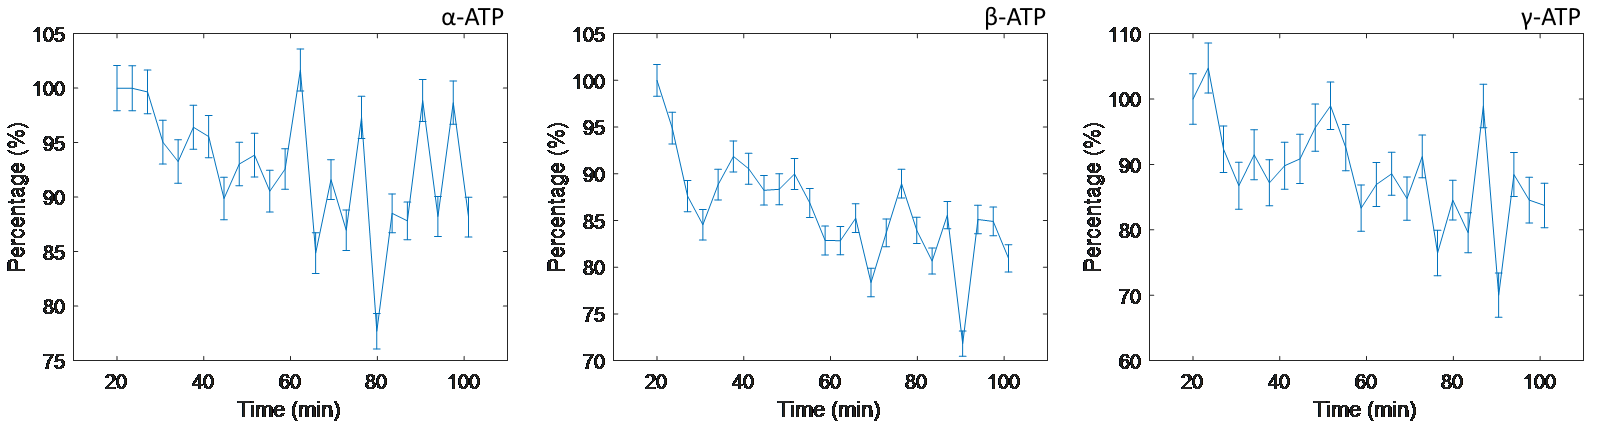
Figure 2. The change in ATP levels
during fructose uptake. Note the dropping of the individual ATP components as
validated by literature. The values are normalized to the value of the first
dynamic of the dynamic CSI series.