2934
Phosphocreatine T1 in human gastrocnemius muscle at 7T increases during exercise, measured by localized 31P MRS with progressive saturation1Center for Medical Physics and Biomedical Engineering, Medical University of Vienna, Vienna, Austria, 2Department of Internal Medicine III, Medical University of Vienna, Austria
Synopsis
Alterations in T1 have implications on the physiological interpretation of dynamic high-energy phosphate data. Progressive saturation during rest-exercise-recovery experiments was used to simultaneously quantify PCr depletion, recovery and T1 values. The data were acquired using localised 31P MRS in human gastrocnemius. Apparent T1 values increased from 5.0 ± 0.4 s at rest to an average value of 5.8 ± 0.5 s during exercise, with a peak in early exercise and returning towards baseline values before exercise was ceased. These alterations may be explained by changes in the chemical exchange rates of PCr with ATP and Pi.
Purpose / Introduction
With any MR measurement performed under partial saturation of spin systems, knowledge of the transversal relaxation time (T1) is essential for quantitation of metabolites concentrations and their kinetics. Commonly, constant T1 is assumed within a measurement, and is the prerequisite for deriving important parameters for dynamic muscle studies such as e.g. the phosphocreatine recovery time constant (τPCr) after depletion during exercise. Constant T1s throughout the experiment are assumed when estimating the PCr depletion and the supposedly invariant sum of all 31P signals, and often used as reference. Unfortunately, constancy of metabolite T1 during exercise is not necessarily guaranteed in dynamic muscle exercise [1, 2], because PCr takes part in chemical exchange with adenosine triphosphate (ATP) and inorganic phosphate (Pi) during exercise. Changing pH and resulting fluid shifts may further impact relaxation times. The effect of exercise on T1 of phosphorylated metabolites has been studied earlier [1, 3], i.e. at lower B0 field (1.5-1.9T) than available in modern scanners (3-7T). However, T1 is B0-dependent and prevalence of relaxation mechanisms vary between metabolites, leading to different field-dependence of T1 [4]. Also saturation transfer measurements during muscle exercise [5, 6] require T1 assessment during (steady-state) exercise, and T1 has been assumed to be constant during either rest or exercise in these recent studies. Here, time-resolved T1 measurements based on progressive saturation with localised 31P-MRS at 7T were performed continuously during rest, exercise and recovery.Methods
A custom-built RF-coil [7] was used to acquire semi-LASER [8] localised (VOI=30-40cm3) data at 7T. 31P spectra were acquired from the gastrocnemius medialis (GM) of six volunteers after written informed consent, according to the Declaration of Helsinki and the local ethics committee. To quantify T1, progressive saturation was achieved with either four or five variable repetition times TR = {1.3,2,5,10} or {0.7,1,2,5,10} seconds. The protocol was optimised to enable five-point progressive saturation after data from the first three subjects had been acquired. Submaximal plantar flexion exercise (<220N) was executed on a non-magnetic ergometer and timed to the acquisition with varying TR in 1, 2 and 3 pushes: Fig. 1 shows the force on the pedal during the plantar flexions, which were successfully executed during the periods without RF pulses, gradients or 31P MRS data acquisition. MR spectra were quantified with jMRUI/AMARES.
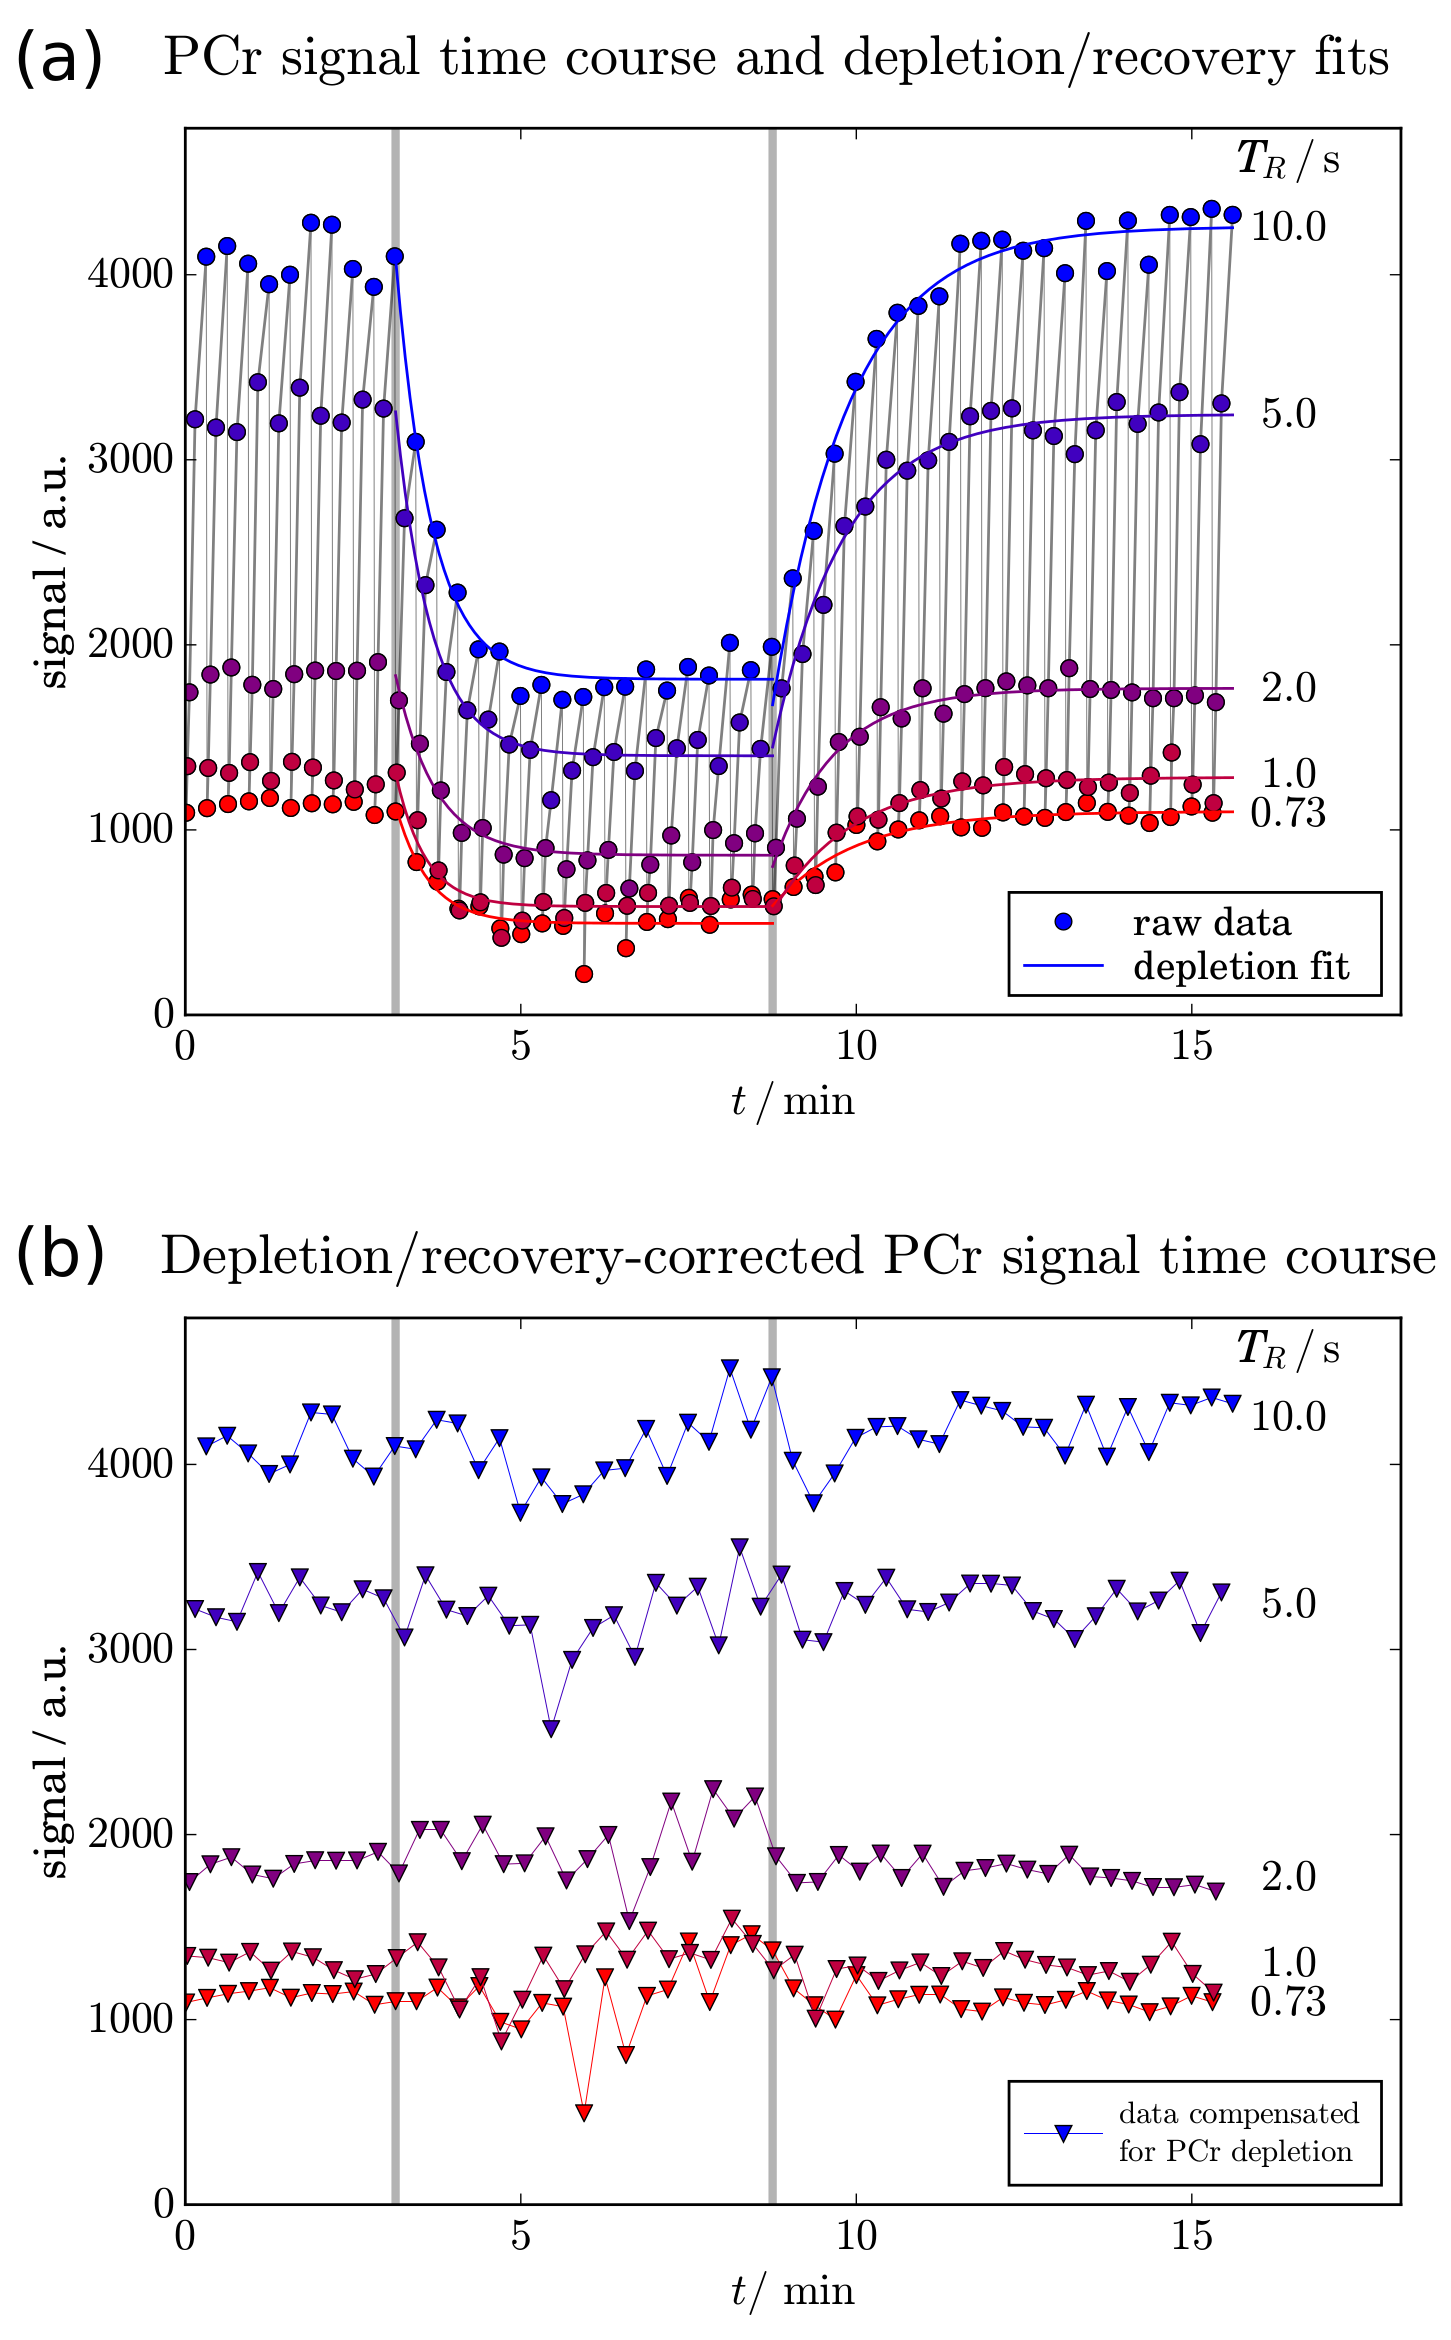
To separate the effects of exercise-induced metabolite depletion from the T1-dependent partial saturation, series of mono-exponential curves were fitted to the data after reordering into bins of equal TR. The fitted PCr time curves were then used to correct data for depletion during exercise and recovery. T1 was quantified in each group of four or five acquisitions, yielding a T1 value every 18.3s (or 18.7s) throughout the experiment. Optional moving averaging of binned data was implemented to improve reliability of the T1 fit, reducing temporal resolution.
Results
Plantar flexion exercise lead to 72 ± 13 % PCr depletion (Fig. 2), leaving sufficient signal for T1 quantification of PCr throughout the time-resolved experiments. The PCr signal showed the effects of TR-dependent partial saturation and exercise-induced PCr depletion. Data acquired in a series were binned by equal TRs (see colours in Fig. 2). Mono-exponential fits (Fig. 2a) of PCr depletion and recovery were used to eliminate the effect of PCr depletion (Fig. 2b). These corrected data were then used to estimate T1 by another mono-exponential fit.
Fig. 3 shows T1 time courses of a single subject (a) and of all subjects overlaid and averaged (b). T1 was 5.0 ± 0.4 s at rest, increased significantly (p < 0.01) to 5.8 ± 0.5 s on average throughout the entire exercise, and returned to 5.3 ± 0.2 s during recovery. All data are given as mean ± SD.
Discussion / Conclusion
T1 was successfully quantified with 18.3 s time resolution even under strong temporal [PCr] changes, yielding resting T1s consistent with literature [4]. At 7T, prolongation of T1 of PCr during exercise was reported [5, 6], opposite to findings at lower field [1]. A plausible explanation is that PCr's apparent T1 is shorter than inorganic phosphate's (Pi) at 7T, but longer at 1.5T. The phosphocreatine T1 time course shows an increase in the first two minutes of submaximal exercise, and returns towards basal values before exercise is ceased. Whether this is potentially related to PCr splitting and glycolysis, which shows a similar time course at initial exercise [9], will be subject of further investigations. More in-depth analysis of Pi's T1, and further measurements are promising to shed light on the question whether chemical exchange or other factors are governing exercise-induced T1 changes at 7T.Acknowledgements
Funding by Austrian Science Fund (FWF) project No. I 1743-B13 is gratefully acknowledged.References
[1] Newcomer BR, Boska MD. T1 measurements of 31P metabolites in resting and exercising human gastrocnemius/soleus muscle at 1.5 Tesla. Magn Reson Med 1999;41:486494.
[2] Schär M, El-Sharkawy AM, Weiss RG, Bottomley PA. Triple repetition time saturation transfer (TriST) 31P spectroscopy for measuring human creatine kinase reaction kinetics. Magn Reson Med 2010; 63:14931501.
[3] Horská A, Spencer RG. Measurement of spin-lattice relaxation times and kinetic rate constants in rat muscle using progressive partial saturation and steady-state saturation transfer. Magn Reson Med 1996; 36:232240.
[4] Bogner W, Chmelík M, Schmid AI, Moser E, Trattnig S, Gruber S. Assessment of 31P relaxation times in the human calf muscle: a comparison between 3 T and 7 T in vivo. Magn Reson Med 2009; 62:574582.
[5] Tušek J, Chmelík M, Bogner W, Krššák M, Trattnig S, Valkovic L. Feasibility and repeatability of localized 31P-MRS four-angle saturation transfer (FAST) of the human gastrocnemius muscle using a surface coil at 7 T. NMR Biomed 2016;29:5765.
[6] Sleigh A, Savage DB, Williams GB, Porter D, Carpenter TA, Brindle KM, Kemp GJ. 31P magnetization transfer measurements of PiATP flux in exercising human muscle. J Appl Physiol (1985) 2016; 120:649656.
[7] Goluch S, Kuehne A, Meyerspeer M, Kriegl R, Schmid AI, Fiedler GB, Herrmann T, Mallow J, Hong SM, Cho ZH, Bernarding J, Moser E, Laistler E. A form-fitted three channel 31P, two channel 1H transceiver coil array for calf muscle studies at 7T. Magn Reson Med 2015;73:11901195.
[8] Meyerspeer M, Scheenen T, Schmid AI, Mandl T, Unger E, Moser E. Semi-LASER-Localized Dynamic 31 P Magnetic Resonance Spectroscopy in Exercising Muscle at Ultrahigh Magnetic Field. Magn Reson Med 2011;65:12071215.
[9] Fiedler GB, Schmid AI, Goluch S, Schewzow K, Laistler E, Niess F, Unger E, Wolzt M, Mirzahosseini A, Kemp GJ, Moser E, Meyerspeer M. Skeletal muscle ATP synthesis and cellular H+ handling measured by localized 31P-MRS during exercise and recovery. Sci Rep 2016;6:32037.
Figures
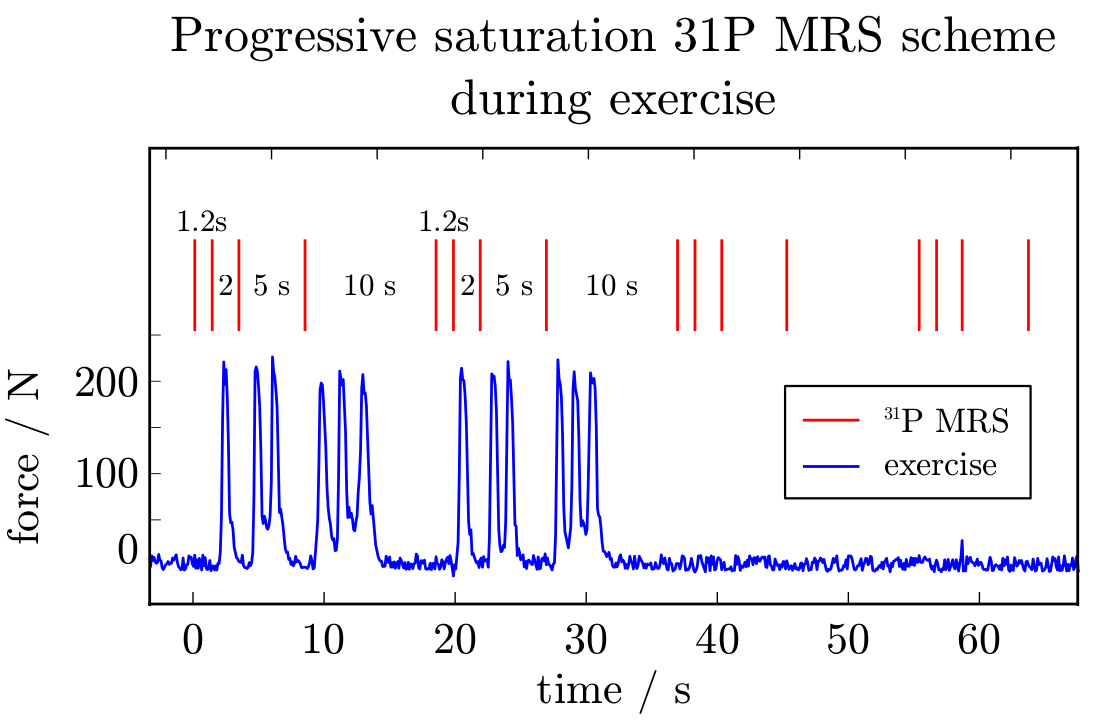
Fig. 1: Localized 31P MRS (red) were acquired with variable TR for progressive saturation, for continuous T1 measurements during rest, exercise and recovery.
Time course of the force on the pedal is shown in blue. Exercise was timed to avoid motion during periods of MR acquisitions. This allowed one, two or three pedal pushes between the data acquisitions with variable repetition times.