2931
Highly Accelerated 31P MRSI of Human Calf Muscles combining Flyback Echo Planar Spectroscopic Imaging (EPSI) and Compressed Sensing1Biomedical Engineering, McMaster University, Hamilton, ON, Canada, 2Electrical and Computer Engineering, McMaster University, Hamilton, ON, Canada
Synopsis
Very long acquisition times is the most important limitation against performing 31P magnetic resonance spectroscopic imaging (MRSI) in clinic environments. To overcome this limitation we show the feasibility of implementing in vivo highly accelerated 31P-MRSI combining flyback echo planar spectroscopic imaging (EPSI) and compressed sensing (CS) achieving a 12x12 matrix over a 24 cm field of view (FOV) in less than 6 minutes. Due to the denoising nature of CS the resultant SNR was also improved using this approach.
Introduction
Phosphorus Magnetic Resonance Spectroscopic Imaging (31P-MRSI) is capable of assessing energy phosphate-containing metabolites in vivo such as phosphocreatine (PCr), inorganic phosphate (Pi) and adenosine triphosphate (ATP). The main limitation for its clinical utility is the required very long acquisition time, necessary to account for low intrinsic SNR. To overcome this limitation previous reports showed feasibility of in vivo experiments using flyback-EPSI [1,2] and Compressed Sensing (CS) [3,4] separately. Furthermore, a combined scheme of these techniques showed good results for hyperpolarized 13C-MRSI [5,6]. The purpose of this study was to test the feasibility of combining a flyback-EPSI readout with CS in the acquisition of 31P-MRSI.Methods
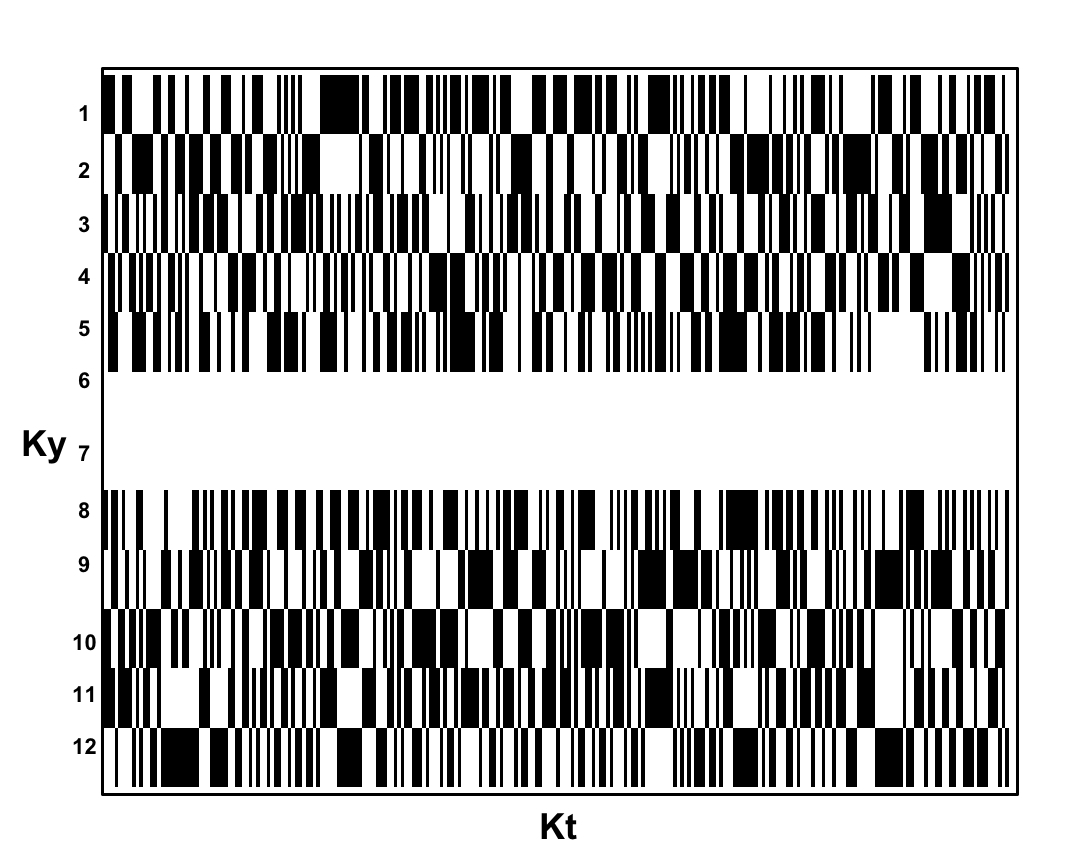
A 3D (Kx-Ky-Kt) fully sampled (FuS) dataset was acquired from the right calf muscles of a healthy 30 years old volunteer using a flyback-EPSI sequence [1] (TR=1500 ms, with 4,8 and 16 averages, spectral BW=1302 Hz, 4cm slice thickness, 2cm in-plane resolution, 12x12 matrix). Data was acquired using a 3T GE MR-750 with a home designed/built 31P-tuned (51.705 MHz) 7.62 cm (3 inch) surface coil tune and matched specifically for calf muscles. Pseudorandom sub sampling patterns were simulated to achieve acceleration factors (AF) of 1.7/2/2.4 and 4, preserving the two central lines of k-space for AF=1.7/2.4 whereas AF=2/4 were sampled with uniform density. Masks were created to achieve similar sampling patters as those applied by Hu et al. [5]. Figure 1 shows an example of the mask used for AF=1.7 (Ky-Kt). CS reconstruction was performed as follows: (i) Data was reordered to create a 3D K-space dataset (Kx-Ky-Kt); (ii) inverse Fourier transform the fully sampled dimension Kx; (iii) Fill in the missing Ky-Kt points using the non linear conjugate gradient (NLCG) algorithm [7]; (iv) Forward transform the Kx dimension and zero filling the data to 1024 points in the time domain; and finally (v) perform 3D Fourier Transform. The sparsifying transformation was a 1D length-4 Daubechies Wavelet Transform and the total variation and transform weights were empirically chosen as 0.015 and 0.005 respectively. Data was processed in MATLAB using a modified version of the SparseMRI toolbox [7]. Lorentzian apodization of 3 Hz linewidth was applied to both fully sampled EPSI and CS reconstructed datasets.Results
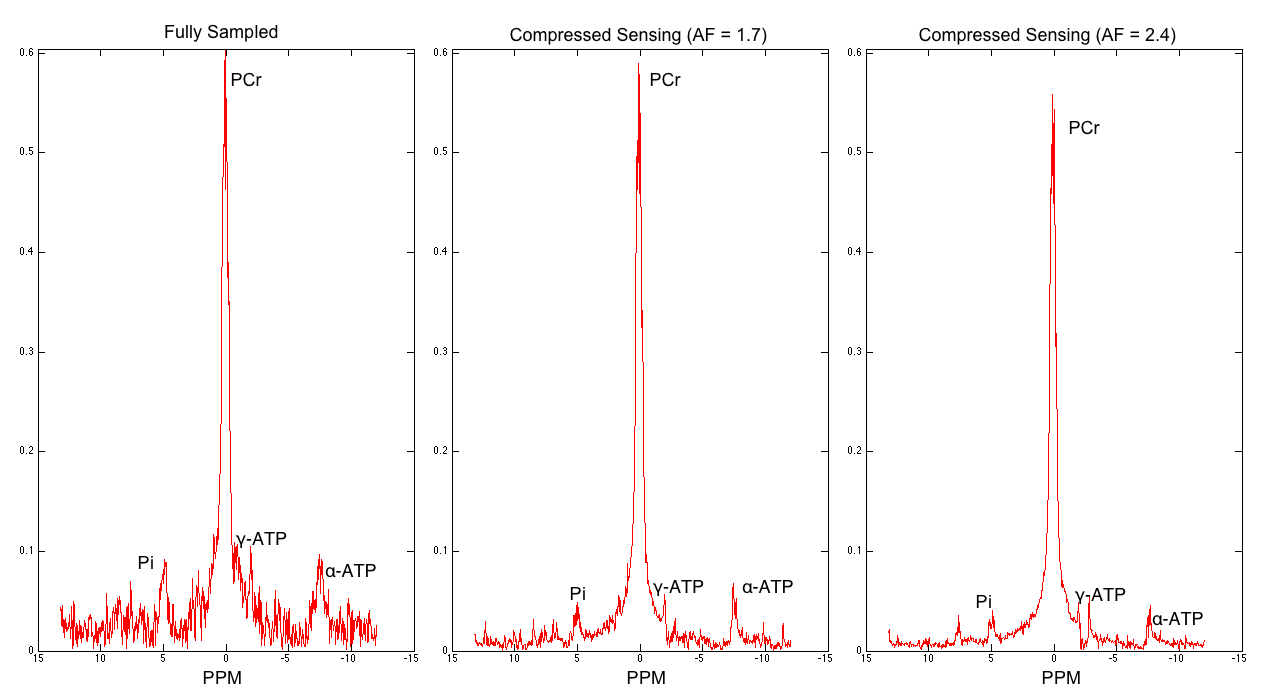
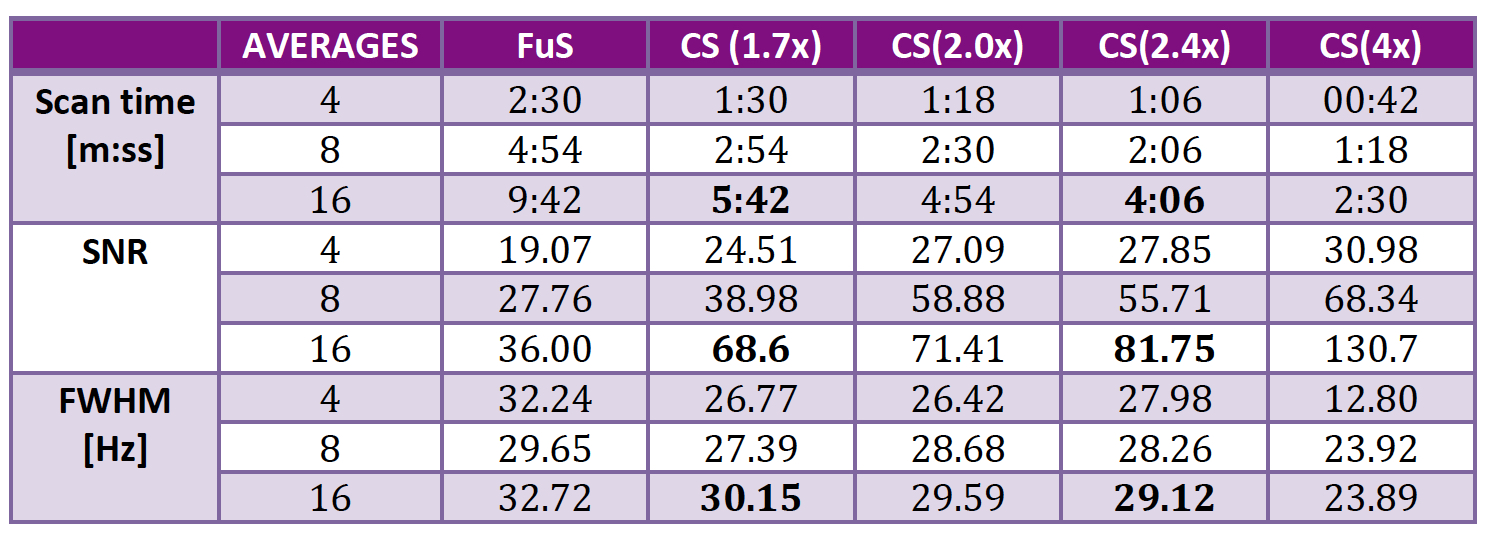
Table 1 shows SNR, acquisition time and FWHM for all scenarios. Reliable acquisition of 12x12 MRSI was possible in less than 6 minutes. Figure 2 shows a comparison of spectra reconstructed from FuS, AF=1.7 and AF=2.4. Figure 3 shows a subsection of 6x8 elements from the 12x12 array as an overlay of the anatomical image to show data correspondence for the same acceleration factors as Figure 2.Discussion
CS reconstruction showed reasonable quality spectra with an acquisition time suitable for clinical settings. The denoising nature of CS is reflected by an improvement in SNR when comparing with fully sampled data and it allows identifying metabolites such as Pi and γ,α-ATP in the spectra (Figure 2). However the NLCG scheme used showed a strong attenuation of Pi and ATP signals for AF=2 and 4 due to the non-fully acquired central K-space lines. The FWHM for the PCr peak was comparable between the original and CS suggesting good reconstruction quality. This approach showed potential to create PCr maps of 12x12 elements, 2cm resolution in a scan time of 01:18 [mm:ss]Conclusion
This work showed the feasibility to perform highly accelerated 31P-MRSI in vivo when combining echo planar spectroscopic imaging (EPSI) and compressed sensing (CS). Future work will allow testing accelerated 4D data acquisitions.Acknowledgements
To CONACYT (MEXICO) for the scholarship granted (CVU: 304930)
References
[1] Santos-Diaz et al. Proc. Intl. Soc. Mag. Reson. Med. 24, p. 3936, 2016
[2] Santos Diaz et al. Proc. ESMRMB 2016, P. 474.
[3] G. H. Hatay et al. Proc. Intl. Soc. Mag. Reson. Med. 21, 2013.
[4] G. H. Hatay et al. Proc. Intl. Soc. Mag. Reson. Med. 22, 2014.
[5] S. Hu et al. J. Magn. Reson., vol. 192, no. 2, pp. 258–264, 2008.
[6] S. Hu et al. Magn. Reson. Med., vol. 63, no. 2, pp. 312–321, 2010.
[7] M. Lustig et al. Magn. Reson. Med., vol. 58, no. 6, pp. 1182–1195, 2007.
Figures