2930
Multi-parametric MRI assessment of tumor progression in a mouse model of pancreatic cancer1Department of Radiology, University of Washington, Seattle, WA, United States, 2Center for Industrial and Medical Ultrasound Applied Physics Laboratory, University of Washington, Seattle, WA, United States, 3Department of Medicine, University of Washington, Seattle, WA, United States
Synopsis
Pancreatic ductal adenocarcinoma (PDAC) is one of the most common forms of lethal human cancers with poor prognosis. Diagnosis is made usually late in tumor development. There is a dire need to develop sensitive non-invasive biomarkers to diagnose and monitor tumor progression and its associated pathological features. We propose to use multi-parametric MRI (mpMRI) to monitor tumor progression in a genetically engineered KPC mouse model that recapitulates human PDAC. Using mpMRI, we demonstrate that there is a significant correlation between increase in pancreatic tumor volume, Magnetization transfer ratio (MTR), apparent diffusion coefficient (ADC), and chemical exchange saturation transfer (CEST) imaging.
Purpose
Amongst various mouse models for pancreatic cancer, subcutaneous injected1 and orthotopic2 mouse models are the most commonly used animal models in pre clinical research. Recently, a genetically engineered mouse model (kpc mouse) has been developed that offers an alternative to transplantation models for preclinical therapeutic evaluation as it expresses mutations similar to human pancreatic cells3 and develop pancreatic tumors whose pathophysiology and molecular features resemble those of human PDAC.4The purpose of this study was to monitor tumor progression in mouse model of pancreatic cancer using multi-parametric MRI (mpMRI).Methods
KPC mice (n = 16) were imaged using 14T Bruker Avance 600 MHz/89 mm wide-bore vertical MR spectrometer (Bruker Corp., Billerica, MA). All mice were euthanized at this point and pancreas along with the tumor mass was extracted for further histological evaluation. T1 weighted images were acquired using rapid acquisition with refocused echoes were acquired using following parameters: TE = 9.66 ms, TR = 5500, 3000, 1500, 1000, 385.8 ms, NA = 1, spatial resolution of 0.117 x 0.234 mm/pixel. T2 weighted images were acquired using multiple spin-echo data in coronal orientation covering the area from liver to kidneys. The quantitative T2 maps were generated using a multi-slice multi echo sequence, with fat signal suppressed, utilizing following parameters: TR = 4000 ms; TE = 12 echoes equally spaced from 6.28 ms to 75.4 ms; NA = 1; spatial resolution of 0.117 x 0.234 mm/pixel. Diffusion weighted Images (DWI) were acquired using following parameters: TR/TE = 2500/17.7 ms; NA = 1; spatial resolution of 0.234 x 0.234 mm/pixel. Diffusion weighted images were acquired with 8 different b values (0, 30, 60, 100, 150, 200, 300, 500) s/mm2. Magnetization transfer ratio (MTR) images were acquired using a gradient echo sequence (TR/TE = 625/2 ms, flip angle =30o) with an off resonance frequency of 7000 Hz and a saturation pulse block pulse shape, 50 msec width, and 10 µT amplitude. A series of 10 images were acquired with FOV = 30 mm x 30 mm, matrix size = 256 x 256 yielding spatial resolution of 0.117 x 0.117 mm/pixel. Amide proton transfer (APT-MRI): Gradient echo images were acquired following a pre saturation pulse (continuous-wave block pulse, B1 = 0.5mT, duration = 2 s) which was applied at 25 frequency offsets from - 360 Hz to 360Hz with an interval of 0.5 ppm. For saturation, an off-resonance RF pulse was applied for 3s at a power level of 2mT, TR/TE = 5000/7 ms, matrix =128 x 128, FOV =30 mm x 30 mm, slice thickness = 1 mm, single slice). Finally, a control image with the saturation offset at 300 ppm was also acquired.Histology
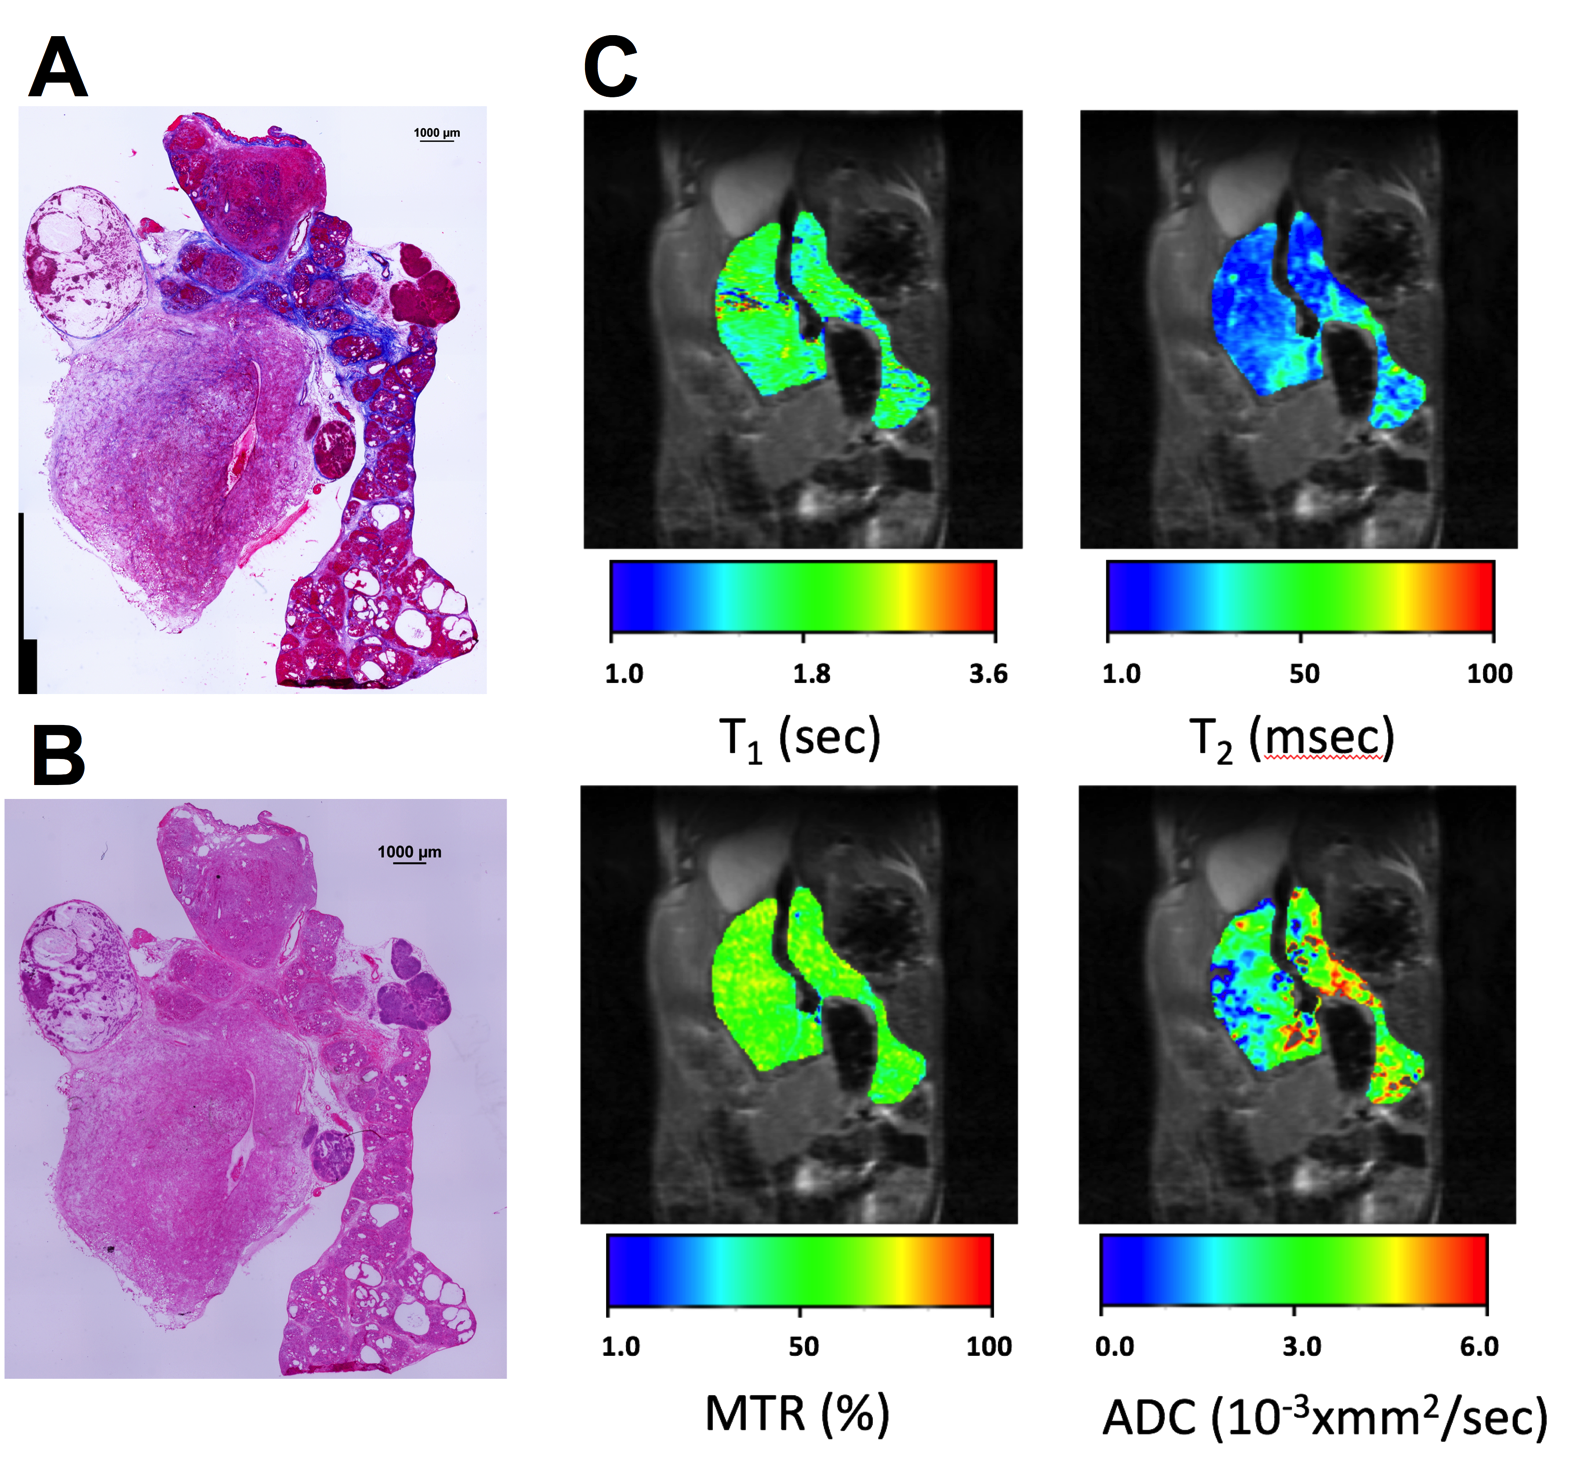
Mice were euthanized when the tumor size reached the size of 1 cm. Tissue was extracted and frozen for further histological analyses. Three serial, 8 μm thick sections were cut every 1mm through the entire tumor. Images of whole sections stained with Masson’s trichrome and H&E stains.Results
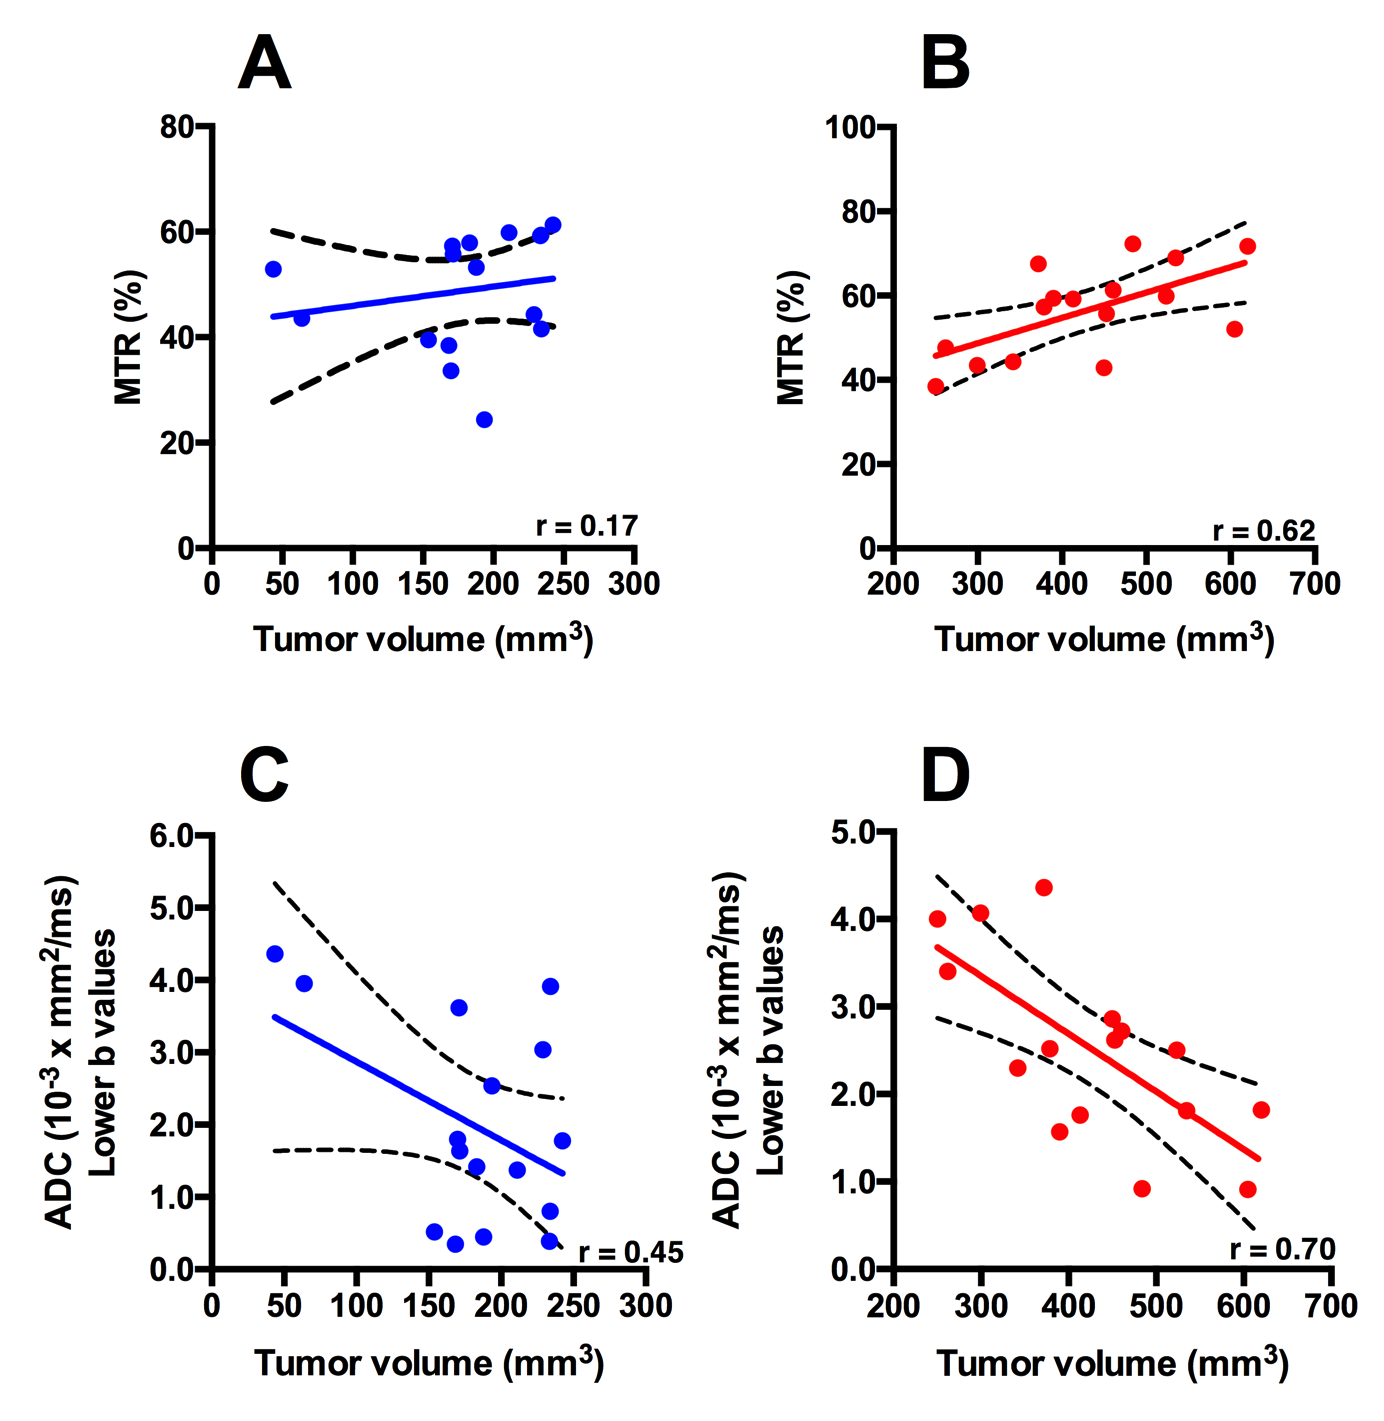
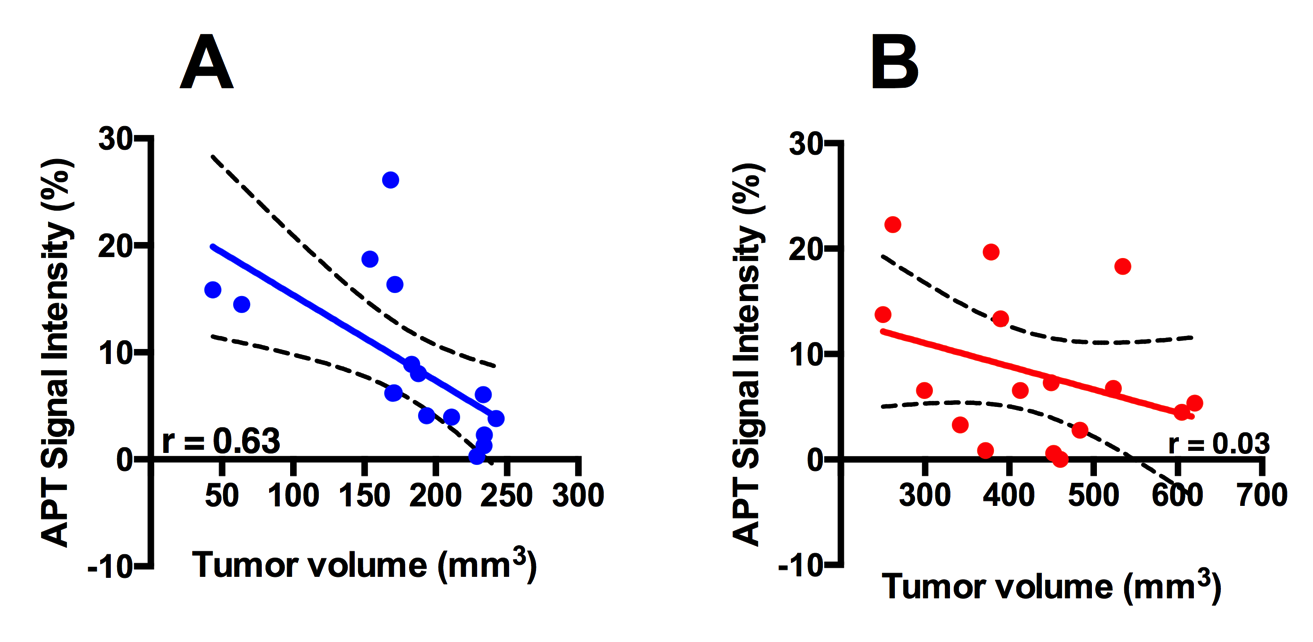
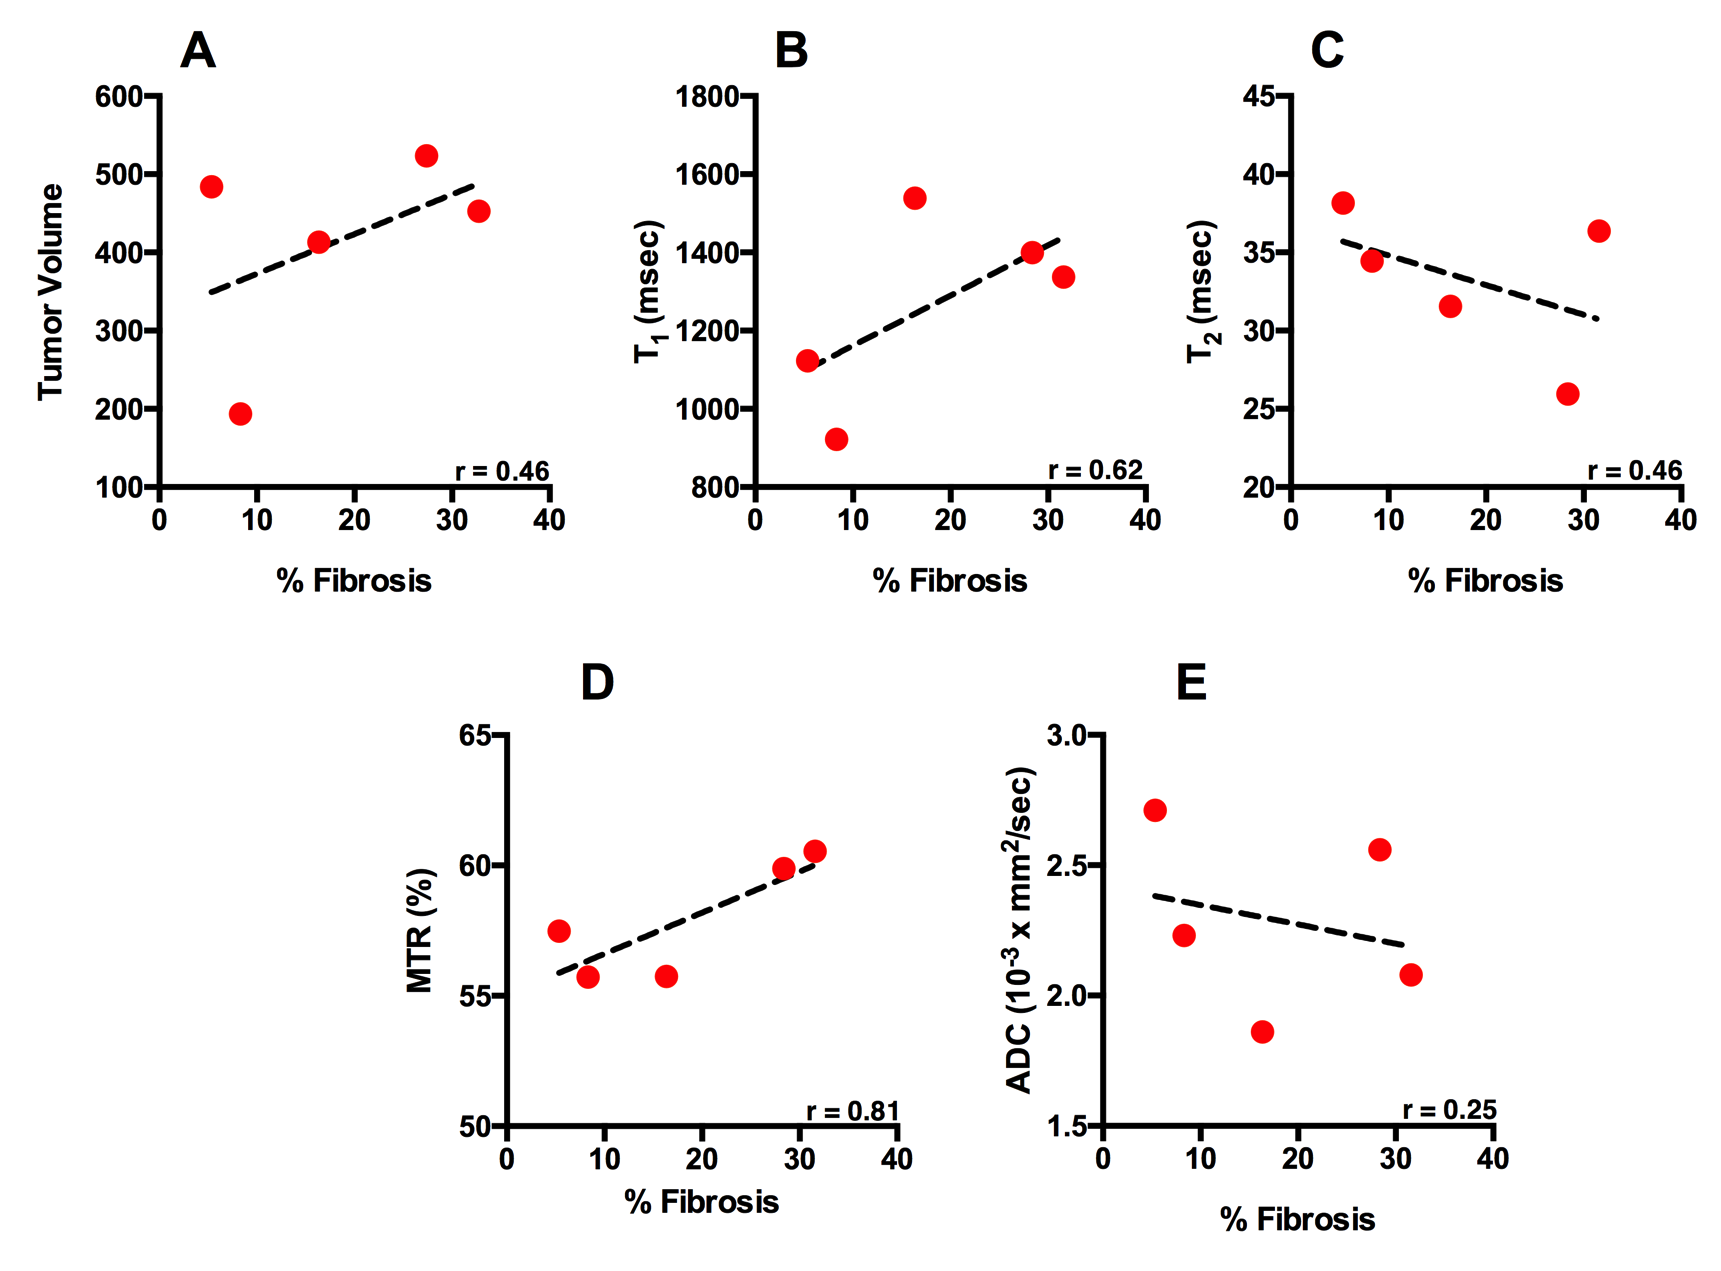
Mice in the smaller tumor size group i.e. smaller than 250 mm3 demonstrated moderate to weak positive correlation between tumor volume and T1 (r = 0.46), T2 (r = 0.33) (Figure 1). However, there was a strong correlation between tumor volume and APT signal intensity (r= 0.63) (Figure 2). Alternatively, in mice with the larger tumor size i.e. larger than 250 mm3, MTR showed strong positive correlation with the tumor volume (r = 0.68). Histological analysis: There was a strong positive correlation between MTR and fibrotic tissue accumulation (r = 0.81) (Figure 3).Discussion
T1 and T2 properties have been exploited both in vitro and in-vivo cancer studies.5,6 However, these measurements fall short to provide detailed information about the tumor microenvironment. Recent studies have demonstrated the diffusion effects can be found using diffusion imaging of pancreas.7 In this study we demonstrate that MTR and diffusion measures are more sensitive and provide indispensable information regarding the tumor microenvironment depending on the stage of the tumor development. Additionally, during the terminal stages of the tumor development, MTR was found to be more sensitive to fibrotic tissue accumulation.Acknowledgements
The work was funded by National Institute of Health (R01CA188654).References
1. Morton, C.L. and P.J. Houghton, Establishment of human tumor xenografts in immunodeficient mice. Nat Protoc, 2007. 2(2): p. 247-50.
2. Tseng, W.W., et al., Development of an orthotopic model of invasive pancreatic cancer in an immunocompetent murine host. Clin Cancer Res, 2010. 16(14): p. 3684-95.
3. Hingorani, S.R., et al., Trp53R172H and KrasG12D cooperate to promote chromosomal instability and widely metastatic pancreatic ductal adenocarcinoma in mice. Cancer Cell, 2005. 7(5): p. 469-83.
4. Hruban, R.H., et al., Pathology of genetically engineered mouse models of pancreatic exocrine cancer: consensus report and recommendations. Cancer Res, 2006. 66(1): p. 95-106.
5. Beall, P.T., C.F. Hazlewood, and P.N. Rao, Nuclear magnetic resonance patterns of intracellular water as a function of HeLa cell cycle. Science, 1976. 192(4242): p. 904-7.
6. Beall, P.T., et al., Distinction of normal, preneoplastic, and neoplastic mouse mammary primary cell cultures by water nuclear magnetic resonance relaxation times. J Natl Cancer Inst, 1980. 64(2): p. 335-8.
7. Lee, S.S., et al., Quantitative analysis of diffusion-weighted magnetic resonance imaging of the pancreas: usefulness in characterizing solid pancreatic masses. J Magn Reson Imaging, 2008. 28(4): p. 928-36.
Figures