2928
Unraveling osteosarcoma tumor heterogeneity using MRI-defined tumor habitats1Imaging and Metabolism, Moffitt Cancer Center, Tampa, FL, United States
Synopsis
We explore heterogeneity in osteosarcoma using imaging “habitats”, which identify different physiological subregions by MRI. We propose a method to establish the relationship between the microenvironmental of a habitat by relating histology to MRI. Computational image analysis was used to cluster tumor habitats with a 3D printing approach to co-register MR images with histology and immunohistochemistry. Compared with H&E and the CA-9, we found that cellular morphology and density were in concordance with the clustered habitats, although there are subtle differences between histology and MRI slices. Thus, identifying tumor habitats in osteosarcoma using multiparametric MRI is feasible and promising.
Introduction
Introduction: Osteosarcoma (OS) is the most common malignant pediatric bone tumor, with a poor 5-years survival rate following standard treatments. We hypothesize that this is due to phenotypic heterogeneity within tumors that can rapidly evolve chemoresistance. Multiple MR-derived parameter maps may be used to identify different physiological subregions within a tumor, or “habitats” that harbor different phenotypes. These regions have physico-chemical properties that provide forces that drive Darwinian selection for these different cellular phenotypes within the tumor. Hence, we hypothesize that these habitats may be used to quantitatively describe intra-tumoral heterogeneity and may be associated with clinical outcomes. However, determining the physical cellular basis of tumor habitats in vivo is a major challenge. We propose a method to establish 3D relation between histology sections and in vivo MRI. In this work, we focused on computational image analysis to cluster multiple MR-derived parameter maps and used a 3D printing approach to co-register MR images with histology and immunohisto- chemistry (IHC) in order to identify osteosarcoma habitats, and elucidate their cellular and functional characteristics.
Methods
Methods: All MRI experiments were done by using a BioSpec AV3HD 7-T horizontal magnet (Bruker Biospin, Inc.), with nested 205/120/HDS gradient insert and 310 mm bore, by using a 35-mm birdcage coil (Doty Scientific). Eight mice were surgically implanted patient derived osteosarcoma (PDX) and were imaged. Reference images (axial T2-weighted), T2 (multiple spin echo) and T2* (multiple gradient echo) sequences were acquired (TR/TE = 2000/48 ms, FOV=32x32mm,gap=1mm) with slice thickness of 1 mm. Diffusion weighted (DW) images were also acquired using three b-values = 100, 500, 750 s/mm2. Dynamic contrast enhanced (DCE) images were acquired with multiple repetitions of T1-weighting (TR = 150 ms, TE = 7.2 ms) upon injection of 0.2 mmol/kg Gd-DTPA over 35 minutes. The tumors were manually segmented using T2 images, and exported as a 3D surface. SolidWorks (SolidWorks Corp.) used to create a mold with integrated slots that are co-planar with MR image slices. Habitat images were derived by from multiple MRI-based parameter maps using a Gaussian mixture model fit with an expectation maximization algorithm in MATLAB (Mathworks, Inc.). Using 4 clusters, the fit was performed on all pixels within mulple slices but relegated to within the tumor volume of interest, whereas a single slice is depicted (Fig 2a-b). Histological and IHC slices were compared with the MR habitat images to identify microscopic differences in cellular morphology and density that could explain the observations.Results & Discussion
Results & Discussion: Tumor heterogeneity was clearly visible in the habitat images (Figure1), with multiple habitats distributed across the image. The red cluster indicates the lowest diffusion and lowest perfusion/permeability, which could be necrosis. The green habitats also described the low diffusion and low perfusion/permeability, which may represent hypoxia. To some extent, we found that two clusters were in agreement with IHC staining of CA-9 (Figure 2d). The third habitat (blue) with high perfusion and low diffusion could be the presence of viable cell population, but with some degree of hypoxia. We interpreted the highest perfusion region (magenta) to indicate viable tumor that is highly vascularized. These results are also in concordance with the H&E stain(Figure 2c).Despite the experimental design, which is meant to optimize co-registration, there are subtle differences between histology and MRI slices. We note a slight orientational change and slight deformations in MRI to histology/IHC frames, while preparing histology slices.Conclusion
Conclusion: Feasibility was demonstrated in identifying tumor habitats in osteosarcoma using multiparametric MRI and histology and IHC. Advanced co-registration between histology and the MRI slices is promising. Improvements in image co-registration will be required to investigate habitats at higher resolutions. The spatial heterogeneity of tumor, and rationalization of the underlying physiological characteristics of these habitats may be a promising clinical prognostic tool to assess therapeutic response.Acknowledgements
This work has been supported in part by the SAIL Core Facility at the H. Lee Moffitt Cancer Center & Research Institute,an NCI designated Comprehensive Cancer Center (P30-CA076292), and been funded by NIH/NCI Cancer Center Support Grant, Imaging Habitats in Sarcoma (1R01CA187532-01A1).References
1. Zhou M, Chaudhury B, Hall LO, Goldgof DB, Gillies RJ, Gatenby RA. [J] Magn Reson Imaging. 2016 Sep 28. doi: 10.1002/jmri.25497.
2.Farhidzadeh, H, Chaudhury, B, Zhou, M, Goldgof, D. B, Hall, L. O, Gatenby, R. A, Gillies, R. J,and Raghavan, M. [J] SPIE Medical Imaging, 94141U (March 20, 2015); doi:10.1117/12.2082324.
Figures
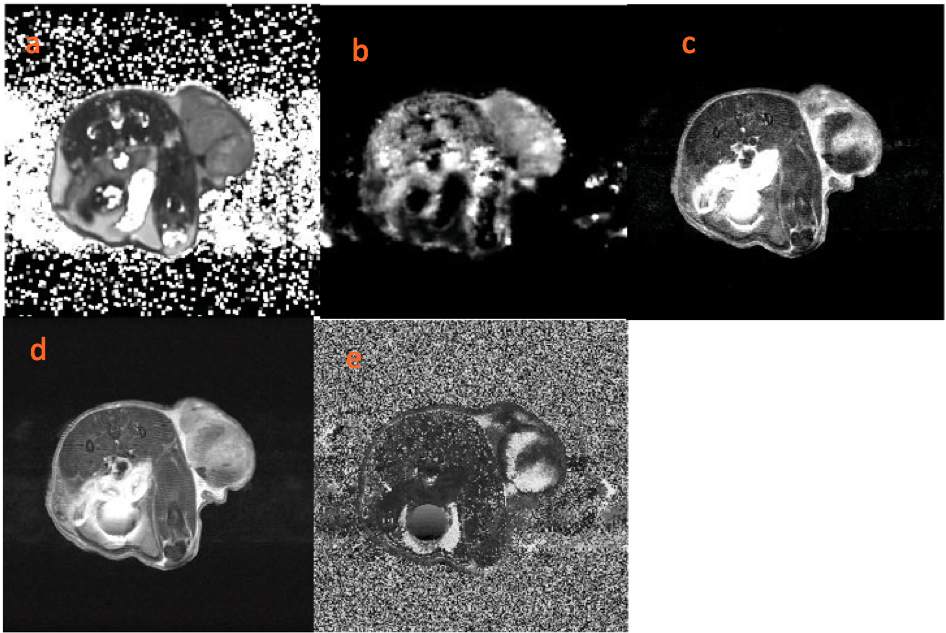
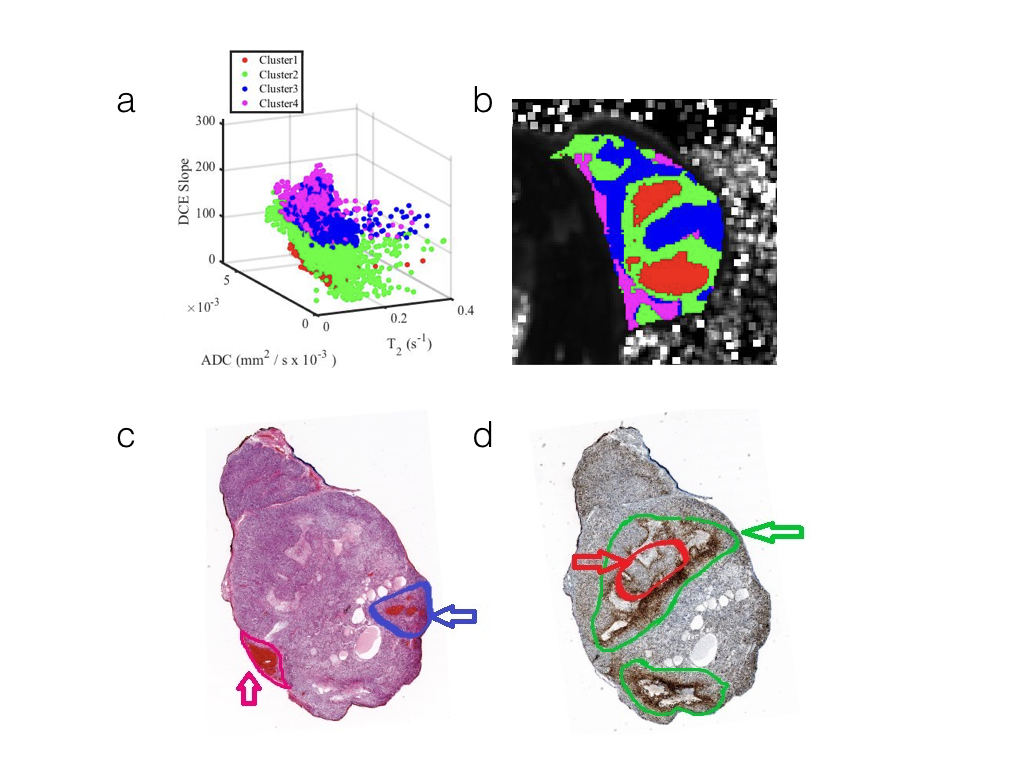
Figure 2: Corresponding the clustering habitats and histological slice.a: Tumor pixel clustering with colors corresponding to habitat regions, b: habitats regions overlaid on the tumor, c:H&E stain, d:CA-9 stain.
Red-necrosis, Green-hypoxia, Blue-viable cell, Magenta-vascular.