2927
Combined DCE-MRI and immunohistochemical analyses of cervical cancer xenografts reveal differences in the physiological background of prognostic image parameters derived from the Tofts and Brix model1Department of Core Facilities, Oslo University Hospital, Oslo, Norway, 2Department of Radiation Biology, Oslo University Hospital, Oslo, Norway
Synopsis
The Tofts and Brix parameters Ktrans and ABrix , derived from dynamic contrast-enhanced MRI (DCE-MRI), have been suggested as potential markers of hypoxia. This phenotype is associated with poor outcome in cervical cancer treated with chemoradiotherapy. In this study, DCE-MRI was combined with immunohistochemical analysis of cervical cancer xenografts, to better understand the physiological background and prognostic potential of the parameters. Through correlations with hypoxic fraction, vascular and cellular densities, derived from pimonidazole, CD31 and hematoxylin staining of tumor sections, respectively, it was shown that ABrix could be the preferred DCE-MRI parameter for predicting hypoxia related treatment resistance in cervical cancer.
Target Audience
Radiologists, oncologist and basic researchers within the field of cancer research and radiation response prediction.Purpose
Hypoxia has, through measurements with pO2 electrodes, been associated with aggressive tumors and poor outcome of chemoradiotherapy in cervical cancer. Dynamic contrast-enhanced MRI (DCE-MRI) has been suggested as a non-invasive method for assessing hypoxia in tumors. Several models describing the uptake of contrast agent exist, among these are the commonly used Tofts and Brix models. Two parameters with a large clinical potential are the Ktrans and the A parameter, ABrix, from the Tofts and Brix model, respectively, which have both shown relationships to treatment outcome in cervical cancer. ABrix has been associated with hypoxia, as measured by the expression of hypoxia responsive genes 1, but the underlying physiological factors behind neither of the parameters are fully understood. In this study, DCE-MRI of cervical cancer xenografts was combined with immunohistochemical analysis in order to better understand the physiological background of the Ktrans and ABrix parameters, and thus their prognostic potential.Method
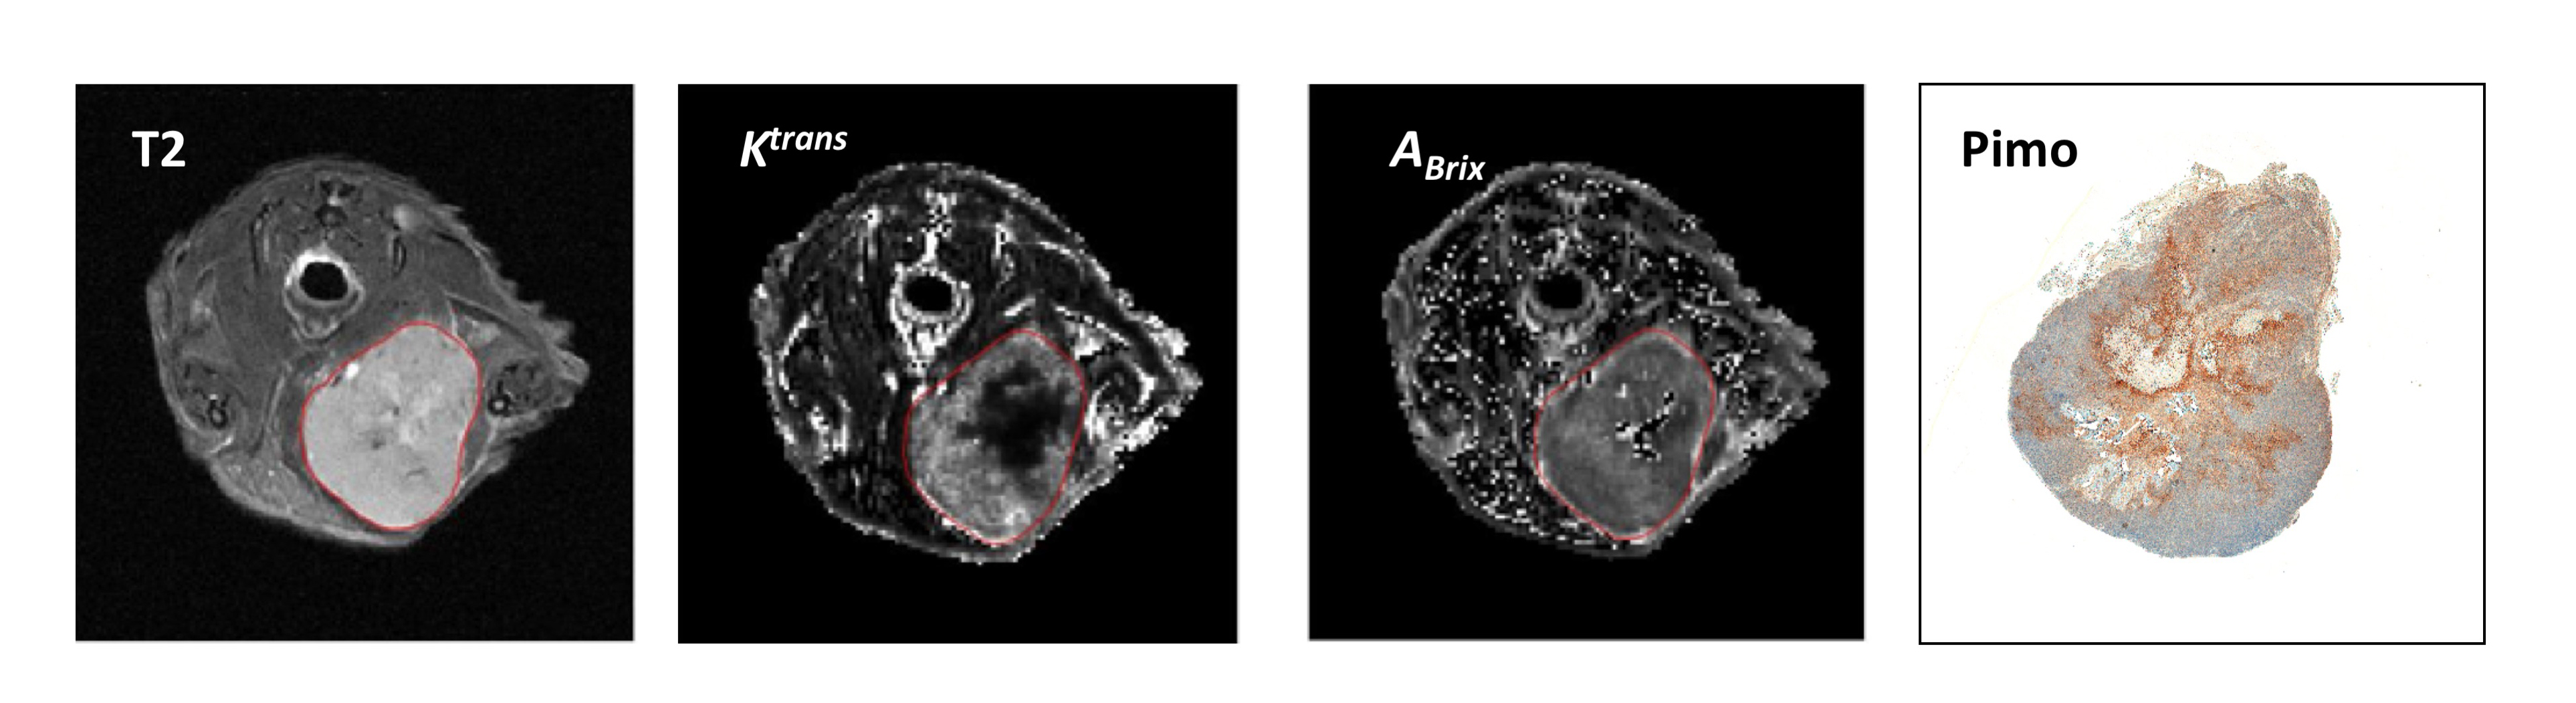
Totally 29 adult female BALB/c-nu/nu mice were used as host animals for 17 HeLa and 12 SiHa cervical cancer xenografts. The tumors were imaged using DCE-MRI, acquired with a 3D FLASH sequence (7.05 T, slice thickness 0.8 mm, in-plane resolution 0.23 x 0.23 mm, TE/TR=2.17/10.2 ms) with a temporal resolution of 14.6 s and a total scan time of ~15.5 min. Gd-DOTA was used as the contrast agent. The imaging protocol also included pre-contrast high-resolution T2-weighted images, used for defining the tumor region, and T1-mapping (TE=8.5 ms, TR=5000, 3000, 1500, 800, 400 and 347.39 ms), used for calculating the concentration of contrast agent in the tumor. Both the Tofts and Brix model were used in analysis of the DCE series. For the Tofts model a population based arterial input function was applied, as described by Benjaminsen et al 2. Ktrans and ABrix were calculated for each voxel and presented in parametric maps (Figure 1). Immediately after imaging, the tumors were excised and fixed in formalin. Immunohistochemistry was performed with pimonidazole as marker for tumor hypoxia (Figure 1), while CD31 and hematoxylin were used for measurement of vascular- and cell density, respectively. The histological sections were imaged in a microscope and analysed with the MatLab software.Results
ABrix showed a strong negative correlation with hypoxic fraction (P<0.001), as determined by the area fraction of tumor tissue staining positive for pimonidazole, whereas Ktrans showed a weaker, but significant (P<0.01) negative correlation. Ktrans correlated strongly with vascular density (P<0.0001), but showed no correlation to cell density. A weak, but significant, correlation with vascular density was also found for ABrix (P<0.05), but in contrast to Ktrans, this parameter showed a much stronger negative correlation with cell density (P<0.01). Examination of the histological sections revealed a weak, but significant negative correlation between hypoxia and vascular density, while there was a strong correlation between hypoxia and cell density (P<0.05 and P<0.001, respectively).Discussion & Conclusion
Hypoxic conditions arise when oxygen supply does not meet the oxygen demand of the cells. This can be a result of both high oxygen consumption, and low oxygen supply. The strong correlation between cell density and pimonidazole staining in our work indicates that cell density, and thus a high level of oxygen consumption, was a major cause of hypoxia in the xenografts. This may explain why Ktrans, which was correlated with vascular density and not with cell density, displayed a weak correlation with hypoxia. Moreover, ABrix, which showed a strong association with cell density in addition to a weaker correlation with vascular density, displayed a strong correlation with hypoxia. These results imply that hypoxia may be the most prominent underlying physiological factor of ABrix, whereas Ktrans probably merely reflects the vascular density of cervical tumors. In accordance with this hypothesis, ABrix would be the preferred DCE-MRI parameter for predicting hypoxia related treatment resistance in cervical cancer.Acknowledgements
No acknowledgement found.References
1. Halle, C. et al. Hypoxia-Induced Gene Expression in Chemoradioresistant Cervical Cancer Revealed by Dynamic Contrast-Enhanced MRI. Cancer Research. 2012;72:1-11.
2. Benjaminsen I. C. et al. Assessment of Tumor Blood Perfusion by High-Resolution Dynamic Contrast-Enhanced MRI: A Preclinical Study of Human Melanoma Xenografts. Magnetic Resonance in Medicine. 2004;52:269-276.
Figures