2926
In vivo follow-up of colorectal cancer on mice model using endoluminal MRI1Univ Lyon, INSA‐Lyon, Université Lyon 1, UJM-Saint Etienne, CNRS, Inserm, CREATIS UMR 5220, U1206, Lyon, France, 2Institut de Génomique Fonctionnelle de Lyon, Université de Lyon 1, UMR 5242 CNRS, Ecole Normale Supérieure de Lyon, Lyon, France, 3LTSI; INSERM U642; Université Rennes 1, Rennes, France, 4Hôpital Régional Universitaire de Tours - Service hépato-gastroentérologie, Tours, France
Synopsis
For 6 months, 32 mice, chemically treated to induce colorectal cancer, were followed with endoluminal MRI using dedicated endorectal coils. Based on high spatial resolution T1-weigthed images and T1-maps, quantified parameters (colon wall thickness and T1 relaxation time) were measured at each stage of the pathology from healthy tissues to cancer through inflammation. The colon wall thickness was found to be reliable in assessing early stages of the pathology (inflammation from infiltration), where the intrinsic contrast T1 time parameter was reliable for discerning infiltration from tumors. The two biomarkers provide complementary information in the characterization and staging of colorectal cancer.
PURPOSE
Colorectal cancer (CRC) is a slow-growing cancer (15 to 20 years to disseminate in the organism) characterized by the simplified sequence inflammation – infiltration – tumors1. The first stages of CRC are asymptomatic that’s why patients are generally diagnosed at late stages. As the prognosis of CRC is highly linked to the diagnosis stage, CRC is one of the deadliest cancers2. In this context, new ways of imaging early cancers are mandatory. In this preclinical study, we demonstrated that quantified MRI parameters (colon wall thickness and T1 relaxation time) using a dedicated endoluminal coil helps to characterize each stage of the pathology from inflammation to cancer.METHODS
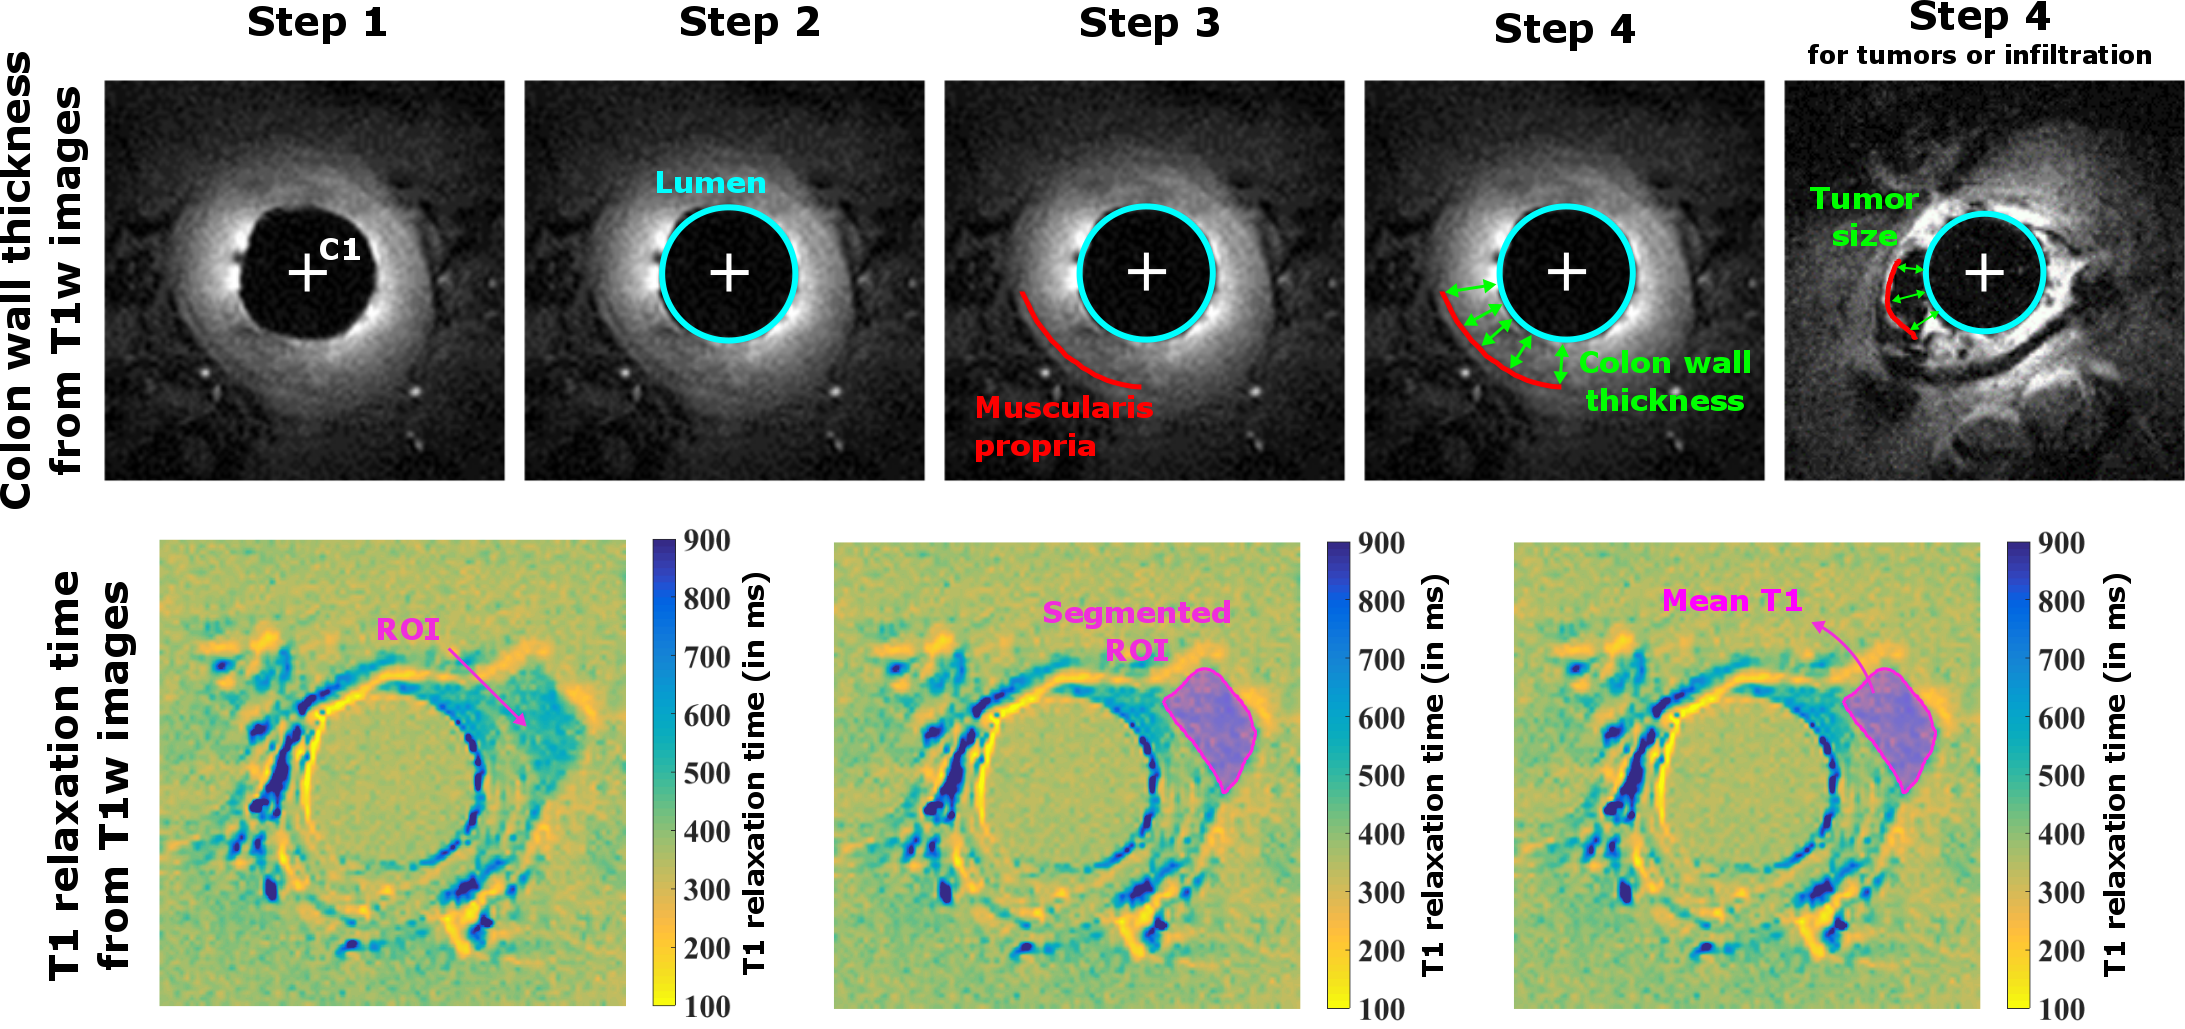
Experiments were carried out on a mouse model of colitis including 20 mice (SWISS) chemically treated3 and 12 healthy animals. After the chemical injection, mice were imaged every six weeks for a six-month period (leading to 4 characteristic stages of the pathology, labeled S1 to S4). Each abnormality observed on MR images was also imaged with conventional endoscopy as gold standard. Dedicated receive-only endorectal coils (ERC) have been developed for the mouse anatomy to operate on a 4.7T Bruker system4. Three FLASH 3D axial T1-weighted images with various flip angles (15°, 20° and 25°) were acquired (FOV 16x16x15mm3, matrix 192x192, voxel 83x83x234µm3, TR/TE = 20/6.65ms, 25kHz receive bandwidth and acquisition time 8’11’’), are acquired. T1-maps were obtained with the three sets of images5. Based on anatomical images (15° flip angle), the colon wall (CW) thickness was measured by a radiologist with a dedicated algorithm from the lumen border to the muscularis propria (see figure 1) for each stage (healthy, early inflammation, inflammation, infiltration and tumors). From T1-maps, the T1 relaxation time was also measured in these regions of interest. An ANOVA statistical test was performed using thickness and T1-value measures through time for healthy and treated animals.RESULTS
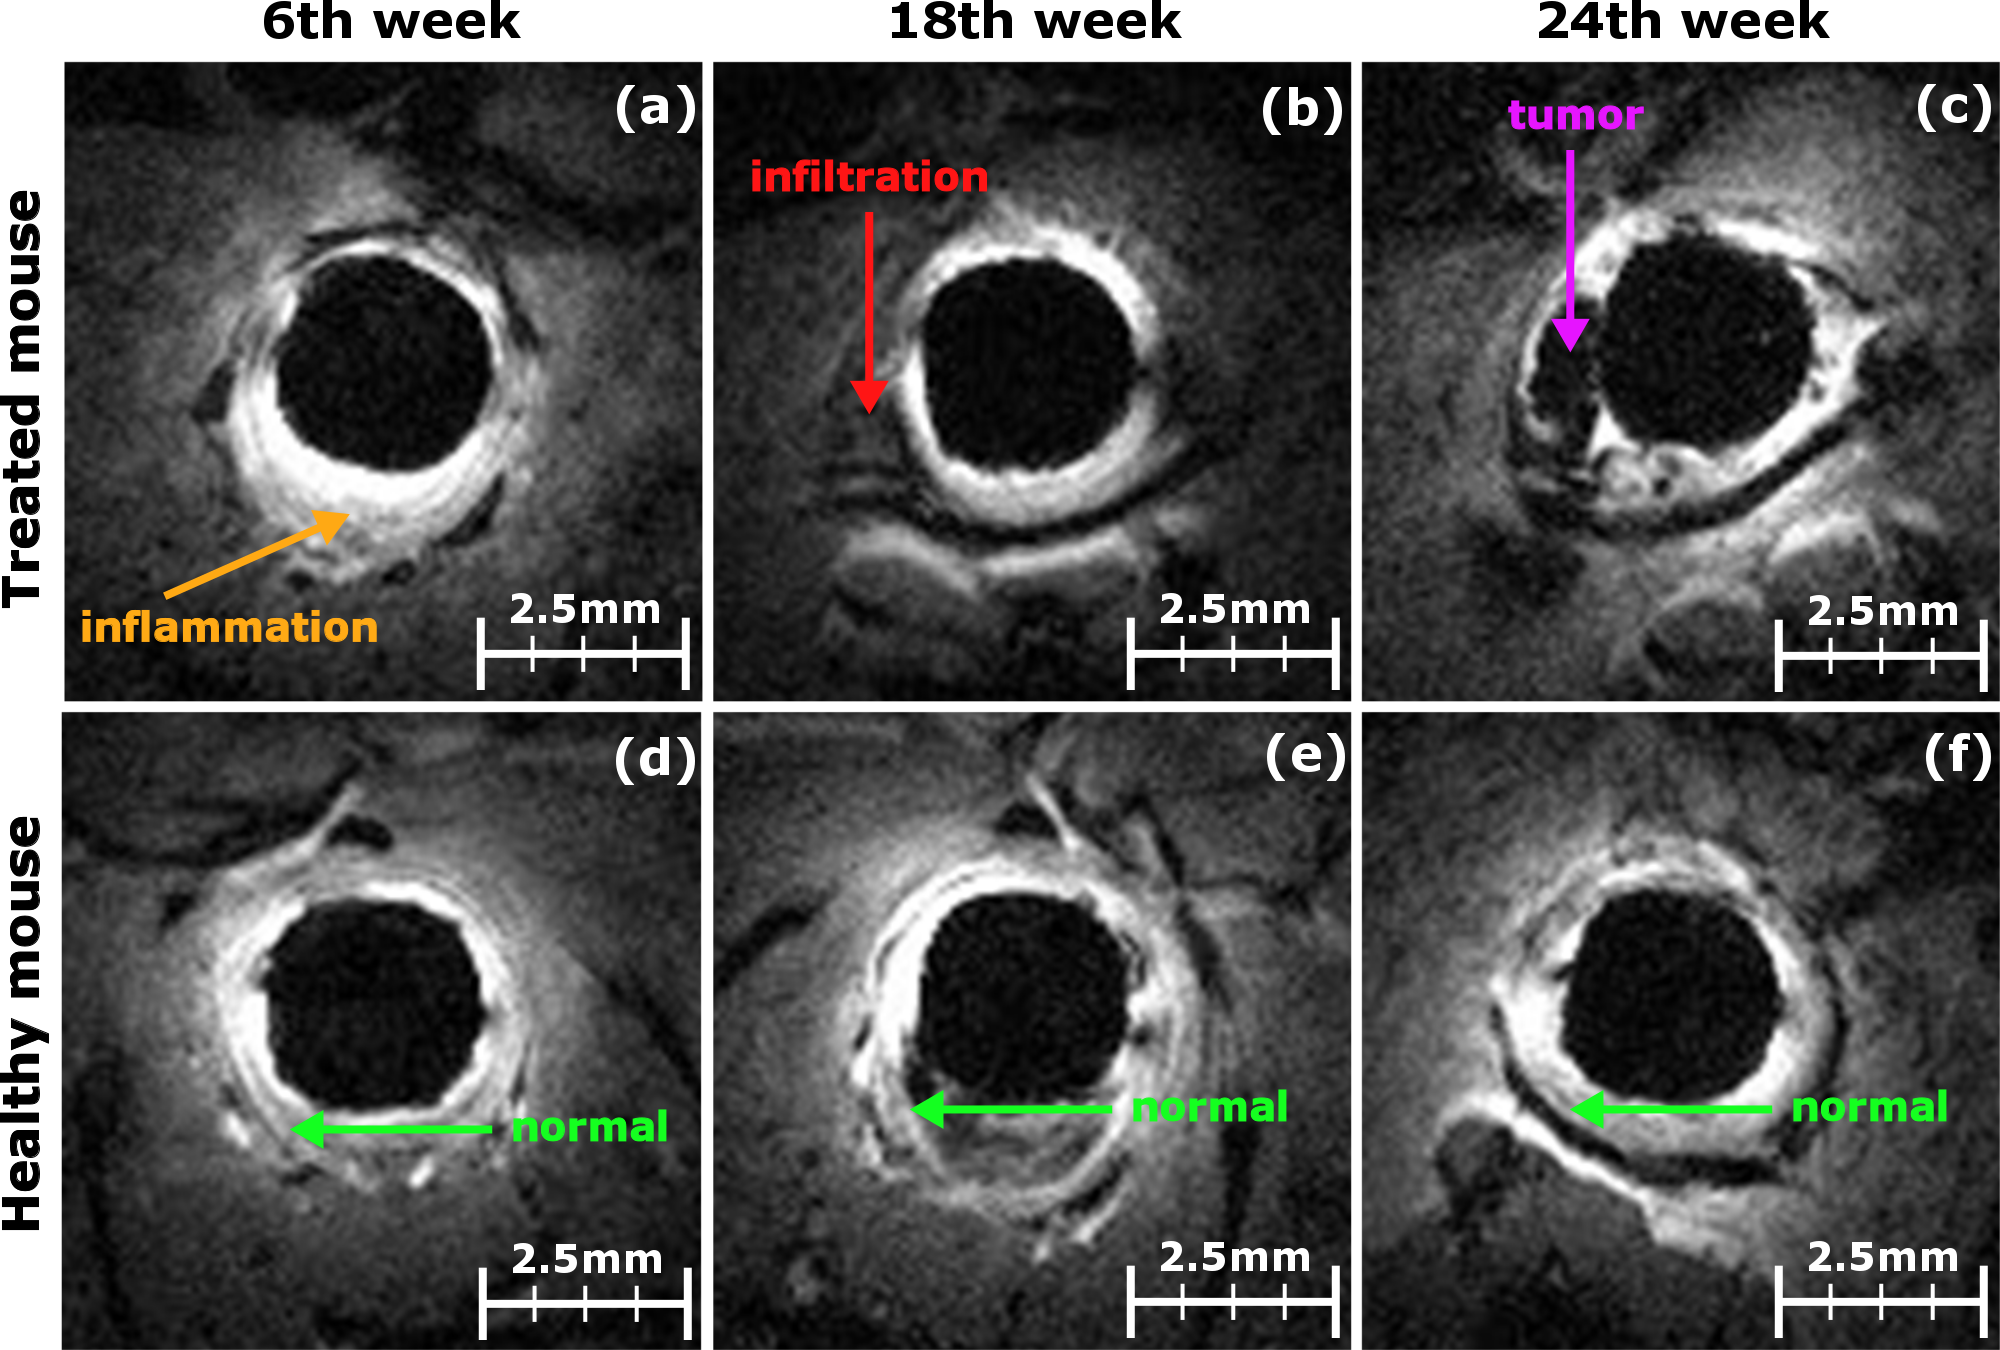
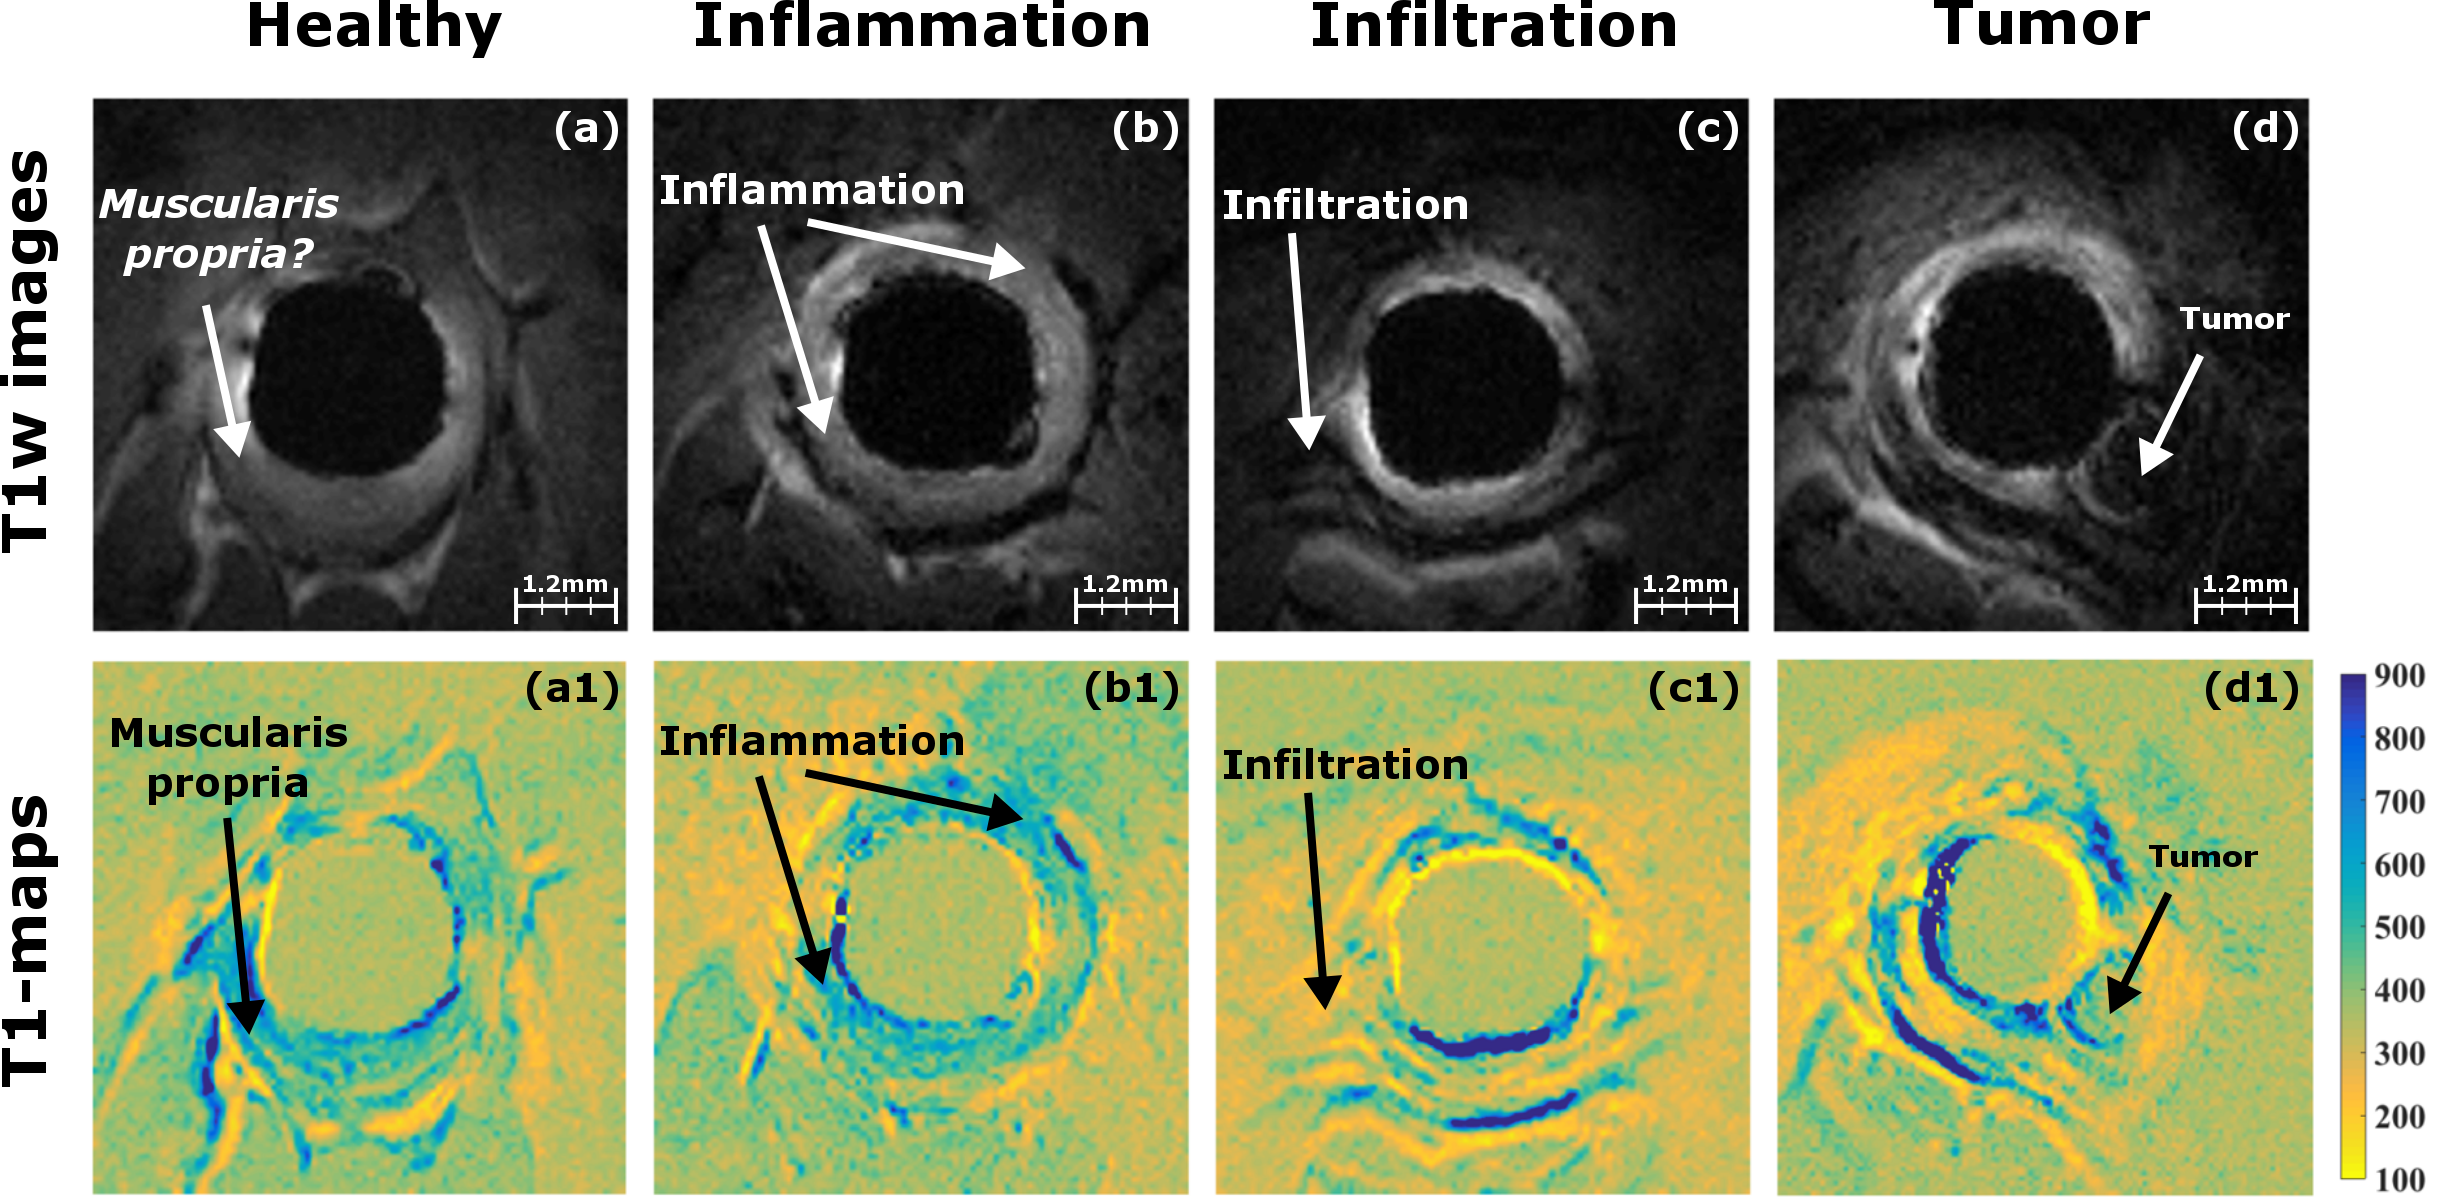
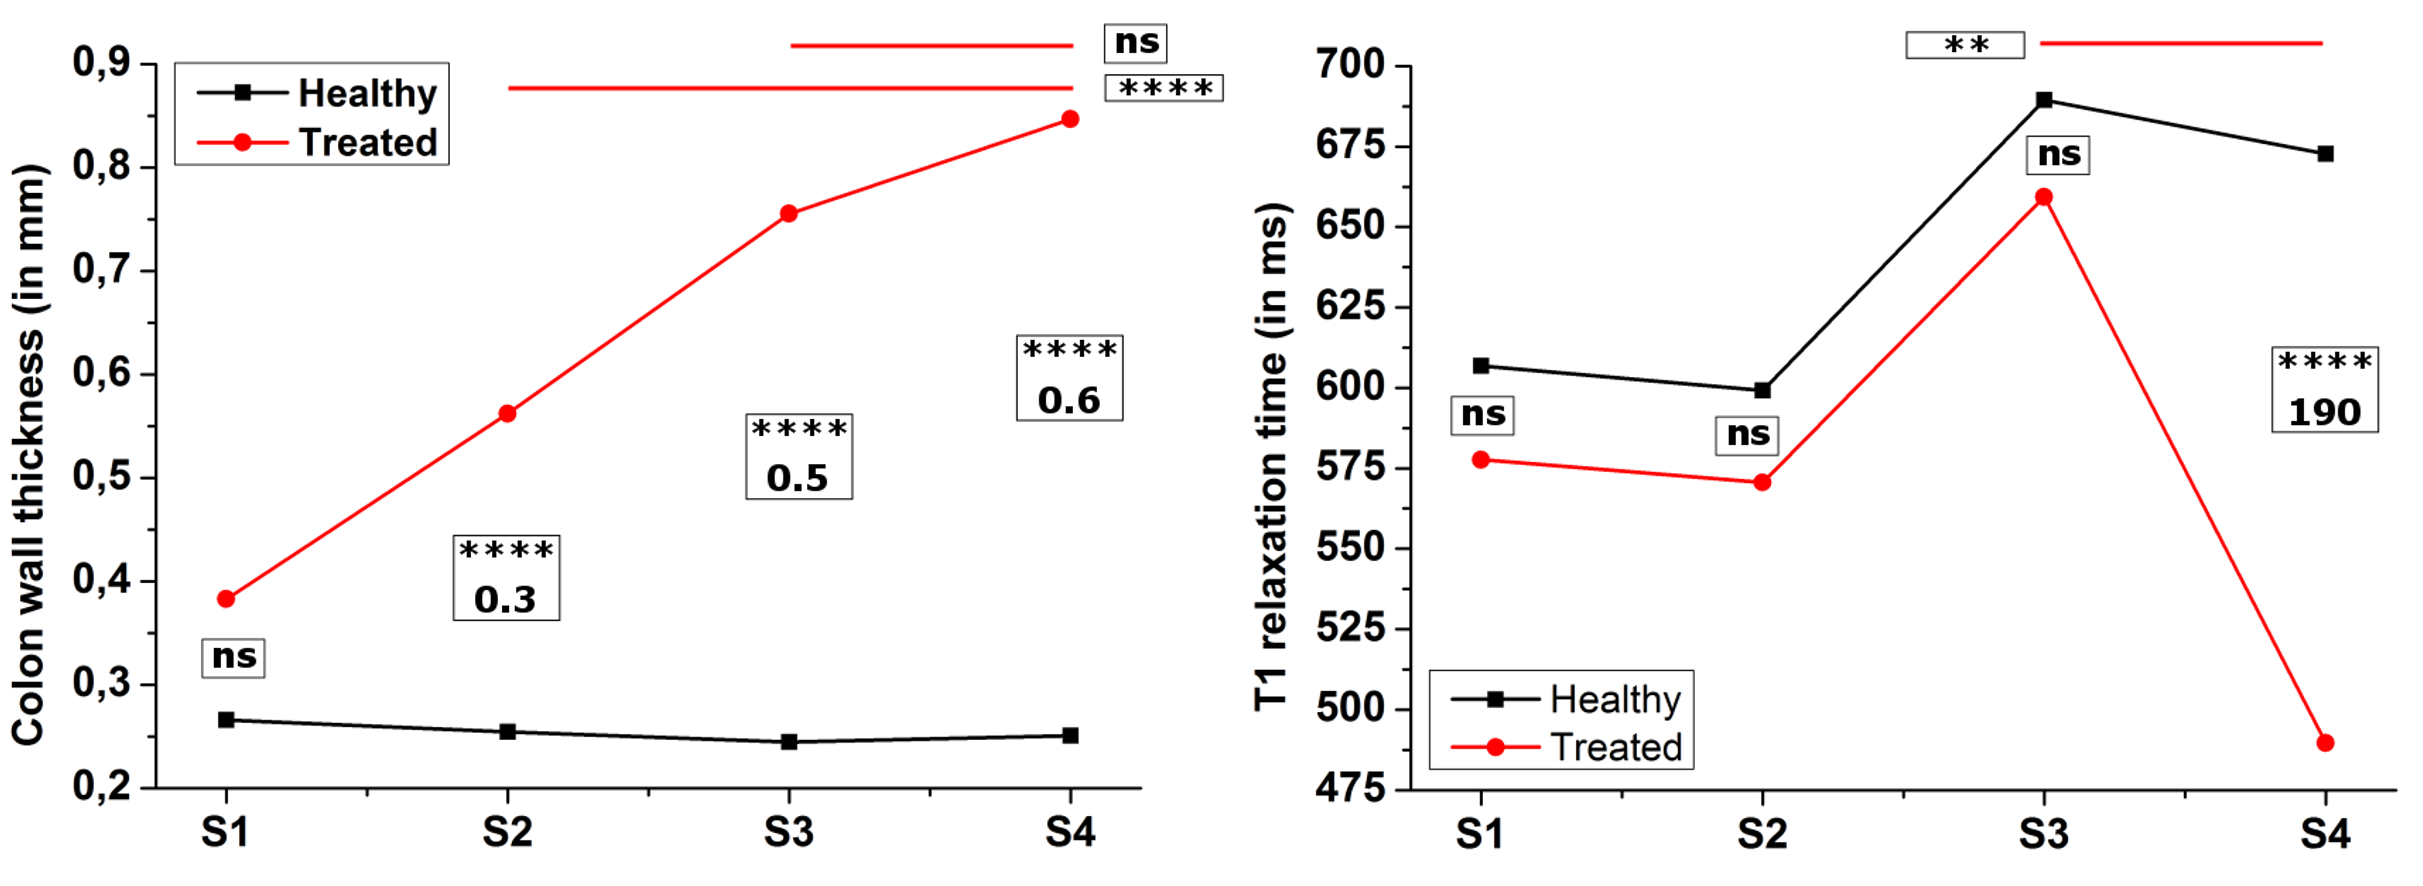
High spatial resolution T1w images (see figure 2) and T1-maps (see figure 3) have been acquired, using ERC. This spatial resolution was required to precisely evaluate the thickening of the CW complex. On T1w images, inflammation (S2) is characterized by a uniform thickening around the ERC appearing in hypersignal (see figure 2a) where infiltration (S3) and tumors (S4) appear as localized hyposignal areas (see figure 2b and c). During the study, 11 animals depicted early inflammation patterns at S1, 13 inflammation patterns were observed at S2, 11 animals were imaged with infiltration lesions at S3, and, finally, 9 animals presented tumors including 7 polypoid-type tumors. T1-maps help to depict CW layers (see comparison between figure 3a and 3a1), but also enhance the contrast between the different structures surrounding the ERC (see figure 3c1 and 3d1). From the statistical test on CW thickening (figure 4, graphic on the left), significant differences (p<0,001) are observed between healthy and treated animals for inflammation, infiltration and tumors stages, and no significant differences are noticed between infiltration and tumors on treated animals. However, regarding the T1 relaxation time (figure 4, right), infiltration and tumors can be significantly separated.DISCUSSION
High spatial resolution images are mandatory to precisely measure the CW thickness. With an in-plane pixel size of 83x83µm², it is possible to depict colorectal abnormalities of mice and follow the evolution from early inflammation to tumors. The CW thickness, based on anatomical features, appears as a reliable biomarker for inflammation and infiltration, compared to healthy animals, but not for differentiating infiltration from tumors. Infiltration patterns display the same apparent thickness as in case of tumors. Indeed, infiltration is locally evolving inside the CW where tumors, observed in this model, are essentially growing from these infiltrating lesions. T1-values measured in tumor regions are significantly smaller than T1-values in other tissues, possibly due to the weaker metabolism and necrosis in the former. This parameter seems a valuable discriminating criterion to complete morphological diagnosis based on thickness CW measurement.CONCLUSION
Endoluminal MRI associated with quantified morphological and intrinsic contrast T1 relaxation time parameters was able to characterize and stage CRC lesions by depicting inflammation and differentiating infiltration from tumors.Acknowledgements
This work was supported by the LABEX PRIMES (ANR-11-LABX-0063) of Université de Lyon, within the program "Investissements d'Avenir" (ANR-11-IDEX-0007) operated by the French National Research Agency (ANR). This work was performed on the platform PILoT, member of France Life Imaging network (grant ANR-11-INBS-0006).References
1.Takayama, T., Miyanishi, K., Hayashi, T., Sato, Y. & Niitsu, Y. Colorectal cancer: genetics of development and metastasis. J. Gastroenterol. 41, 185–192 (2006).
2. Siegel, R., DeSantis, C. & Jemal, A. Colorectal cancer statistics, 2014. CA. Cancer J. Clin. 64, 104–117 (2014).
3.Tanaka, T. et al. A novel inflammation-related mouse colon carcinogenesis model induced by azoxymethane and dextran sodium sulfate. Cancer Sci. 94, 965–973 (2003).
4. Dorez, H. et al. Endoluminal high-resolution MR imaging protocol for colon walls analysis in a mouse model of colitis. Magn. Reson. Mater. Phys. Biol. Med. 1–13 (2016). doi:10.1007/s10334-016-0539-2
5. Cheng, H.-L. M. & Wright, G. A. Rapid high-resolution T1 mapping by variable flip angles: Accurate and precise measurements in the presence of radiofrequency field inhomogeneity. Magn. Reson. Med. 55, 566–574 (2006).
Figures