2925
Tumor Progression Monitoring with Hyperpolarized 13C Exchange Spectroscopy in Transgenic Adenocarcinoma of Mouse Prostate Treated with Androgen Deprivation Therapy1Department of Radiology and Biomedical Imaging, UCSF, San Francisco, CA, United States, 2UC Berkeley-UCSF Graduate Program in Bioengineering, UC Berkeley and UCSF, San Francisco, CA, United States
Synopsis
Hyperpolarized 13C MR imaging provides valuable enzyme-kinetic information for investigating disease metabolism. In this work, a new exchange spectroscopic imaging method was applied to a preclinical cancer treatment study and the metabolic information provided by this new method agreed with and proved additional quantitative kinetic metrics over traditional Response Evaluation Criteria in Solid Tumors (RECIST) measures.
Purpose
With the recent invention of metabolic activity decomposition acquisition method1, evaluating accurate in vivo tumor metabolic conversion rate based on phase-sensitive detection becomes feasible. The goal of this work was to apply this new exchange spectroscopic imaging method and its metabolic modeling framework to a therapy scenario of treating a preclinical tumor model.Methods
Animal and Treatment Management
A total of six Transgenic Adenocarcinoma of Mouse Prostate (TRAMP) mice, 2 with earlier stage androgen sensitive disease and 4 with advanced androgen insensitive tumors were serially studied before and after primary androgen deprivation therapy (orchiectomy) and a new potent androgen pathway inhibitor, apalutamide. Apalutamide was mixed with DMSO to form a fresh suspension and was delivered daily by oral gavage. Baseline and follow-up imaging sessions were separated by 7 days. Prior to the imaging sessions, anesthesia was induced with 3% isoflurane, and tail vein catheters were inserted to allow intravenous injection of the hyperpolarized solution. During the MR imaging, the mice were placed on a heating pad and were kept under anesthesia with 1-2% isoflurane.
Hyperpolarization
HyperSense DNP polarizer (Oxford Instruments, Abingdon, UK) operating at 3.35 T and 1.35 K was used to polarize 13C-labeled substrates. Neat [1-13C]pyruvic acid (Sigma Aldrich, St. Louis, MO, USA) mixed with 15mM OX063 trityl radical (GE Healthcare, Waukesha, WI) and 1.5mM Gd-DOTA (Guerbet, Roissy, France) was simultaneously polarized with 13C-urea mixed with the trityl radical OX063 for approximately an hour. The hyperpolarized samples were neutralized with NaOH/TRIS buffer to a physiologically acceptable pH range. 350uL of this solution was injected into the animal intravenously over 12 seconds.
Acquisition
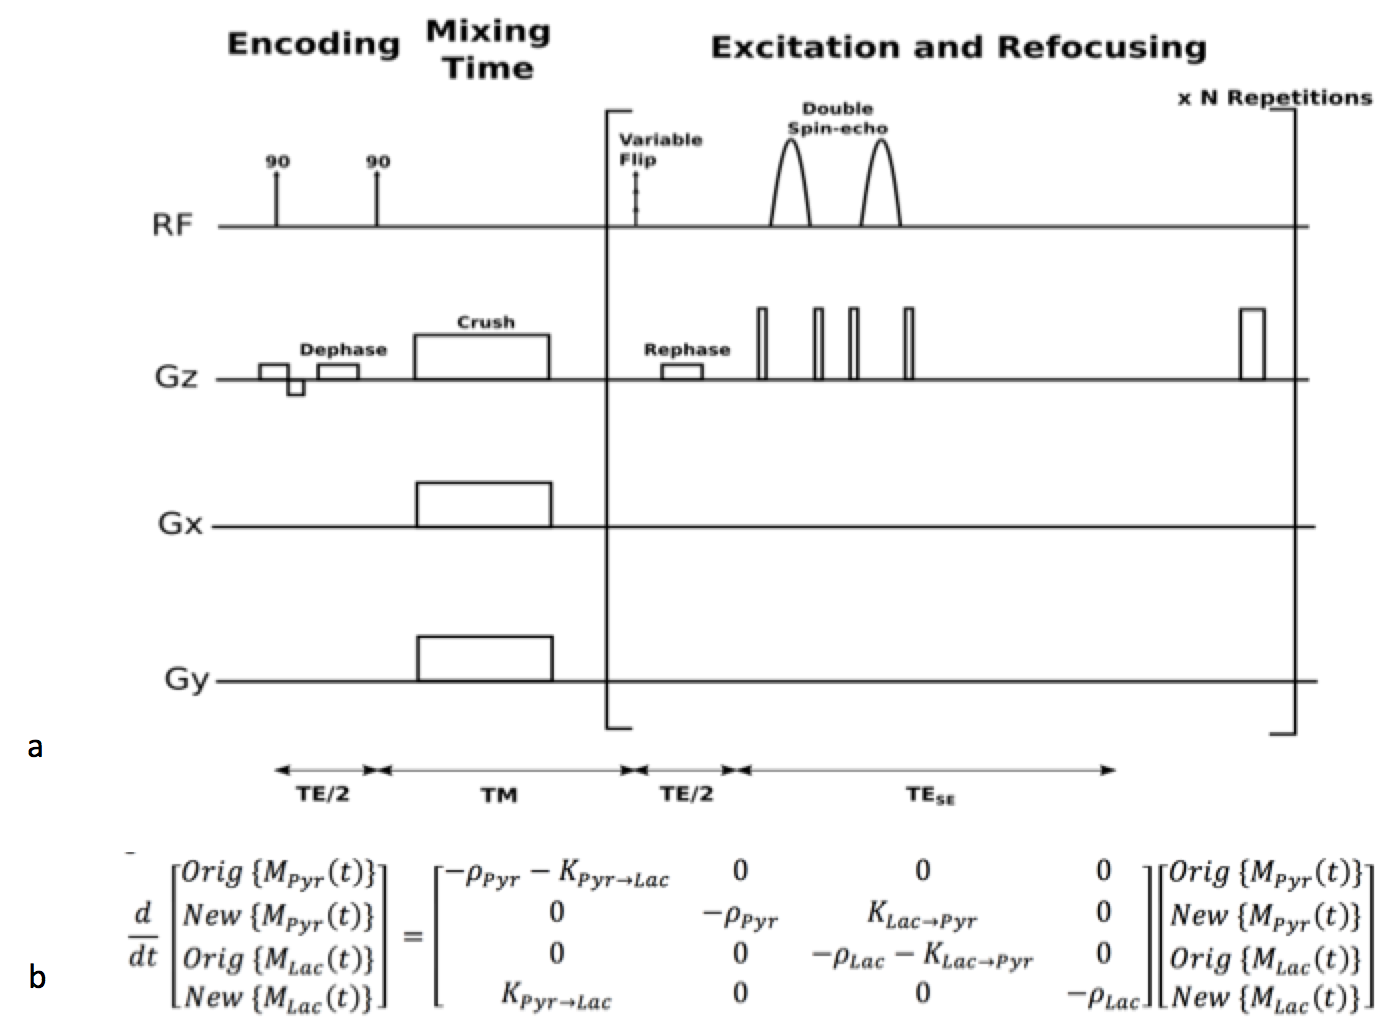
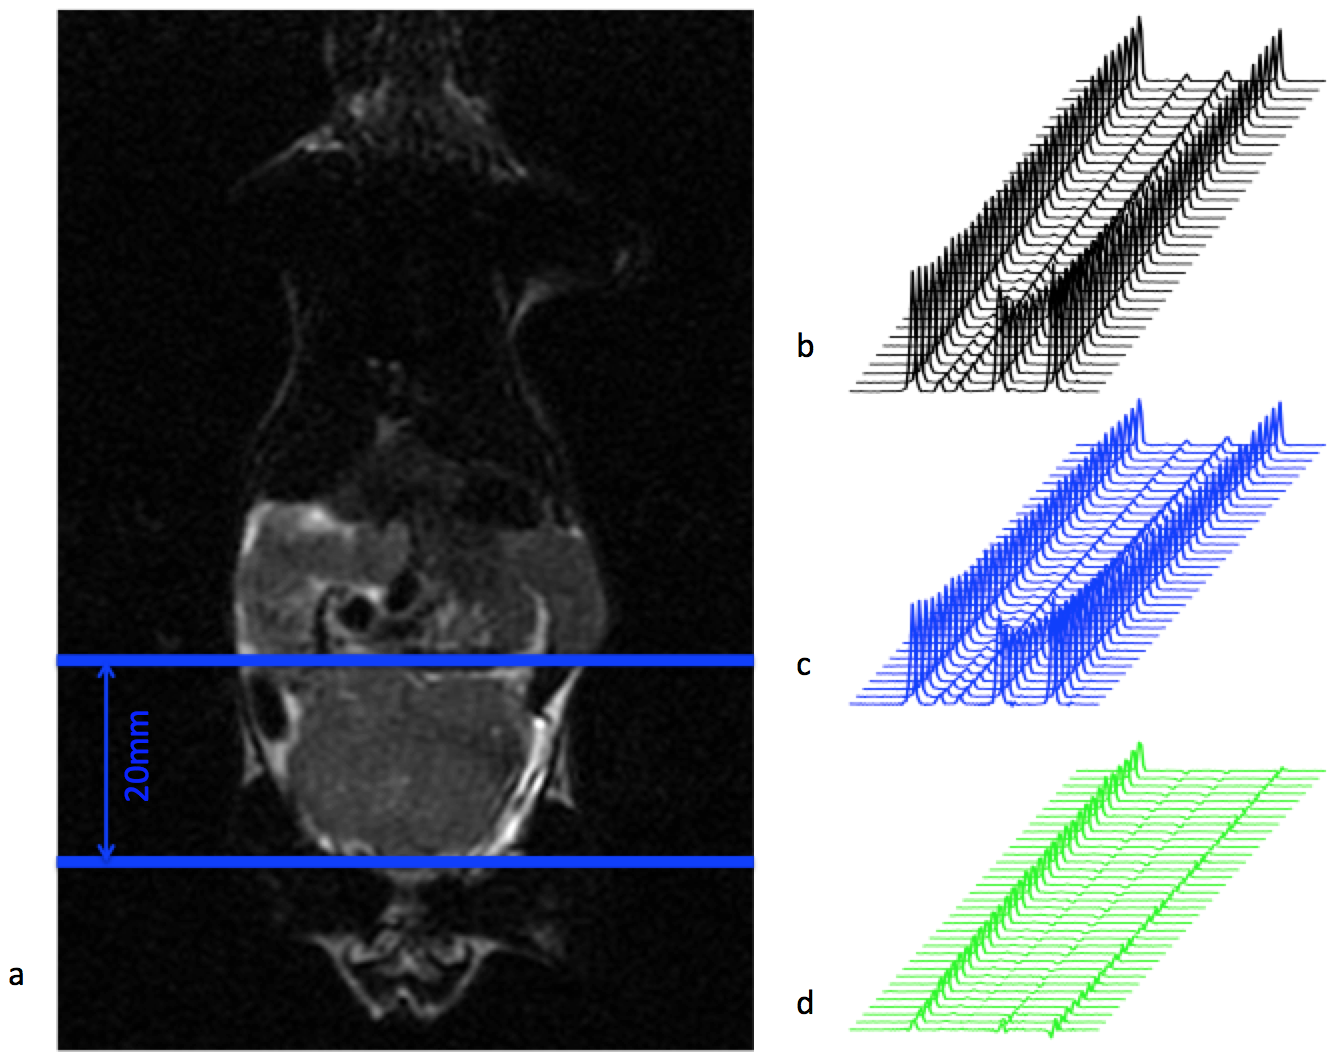
All imaging experiments were performed on a 3 Tesla MRI scanner (GE Healthcare, WI, USA) with a custom built, 1H/13C dual-tuned mouse birdcage coil for transmit and receive. T2-weighted anatomical fast spin echo (FSE) images (TE/TR = 102/5820 ms) were acquired to reference the spectroscopic data and to measure the tumor size. All imaging sessions included a rapid exchange spectroscopy acquisition as previously described by Larson et al1 and in Figure 1a. The sequence included an encoding portion compromised of two 90° slice selective pulses, a progressive flip angle scheme for efficient magnetization usage, and two adiabatic 180° pulses for phase sensitive reconstruction. This slab dynamic sequence covered a 20 mm axial tumor slab as shown in Figure 2a, and spanned a total of 20 seconds with a 0.5 second temporal resolution. The acquisition began at 25 seconds after hyperpolarized media injection started.
Data Processing and Reconstruction
Tumor volume was measured from the T2-weighted anatomical images with OsiriX (Open Source) by manually outlining the tumor from each coronal image. The Response Evaluation Criteria in Solid Tumors (RECIST) 2 was used to evaluate therapy response. The exchange spectroscopic data was processed in MATLAB (The MathWorks, Natick, MA), as previously described1. Briefly, the co-polarized 13C-urea was used as a phase reference to correct for the zero-order spectral phase. Area under the peaks in both the real and imaginary channels were integrated for metabolic fitting with a model shown in Figure 1b.
Results and Discussion
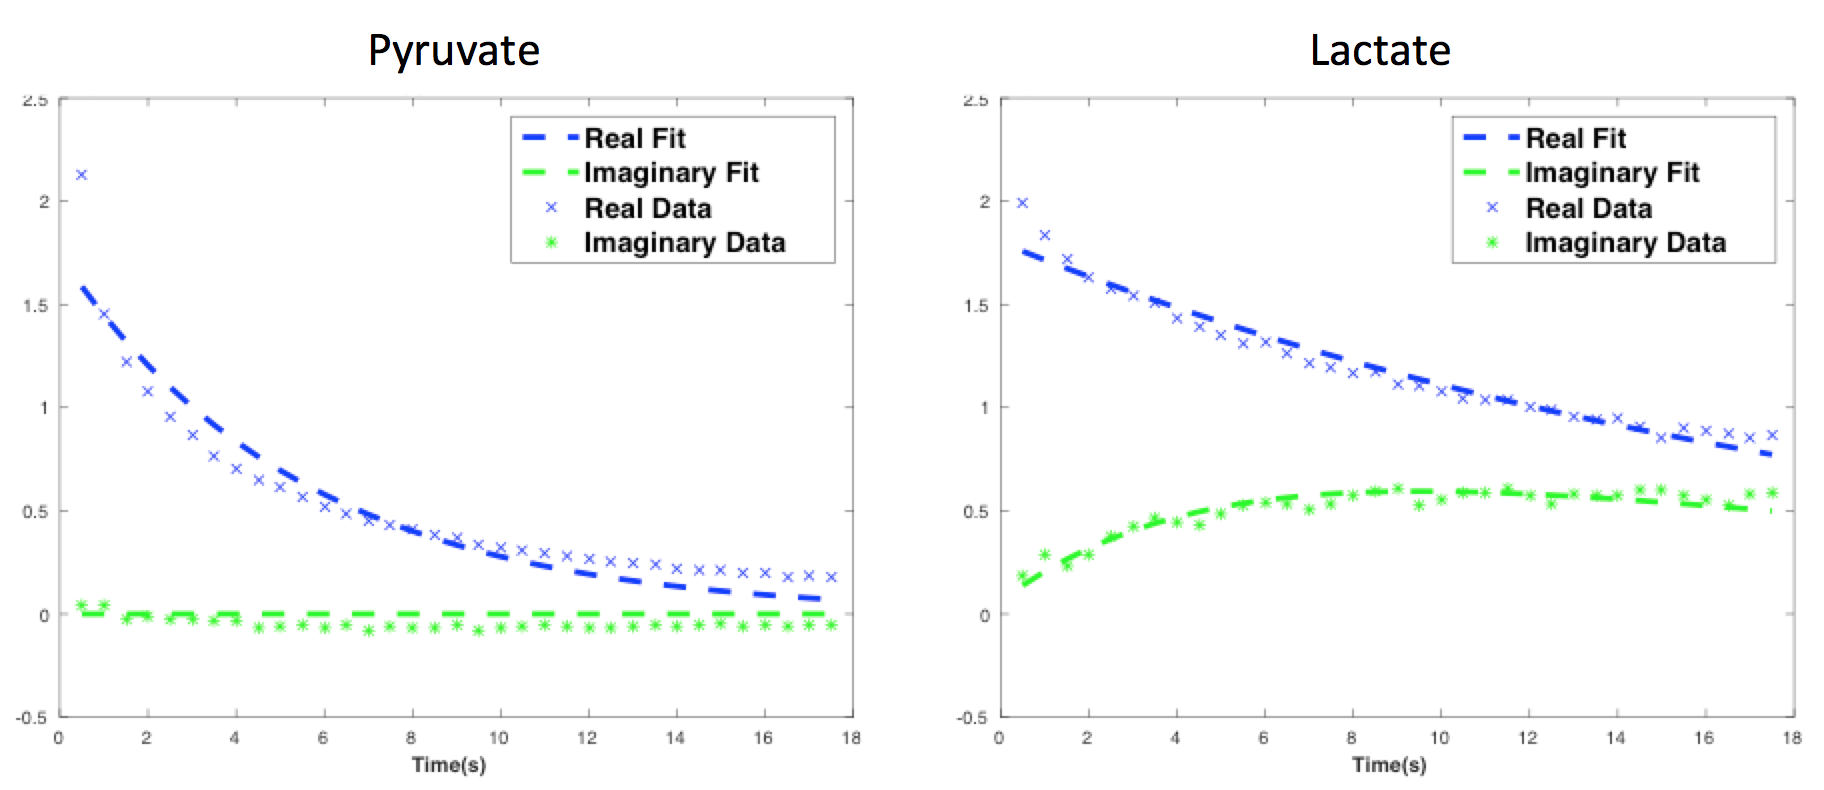
The rapid exchange spectroscopic sequence demonstrated high signal to noise ratio (SNR) in both real and imaginary spectra throughout the dynamic acquisition, as shown in Figure 2b. The magnitude spectra decomposed into the real spectra, containing information from the original metabolites, and the imaginary spectra, containing information from the newly converted metabolites during the Mixing Time (TM). Figure 3 shows a representative kinetic fitting of the original and new metabolites, using the equation shown in Figure 1b. In these tumor datasets, pyruvate to lactate conversion was typically high due to up-regulated lactate dehydrogenase (LDH) activity, and lactate to pyruvate conversion was relatively low resulting in negligible signal of pyruvate in the imaginary channel.
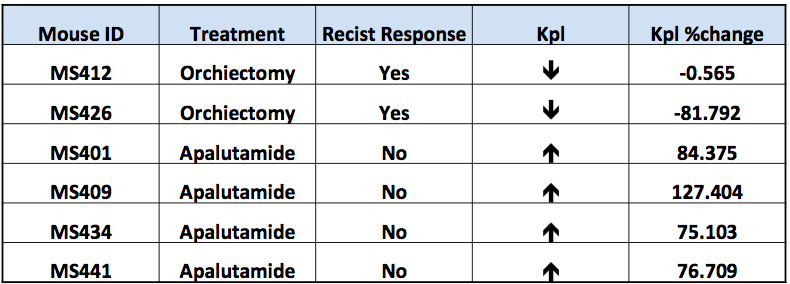
Compare to the baseline study, primary tumor volume increased for all mice in this study. The two mice with androgen sensitive tumors who received orchiectomy demonstrated response to treatment according to RECIST, while the 4 advanced androgen insensitive tumors treated with apalutamide did not respond. 13C metabolic imaging results predicted therapeutic response based on RECIST criteria; responding mice showed similar or ever lower kPL compare to the baseline study, and non-responding mice showed tumor progression with a substantial kPL increase.
Conclusions
The new hyperpolarized 13C metabolic imaging incorporating rapid exchange spectroscopic sequence was applied to cancer therapy monitoring and disease progression in a preclinical tumor model. The estimated LDH activity predicted therapeutic response based on RECIST criteria and is a very promising approach for assessing tumor response in future clinical trials of new therapeutic approaches.Acknowledgements
The authors would like to acknowledge funding from R01EB017449, R01CA183071, R01EB013427, and P41EB013598.References
[1] Larson, Peder EZ, et al. "A rapid method for direct detection of metabolic conversion and magnetization exchange with application to hyperpolarized substrates." Journal of Magnetic Resonance 225 (2012): 71-80.
[2] Eisenhauer, EA1, et al. "New response evaluation criteria in solid tumours: revised RECIST guideline (version 1.1)." European journal of cancer 45.2 (2009): 228-247.
Figures