2923
Estimation of Contributions to Z-Spectra from CEST and Magnetization Transfer Contrast from Active and Necrotic/Apoptotic Regions of MDA Tumour Xenografts1Physical Sciences, Sunnybrook Research Institute, Toronto, ON, Canada, 2Radiation Oncology, Sunnybrook Health Sciences Centre, Toronto, ON, Canada, 3Medical Biophysics, University of Toronto, Toronto, ON, Canada, 4Radiation Oncology, University of Toronto, Toronto, ON, Canada, 5Neurosurgery and Pediatric Neurosurgery, Medical University of Lublin, Lublin, Poland
Synopsis
Chemical exchange saturation transfer (CEST) MR imaging has been demonstrated to be able to differentiate active from necrotic/apoptotic regions in MDA tumour xenografts. However, the Z-spectrum reflects not only CEST from dissolved proteins, but also contributions from water saturation and magnetization transfer contrast from semisolid macromolecules. We estimated their individual effect sizes and calculated which significantly contribute to the difference in Z-spectrum amplitude between the two tumour regions. The difference in Z-spectrum amplitude between active and necrotic/apoptotic regions in MDA tumour xenografts is due to the CEST effect with minimal contribution from magnetization transfer contrast and direct water saturation.
Introduction
Chemical exchange saturation transfer (CEST) MR imaging has been demonstrated to be able to differentiate active from necrotic/apoptotic regions in MDA tumour xenografts1. However, the Z-spectrum reflects not only CEST from dissolved proteins, but also contributions from water saturation (called the direct effect; DE) and magnetization transfer contrast (MTC) from semisolid macromolecules2. We estimated their individual effect sizes and calculated which significantly contribute to the difference in Z-spectrum amplitude between the two tumour regions.Methods
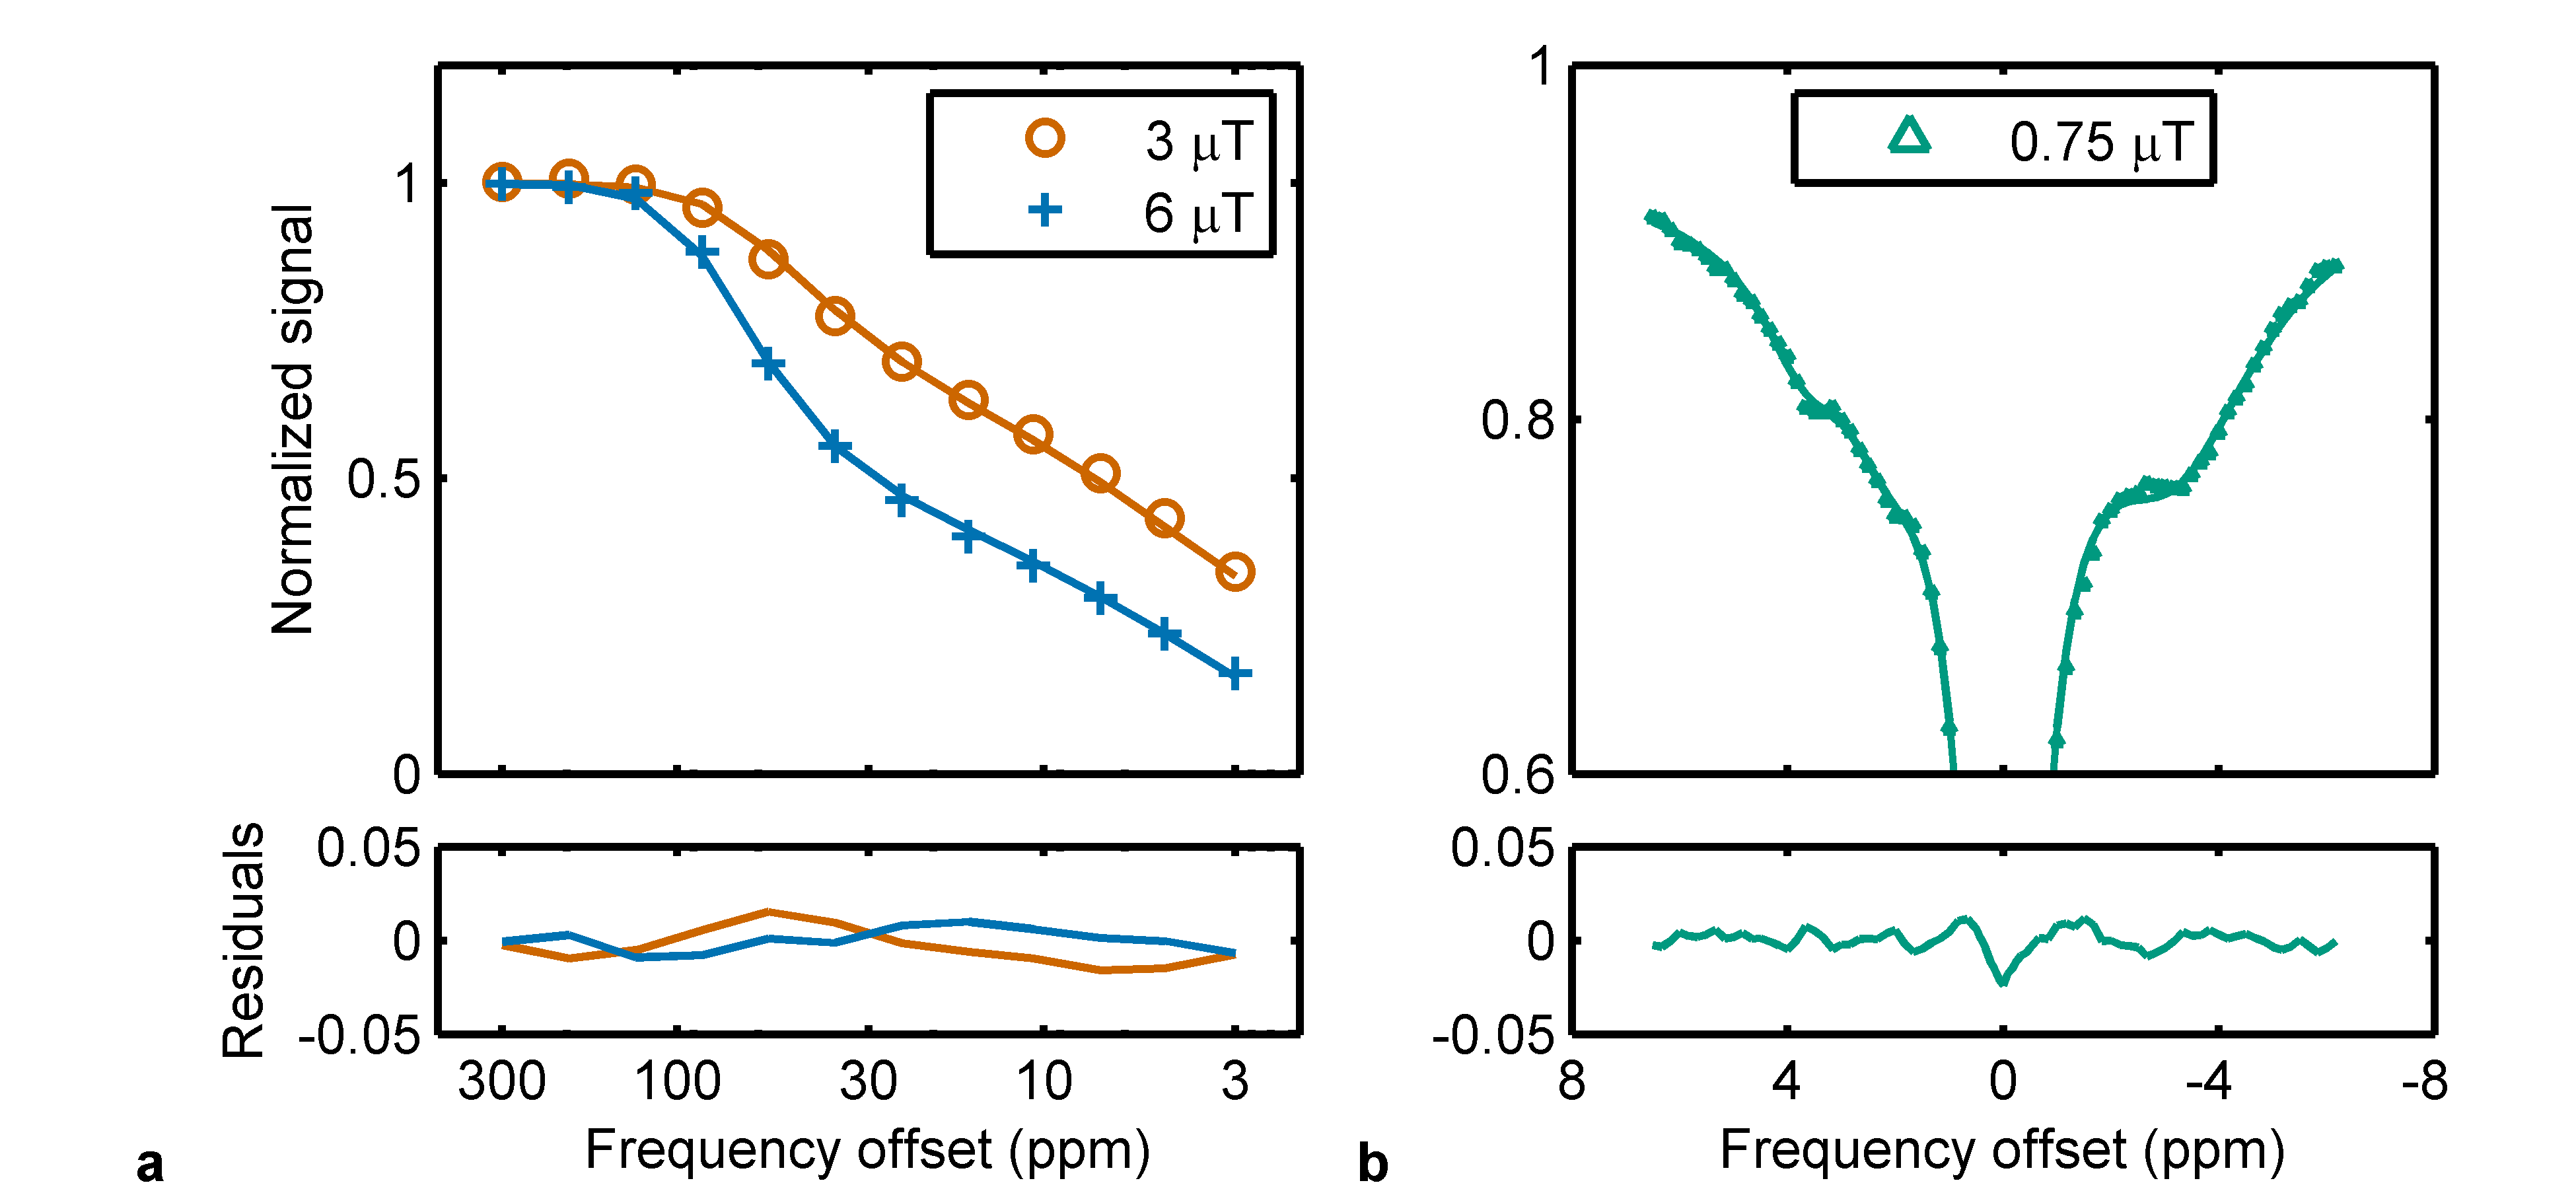
MDA-MB-231 human breast cancer cells (2 × 10⁶) were implanted into the hind limb of BALB/c mice (n = 6) and the tumours were allowed to grow to 6–8 mm in diameter. CEST and MTC spectra were acquired on a single slice through the tumour on a 7T animal scanner (Bruker BioSpec 70/30 USR). The CEST saturation was achieved using a 0.75 µT RF saturation block pulse of 4900 ms duration and MTC saturations using similar pulses of 3 and 6 µT. Inversion recovery-based T1 and FLASH-based B1 scale factor maps were also acquired. The tumours were then excised and stained with TUNEL to differentiate active from necrotic/apoptotic regions. The first Z-spectrum image was used as a registration reference for subsequent images and Rician noise- and B0-correction were applied. Regions of interest were manually drawn using the TUNEL image as a reference. The mean spectra and maps were fitted to the Bloch–McConnell equations3,4 describing water, MTC, and three CEST pools with 16 free parameters (T2 of the water pool; exchange rate, relative spin density (water = 1), and T2 of each MTC and CEST pool; and resonance offset of each CEST pool) with T1 of the water pool calculated from the measured T1 map and fitted parameters and T1 of the other pools set to 1 s (see Ref. 4 for details).
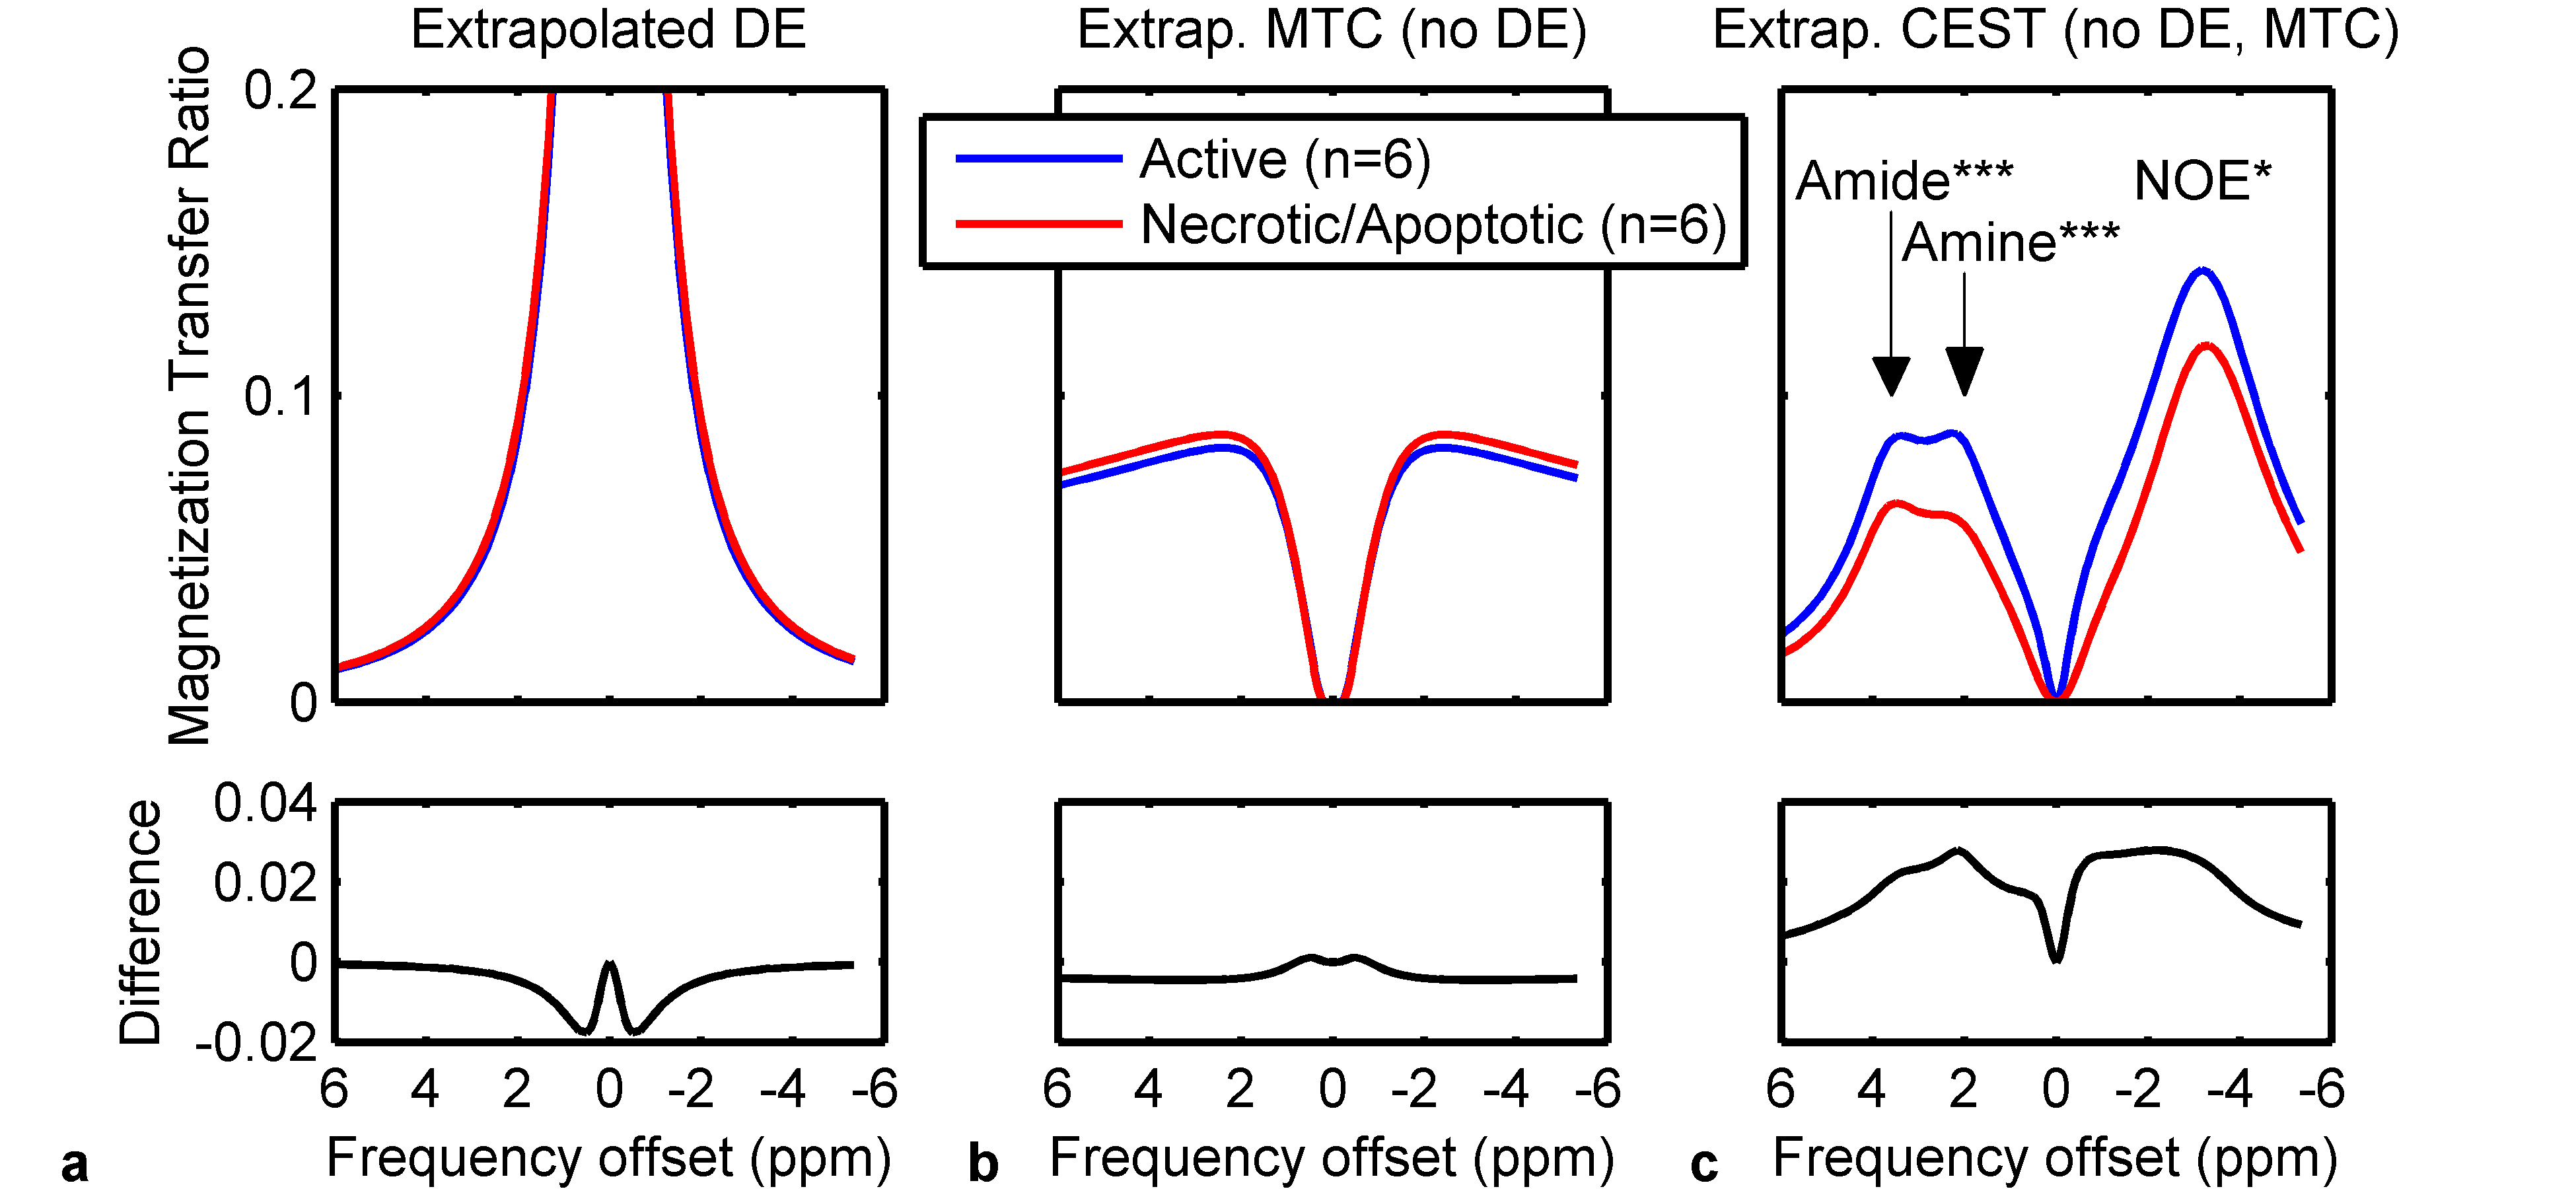
The DE magnetization transfer ratio was calculated by 1 – Z-spectrum(DE) and pure MTC and CEST magnetization transfer ratios (all at the CEST saturation power) were calculated by:
MTC magnetization transfer ratio = Z-spectrum(DE) – Z-spectrum(DE,MTC)
CEST magnetization transfer ratio = Z-spectrum(DE,MTC) – Z-spectrum(DE,MTC,CEST)
All calculations were performed using MATLAB. Because of the short transverse relaxation times in the MTC and CEST pools, their spin densities cannot be determined and are coupled with the exchange rate5. However, since we are not estimating uncoupled MTC and CEST pool parameters and only estimating Z-spectra with the absence of certain pools, it is permissible to use coupled parameters here.
Results
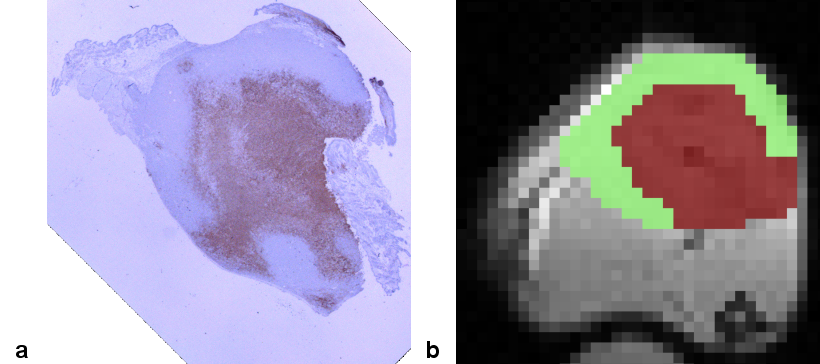
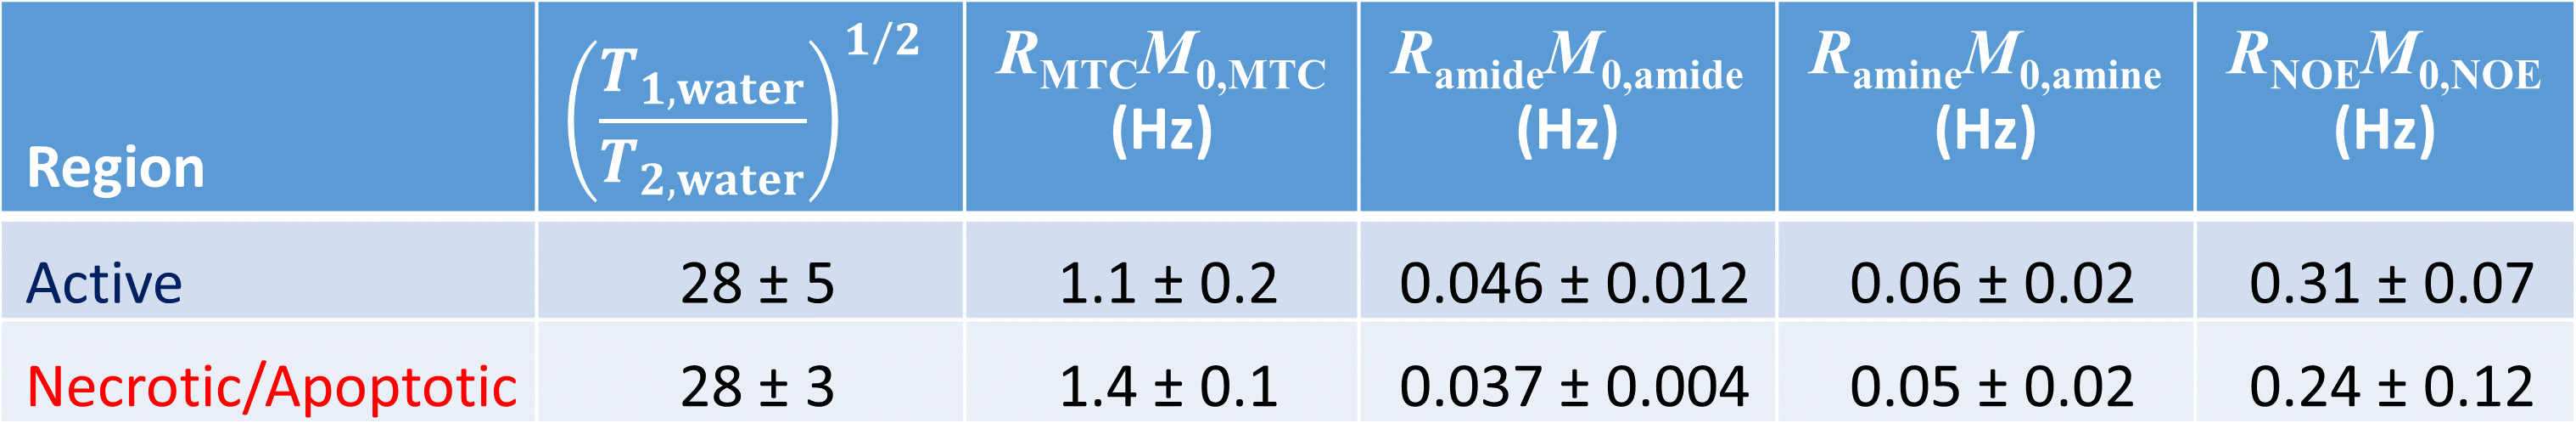
An example of a TUNEL stained tumour and regions of interest is shown in Fig. 1. The MTC and CEST Z-spectra were fitted well (Fig. 2) with reduced χ2 values in the range 1.8–5.8, which indicates good fitting without overfitting. Mean extrapolated DE, MTC, and CEST magnetization transfer ratios (Fig. 3) show that the largest contribution to the Z-spectrum arises from CEST, specifically the amide, amine, and aliphatic NOE pools. The products of exchange rate R and relative spin density M0 for the MTC and CEST pools are given in Table 1 and the relative values between active and necrotic/apoptotic regions agree well with Fig. 3.Discussion
There was a noticeable, but non-significant difference in MTC magnetization transfer ratio between active and necrotic/apoptotic tumour. However, there was a slightly significant difference between the sum of the DE and MTC magnetization transfer ratios for the two regions at the amide and NOE offsets (not shown). The largest difference to the Z-spectrum originating from CEST was dominant (Fig. 3c), which was expected due to the difference in metabolism between active and necrotic/apoptotic tissue. In future work, the exchange rate and spin density parameters in the Bloch–McConnell equations will be decoupled by the use of multiple CEST saturation powers, which could allow the direct comparison of non-lumped model parameters.Conclusion
The difference in Z-spectrum amplitude between active and necrotic/apoptotic regions in MDA tumour xenografts is due to the CEST effect with minimal contribution from magnetization transfer contrast and direct water saturation.Acknowledgements
The authors thank Dr. Azza Al-Mahrouki and Dr. Wendy Oakden for helpful technical discussions.References
1. Desmond KL, Moosvi F, and Stanisz GJ. Mapping of amide, amine, and aliphatic peaks in the CEST spectra of murine xenografts at 7 T. Magn Reson Med. 2013;71(5):1841–1853.
2. van Zijl PCM and Yadav NN. Chemical exchange saturation transfer (CEST): What is in a name and what isn't? Magn Reson Med. 2011;65(4):927–948.
3. McConnell HM. Reaction rates by nuclear magnetic resonance. J Chem Phys. 1958;28(3):430–431.
4. Desmond KL and Stanisz GJ. Understanding quantitative pulsed CEST in the presence of MT. Magn Reson Med. 2012;67(4):979–990.
5. Stanisz GJ, Kecojevic A, Bronskill M, et al. Characterizing white matter with magnetization transfer and T2. Magn Reson Med. 1999;42(6):1128–1136.
Figures