2920
Combining DW- and DCE-MRI for treatment response assessment in patients with esophageal cancer undergoing neoadjuvant chemoradiotherapy1Department of Radiotherapy, University Medical Center Utrecht, Utrecht, Netherlands, 2Department of Surgery, University Medical Center Utrecht, Utrecht, Netherlands, 3Department of Radiotherapy, The Netherlands Cancer Institute-Antoni van Leeuwenhoek Hospital, Amsterdam
Synopsis
Neoadjuvant chemoradiotherapy prior to surgery is often used for treatment of patients with esophageal cancer. Potential benefit could be gained developing a patient tailored treatment, especially for the 29% of the patients who show a pathologic complete response. In this prospective multicenter study it was investigated whether combining DCE- and DW-MRI, which both showed potential for response prediction in previous studies, yields complementary information. It was found that the combination of DCE- and DW-MRI can increase the predictive values and reaches higher ROCAUC.
Purpose
Neoadjuvant chemoradiotherapy (nCRT) is often used prior to surgery to treat esophageal cancer. nCRT leads to pathologic complete response (pCR) in 29% of the patients. Patient outcome depends largely on response to chemo(radio)therapy1-3, therefore benefit could be gained developing a patient-tailored treatment. For example, surgery may be omitted or postponed in case of pCR while in patients with poor response neoadjuvant treatment may be modified in case accurate prediction of treatment response is available. In our previous studies it was found that both dynamic contrast enhanced (DCE-) and diffusion weighted (DW-) MRI show potential for response prediction4-5. This prospective multicenter study assessed whether combining DCE- and DW-MRI for response prediction yields complementary information and therefore could increase predictive values.Methods
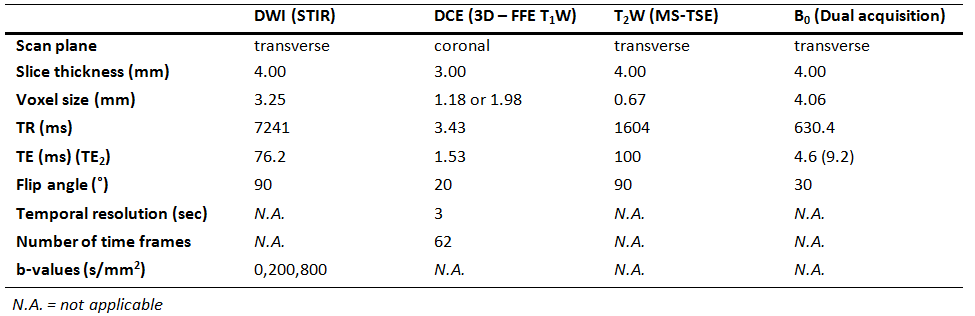
In 2 centers, 45 patients that were planned to undergo nCRT followed by surgery were included (UMCU [n=31]/NKI [n=14]). MRIs were performed on a 1.5T system (Achieva/Ingenia, Philips, Best, the Netherlands) before nCRT (pre), during the second week of nCRT (per) and before surgery (post, 3-9 weeks after nCRT completion). DWI series included three b-values (0,200,800 s/mm2) and were corrected for geometric distortions using a B0-field map6. ADC values were calculated using a mono-exponential model. The DCE-series consisted of 62 scans. After the 10th scan the contrast agent (CA) was injected (see Table 1 for scan parameters). Concentration of CA was calculated and analysis was performed on the area-under-the-concentration-time curve (AUC), defined as the integral of 60 seconds after the first CA inflow. The primary tumor was delineated on b800-s/mm2 pre-DWI using ITK-SNAP7. If necessary, adjustments were made using the ADC-map and transverse T2W scan. On the sequential scans this delineation was registered and adjusted for changes in e.g. esophageal circumference. Following our previous work, median ADC and 75th percentile (P75) AUC were calculated within the tumor volume. For both modalities percentage differences were calculated with respect to the first scan. After resection, pathologic assessment of the tumor regression grade (TRG) was performed8. Predictive values of pCR versus no-pCR as well as good response (GR, TRG 1-2) versus poor response (TRG 3-5) were determined for both modalities. Statistical analysis was performed using a Mann-Whitney U test. In the combined analysis a discrimination between GR and no-GR was reached using a linear curve with varying slope (∆AUC=threshold*∆ADC+offset). The ROCAUC and predictive values of three example curves were calculated.
Results
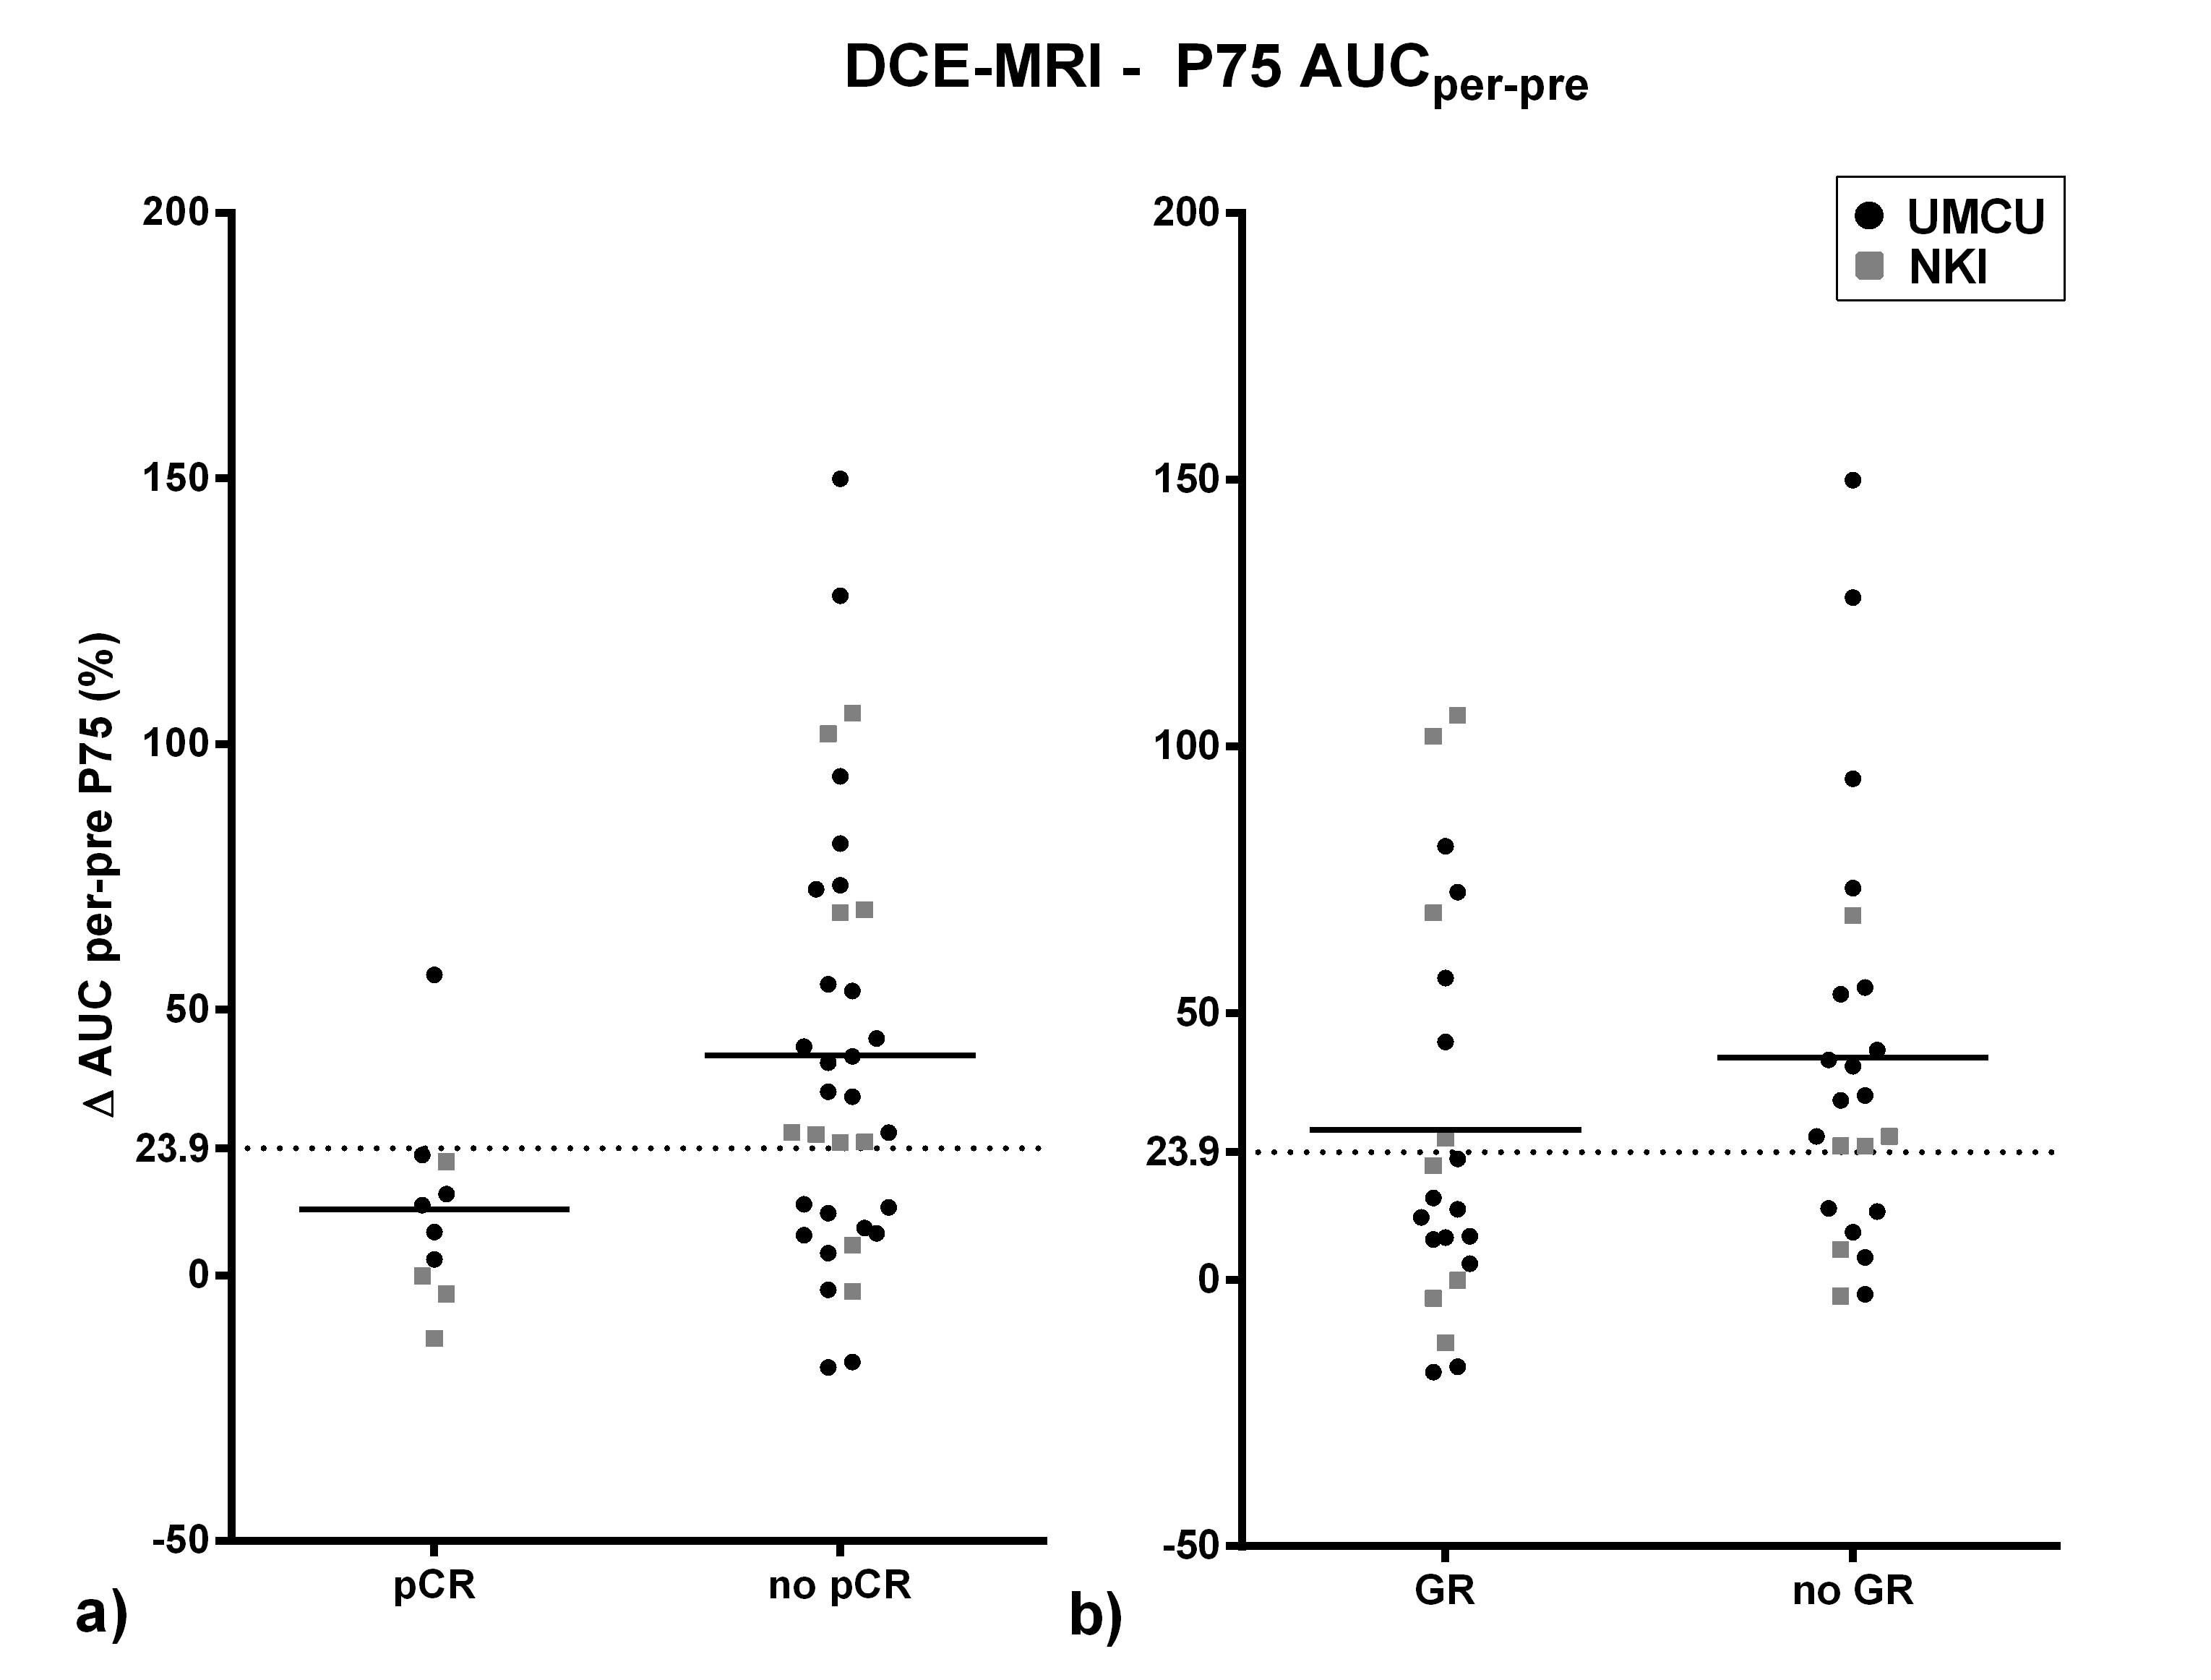
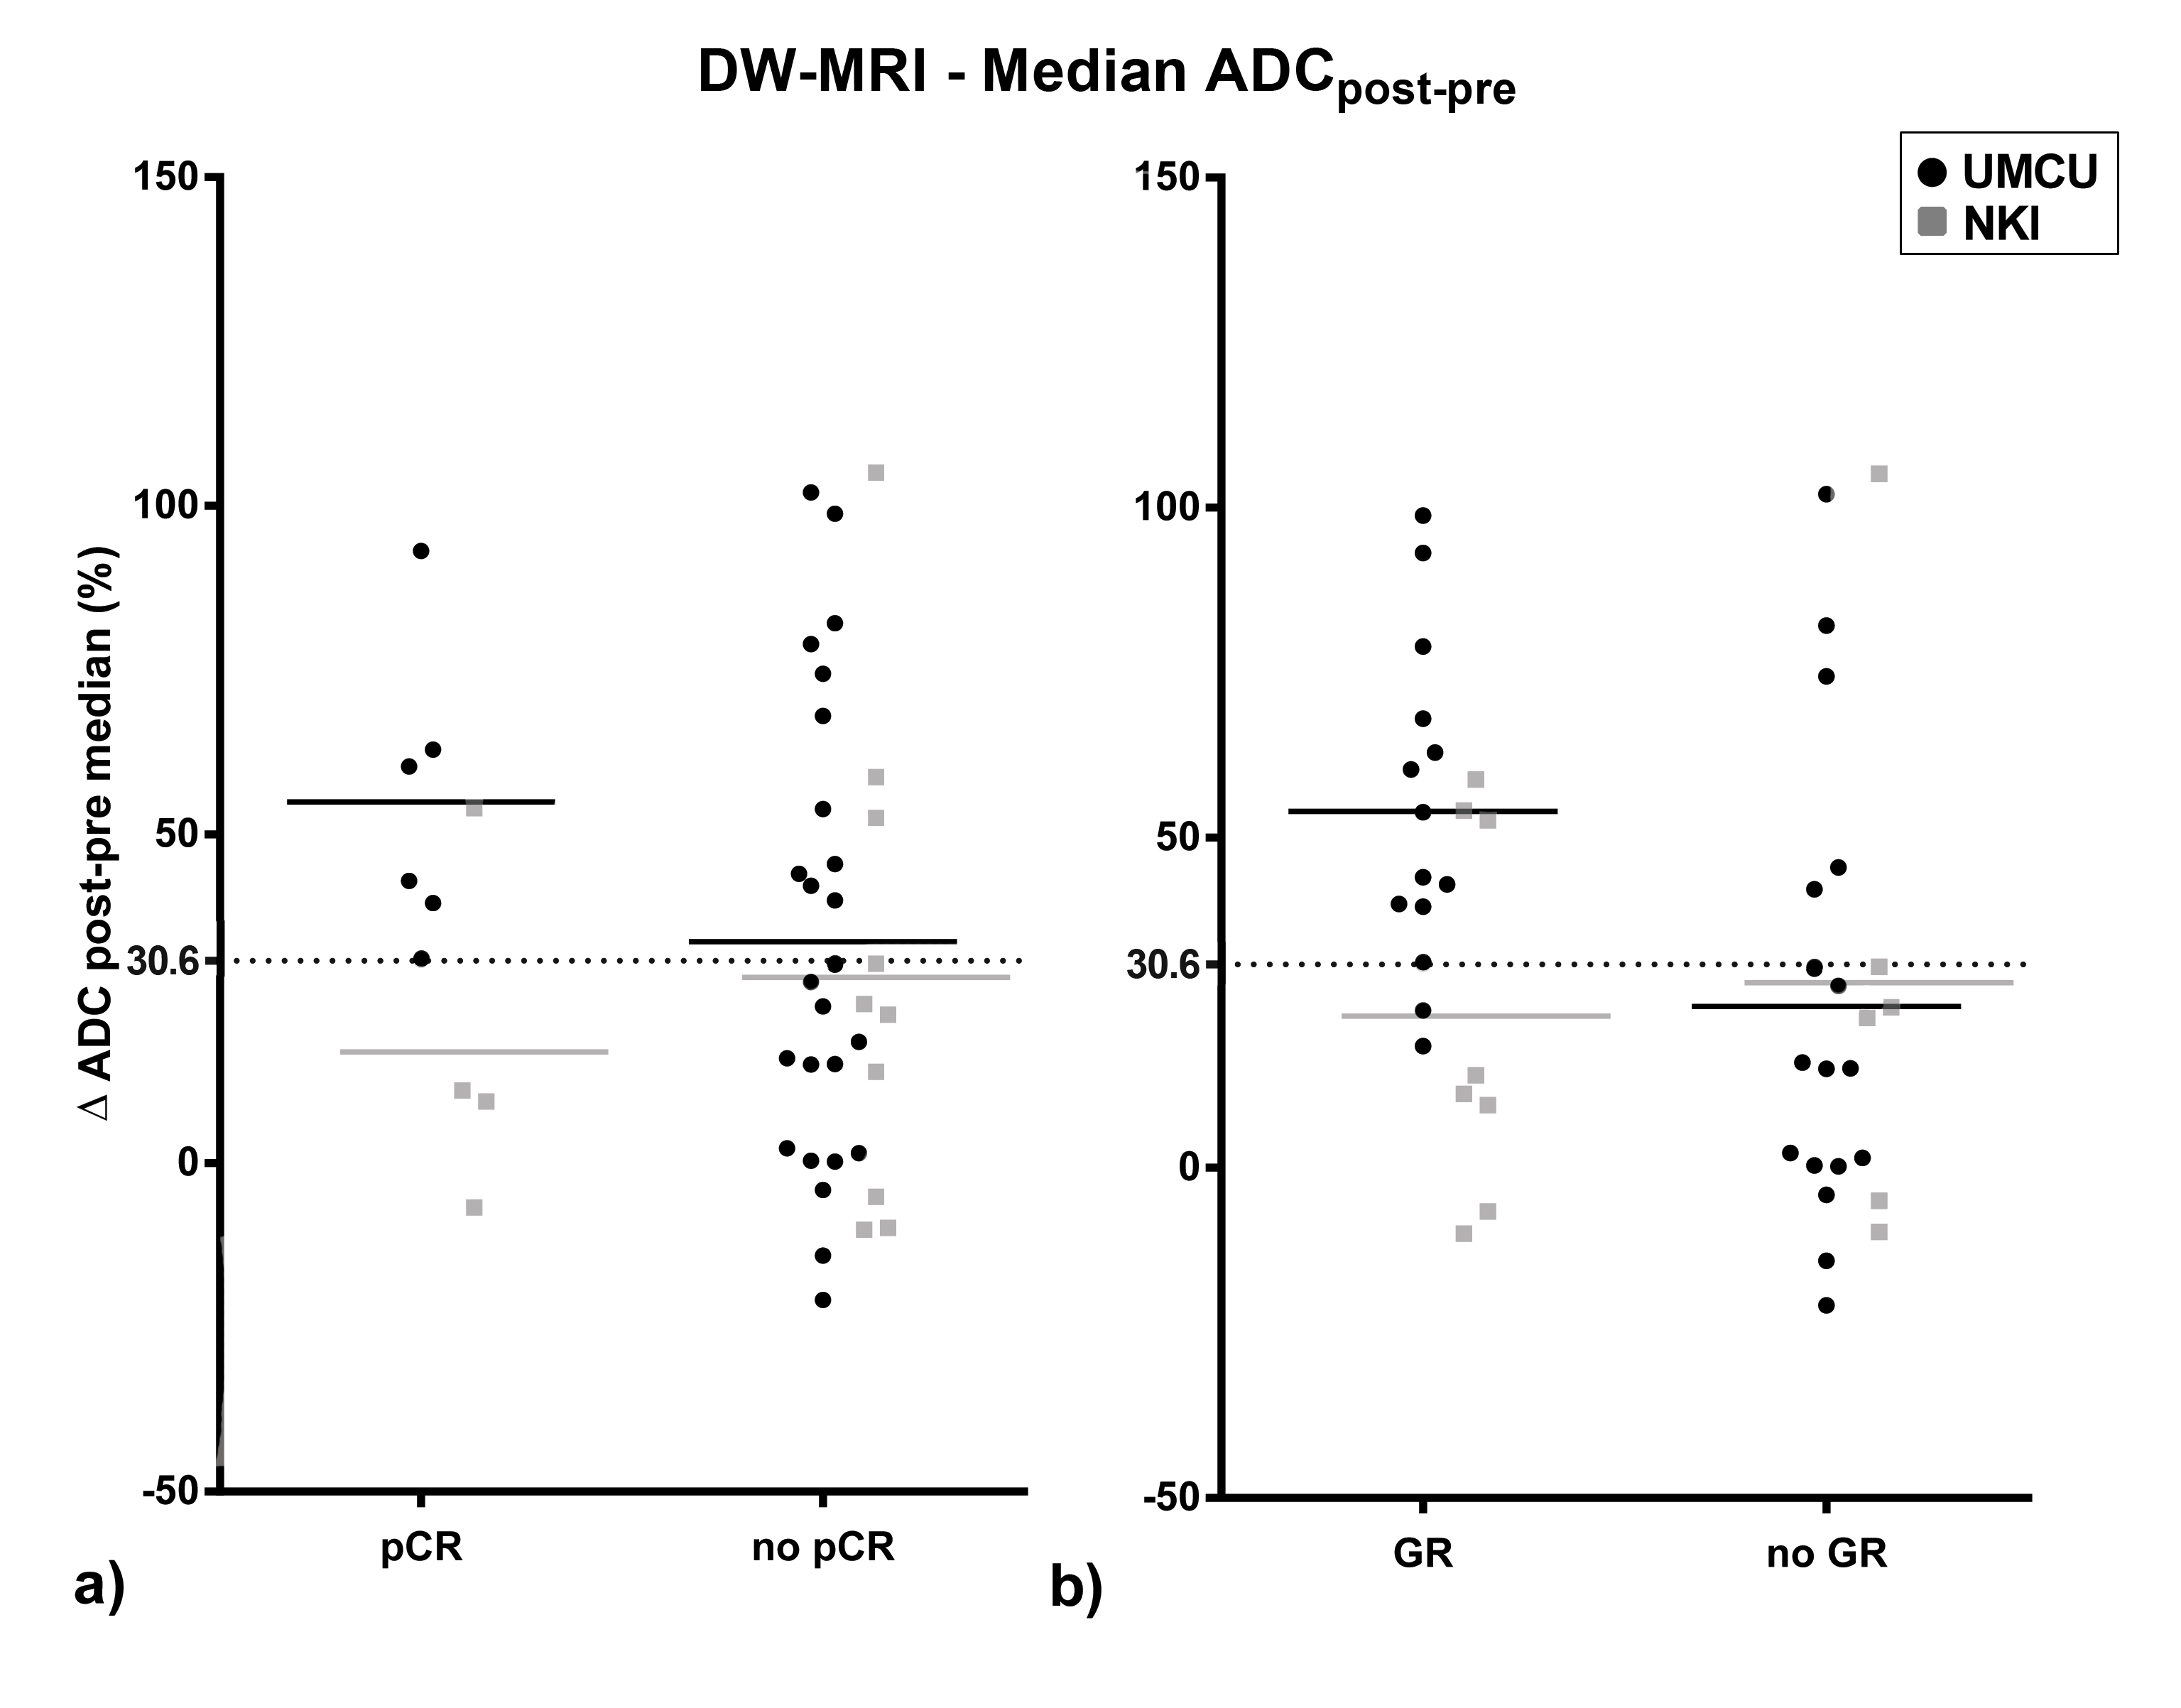
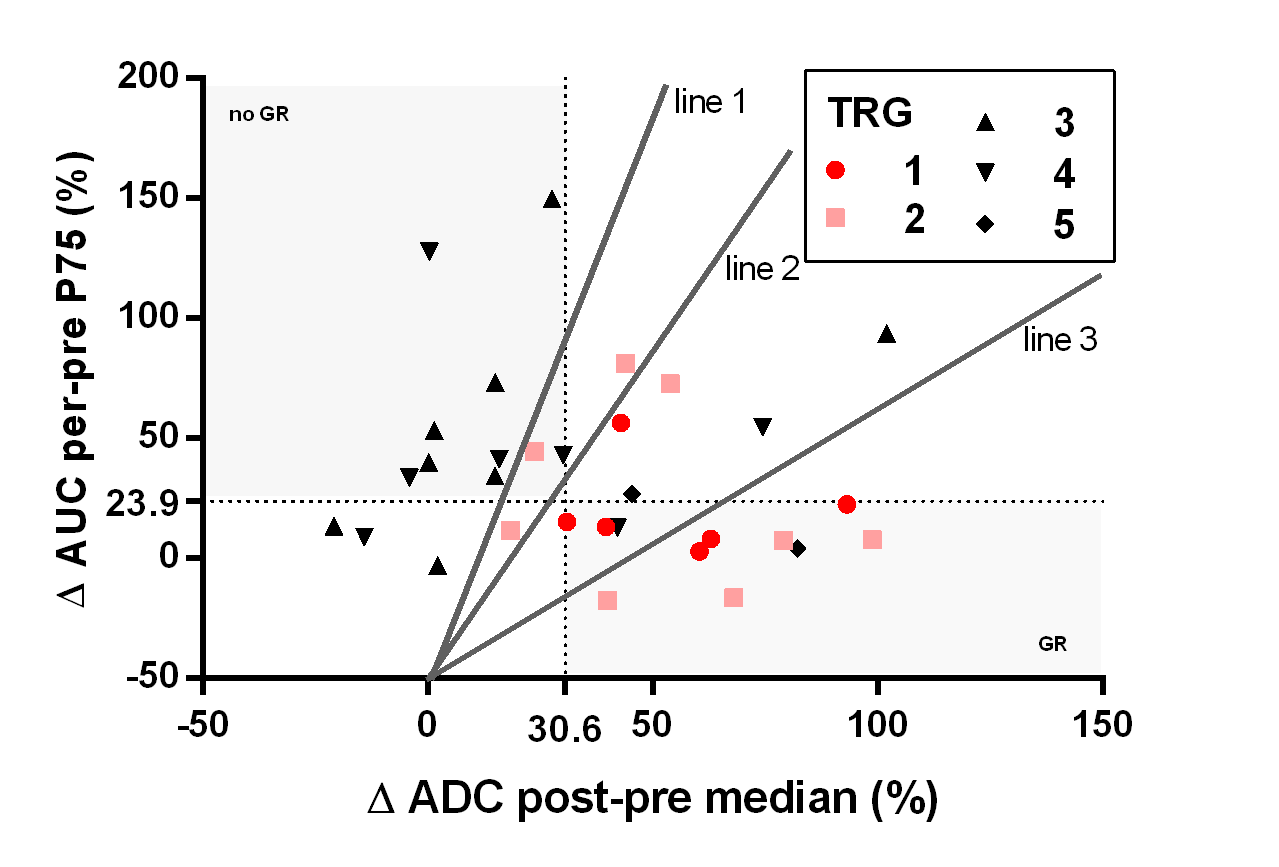
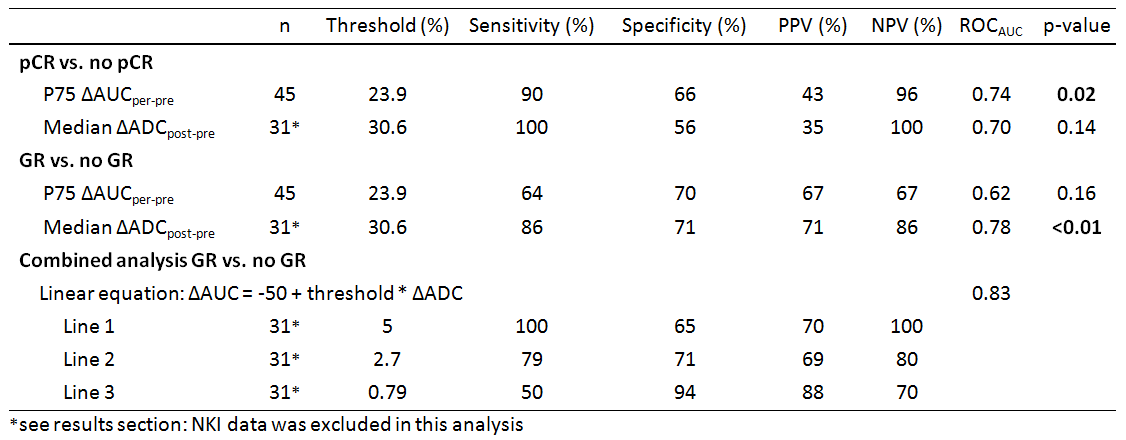
Pathologic assessment revealed pCR in 10 patients, TRG 2 in 12 patients and TRG > 2 in 23 patients. For the AUC analysis, the per-pre percentage change was most predictive, which is in agreement with the previous study5. Data is presented in Figure 1, both for pCR and for GR versus the rest. ROCAUC values of 0.74 and 0.62 were reached for discrimination of pCR and GR respectively. In the ADC analysis, the ∆ADCpost-pre was most predictive. There appeared deviant behavior between data from both institutes and a ROCAUC value of 0.70 was reached while excluding NKI-data compared to 0.58 for all data combined (pCR versus no-pCR). Therefore in this analysis the NKI-data was excluded, analyzing 31 patients (of which 6 pCR and 8 TRG 2 patients). GR versus the rest reached a ROCAUC of 0.78. In Figure 3 both modalities are combined, shaded areas represent areas of agreement upon response prediction using thresholds for both modalities. Positive and negative predictive values (PPV/NPV) and sensitivity and specificity for both modalities to predict GR/pCR are presented in Table 2. Also values are presented for three lines, combining ADC and AUC, to predict GR. One balancing predictive values equally, one with high PPV and one with high NPV.Discussion/Conclusion
Both DCE- and DW-MRI show potential for response prediction. DCE-MRI data from both institutes showed equal behavior and in previous work it was verified that data from both institutes could be pooled5. For the DW-MRI, which was not previously pooled, a difference was found between data from both institutes. Therefore the NKI-data was excluded until further research will elucidate these institutional differences, with a focus on partial volume effects (volumes in NKI-data appeared smaller than UMCU) and a quantitative phantom comparison. Trends visible for responders (∆AUC low, ∆ADC high) corresponded to previous work4-5. Combining the two modalities revealed patients correctly classified using one modality and incorrectly using the other, indicating that both modalities could complement each other. Furthermore, for response prediction, the combination of both modalities with a linear equation reached a higher ROCAUC then both modalities separate. However, DW-MRI results showed that a multicenter validation should be performed before these results can be applied in general.Acknowledgements
No acknowledgement found.References
[1] Sjoquist KM, Burmeister BH, Smithers BM, et al. Survival after neoadjuvant chemotherapy or chemoradiotherapy for resectable oesophageal carcinoma: an updated meta-analysis. Lancet Oncol 2011;12:681–92
[2] Donahue JM, Nichols FC, Li Z, et al. Complete pathologic response after neoadjuvant chemoradiotherapy for esophageal cancer is associated with enhanced survival. Ann Thorac Surg 2009;87:392–9
[3] Allum WH, Stenning SP, Bancewicz J, et al. Long-term results of a randomized trial of surgery with or without preoperative chemotherapy in esophageal cancer. J Clin Oncol 2009;27:5062–7
[4] van Rossum PSN, van Lier ALHMW, van Vulpen M, et al. Diffusion-weighted magnetic resonance imaging for the prediction of pathologic response to neoadjuvant chemoradiotherapy in esophageal cancer. Radiother Oncol 2015;115:163–70
[5] Heethuis SE, van Rossum PSN, Lips IM, et al. Dynamic contrast-enhanced MRI for treatment response assessment in patients with oesophageal cancer receiving neoadjuvant chemoradiotherapy. Radiother Oncol 2016; 120:128-135
[6] Jezzard, P, Balaban, RS. Correction for geometric distortion in echo planar images from B0 field variations. Magnetic Resonance in Medicine 1995;34(1), 65–73
[7] Yushkevich PA, Piven J, Hazlett HC, et al. User-guided 3D active contour segmentation of anatomical structures: Significantly improved efficiency and reliability. Neuroimage 2006 Jul 1;31(3):1116-28
[8] Mandard A, Dalibard F, Mandard J. Pathologic assessment of tumor regression after preoperative chemoradiotherapy of esophageal carcinoma. Clinicopathologic correlations. Cancer 1994:2680–6
Figures