2919
In vivo OE-MRI quantification and mapping of response to hypoxia modifying drugs Banoxantrone and Atovaquone in Calu6 xenografts1Centre for Imaging Sciences, University of Manchester, Manchester, United Kingdom, 2Manchester Pharmacy School, University of Manchester, Manchester, United Kingdom, 3CRUK/MRC Oxford Institute for Radiation Oncology and Biology, University of Oxford, Oxford, United Kingdom, 4Bioxydyn Ltd, Manchester, United Kingdom, 5Institute of Cancer Sciences, University of Manchester, Manchester, United Kingdom, 6Department of Radiology, The Christie NHS Foundation Trust, Manchester, United Kingdom
Synopsis
Oxygen-enhanced MRI (OE-MRI) has shown promise as a technique for quantifying and spatially mapping tumour hypoxia. Here we report the first evidence that OE-MRI signals in perfused tumour can non-invasively track therapy-induced changes in hypoxia in vivo in a tumour model. We show that OE-MRI detects (1) reduction in hypoxia and increase in necrosis induced by the hypoxia-activated cytotoxic prodrug Banoxantrone; and (2) reduction in hypoxia and increase in well oxygenated tumour induced by Atovaquone due to increased oxygen availability. These data support first-in-man use of OE-MRI biomarkers in clinical trials of hypoxia-modifying agents.
Purpose
Tumour hypoxia is a poor prognostic indicator. Presence of hypoxia results in radiotherapy failure in multiple solid tumours1. There is an unmet need to develop non-invasive imaging biomarkers of hypoxia.
Oxygen enhanced MRI (OE-MRI) is an emerging imaging technique for quantifying and spatially mapping tumour hypoxia in vivo. Previously, we combined OE-MRI and gadolinium-based dynamic contrast-enhanced MRI (DCE-MRI) to derive a voxel-wise signature of hypoxia and perfusion, which we validated against pathology in multiple preclinical models2.
Here, we hypothesised that combined OE-MRI/DCE-MRI would quantify and map the changes in hypoxia induced by two drugs with different mechanisms of action. The prodrug Banoxantrone (AQ4N) is activated to form cytotoxic AQ4 in hypoxic tumour regions in Calu6 non-small cell lung cancer xenografts, improving chemoradiotherapy efficacy3. In distinction, Atovaquone decreases oxygen consumption rate in tumours by inhibiting complex 3 of the electron transport chain, thereby increasing radiosensitivity, with maximum effects seen at around 7 days4.
Methods
Study overview
Studies complied with UK guidelines on animal welfare in cancer research5. Tumours were propagated by injecting 0.1 ml of Calu6 cells (2x10⁷ cells/ml) intra-dermally on the lower back of nude mice. When tumours reached >200mm3 by calliper measurement, mice were anaesthetized using 2% isoflurane carried in medical air (21% oxygen). Core temperature was controlled at 36°C. Imaging was performed on a 7T Magnex instrument interfaced to a Bruker Avance III console and gradient system using a volume transceiver coil.
Mice underwent OE-MRI consisting of a variable flip angle (VFA) spoiled gradient echo (SPGR) acquisition to calculate native tissue T1 (α=5°/10°/30°), followed by 42 dynamic T1-weighted SPGR acquisitions (α=30°; 28.8s temporal resolution). After 18 acquisitions gas, delivered through a nose cone, was switched to 100% oxygen. Then VFA-based SPGR DCE-MRI was performed with new native tissue T1 calculation (α=2°/5°/10°), followed by 96 dynamic T1-weighted SPGR acquisitions (α=10°; 5.8s temporal resolution) with Gd-DOTA injected into a tail vein after 24 acquisitions. Finally, tumours were harvested for pathology.
Banoxantrone experiment
Mice received an intraperitoneal injection of either saline (control; n=7) or 60 mg/kg AQ4N (treated; n=12). Subsequent imaging was at 24 hours and day 3.
Atovaquone experiment
Mice received 2% DMSO and 0.1% carboxymethyl-cellulose in drinking water, either alone (control; n=8) or with 50 mg/kg/day Atovaquone (treated; n=10). Subsequent imaging was at day 7.
Image analysis
Non-perfused voxels were identified as IAUC60 ≤ 0 mmol.s on DCE-MRI. Subsequent OE-MRI analysis was restricted to perfused tumour. Oxygen-enhancing (Oxy-E) voxels were defined by significant increase in R1 in the 24 dynamic time points acquired on 100% oxygen breathing compared with the R1 in baseline time points (by a t-test). Voxels without significant oxygen enhancement were termed oxygen refractory (Oxy-R). Previous studies validated Oxy-R as a biomarker of tumour hypoxia and Oxy-E as a biomarker of normoxic tumour2.
Results
Neither drug (Banoxantrone or Atovaquone) induced significant growth inhibition in treated animals, relative to controls.
Banoxantrone experiment
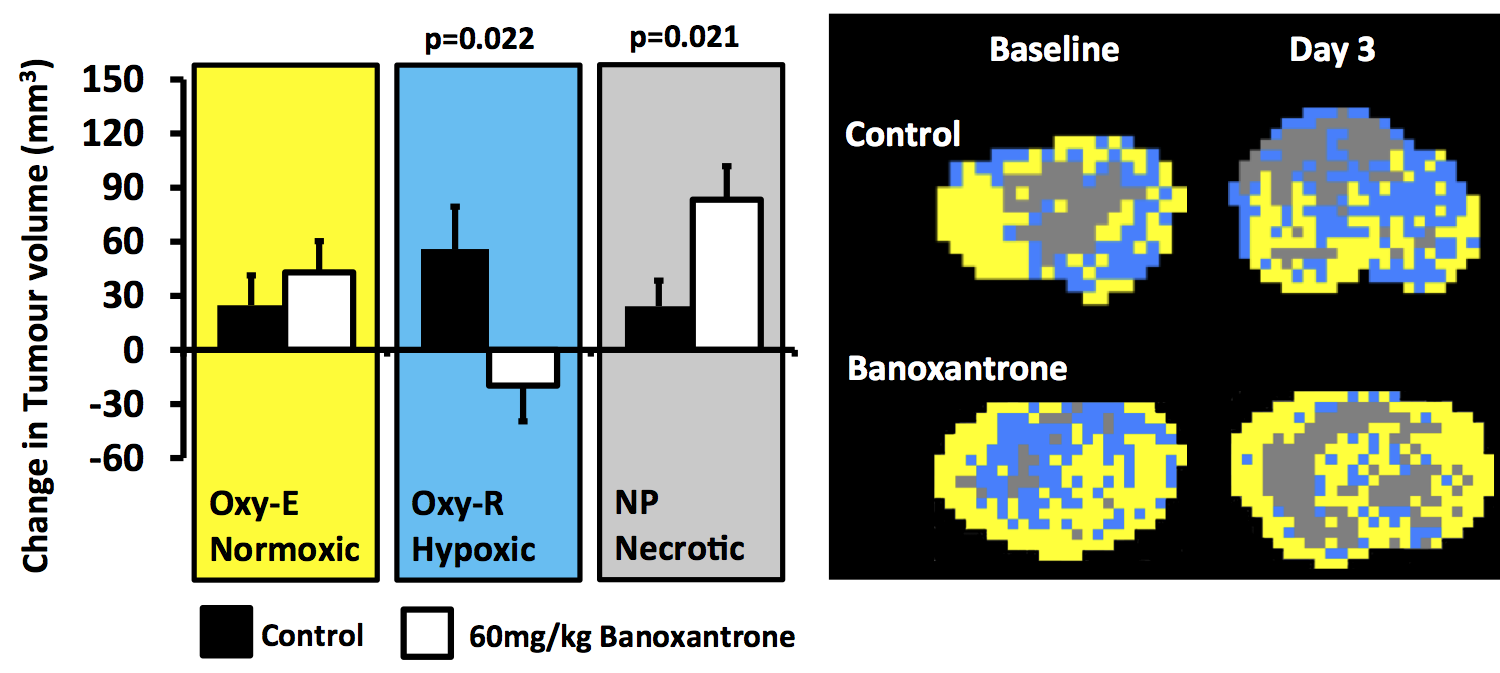
Control tumours showed increase in necrotic (non-perfused), hypoxic (Oxy-R) and normoxic (Oxy-E) tumour volumes by day 3. Calu6 xenografts treated with Banoxantrone showed reduction in hypoxic (Oxy-R) volume within 24 hours in 4 of 5 tumours. By day 3, treated tumours showed relative reduction in hypoxic tumour volume (p=0.022) and greater increase in non-perfused tumour volume (p=0.021), relative to control (Figure 1).
Atovaquone experiment
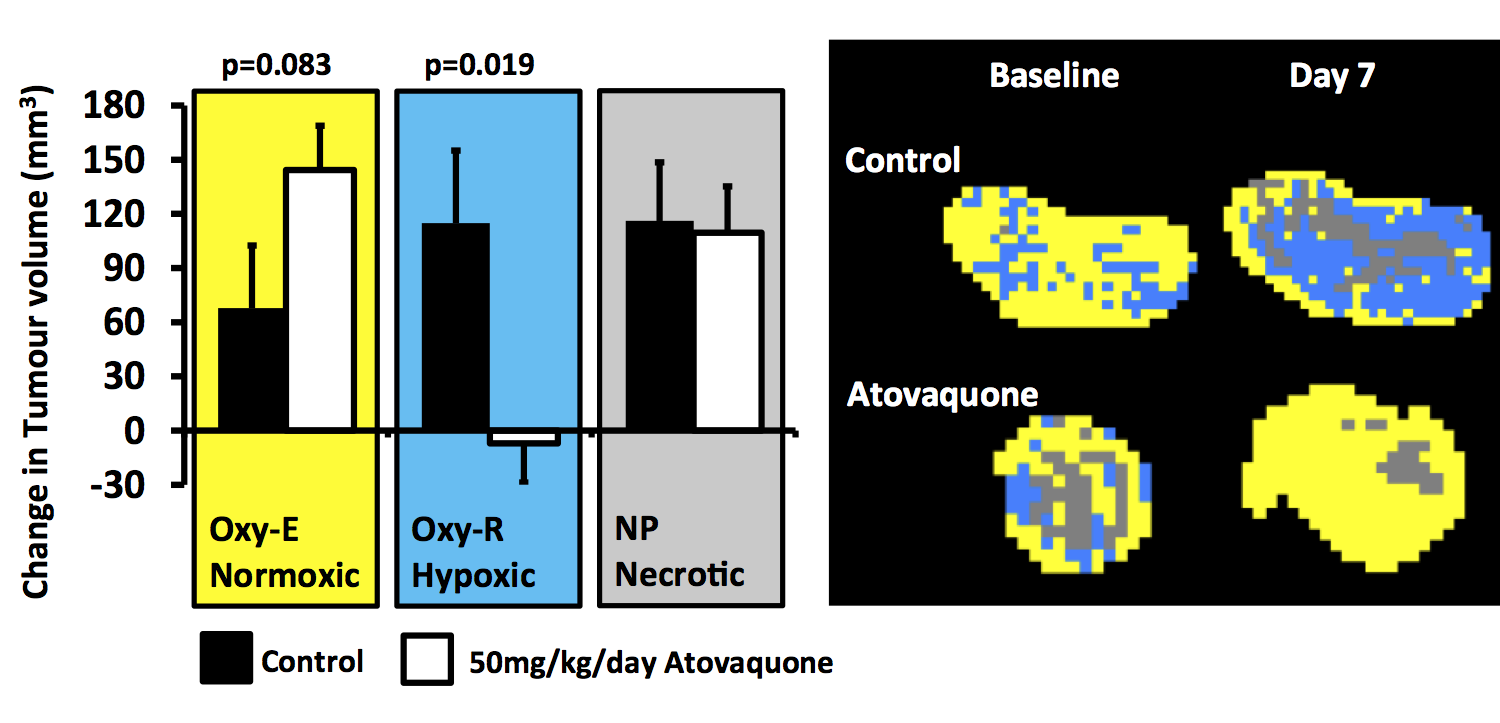
Control tumours showed increase in necrotic (non-perfused), hypoxic (Oxy-R) and normoxic (Oxy-E) tumour volumes by day 7. Atovaquone treated tumours showed relative reduction in hypoxic tumour volume (p=0.019) and a trend towards greater increase in normoxic tumour volume (p=0.083), relative to control (Figure 2).
Discussion
We have shown previously that Oxy-R identifies, quantifies and maps tumour hypoxia2. Here we report the first evidence that volume of Oxy-R can non-invasively track changes in hypoxia induced by therapies.
MRI data were consistent with the known mechanism of action of each drug. The prodrug Banoxantrone is activated in the presence of hypoxia to become cytotoxic; here we show that Oxy-R (hypoxic) volume is reduced and non-perfused (necrotic) volume is increased in treated tumours, relative to control, most likely reflecting the impact of the cytotoxic effect in the hypoxic regions. The drug Atovaquone increases oxygen availability; here we show that Oxy-R (hypoxic) volume is reduced and Oxy-E (normoxic) volume is increased in treated tumours, relative to control, most likely reflecting the conversion of hypoxic tissue into well-oxygenated tissue.
These data provide biological validation5 and support first-in-man use of combined OE-MRI/DCE-MRI biomarkers of hypoxia in clinical trials of hypoxia-modifying agents.
Acknowledgements
Support from CRUK and EPSRC Cancer Imaging Centre in Cambridge and Manchester funding to The University of Manchester (grant C8742/A18097); Cancer Research UK (CRUK) Clinician Scientist award (grant C19221/A15267) to J. P. B. O’Connor.References
1 Wilson WR et al. Targeting hypoxia in cancer therapy. Nat Rev Cancer 2011;11: 393-410.
2 O'Connor JPB et al. Oxygen-Enhanced MRI Accurately Identifies, Quantifies, and Maps Tumor Hypoxia in Preclinical Cancer Models. Cancer Res 2016;76: 787-95.
3 Williams KJ et al. In vivo activation of the hypoxia-targeted cytotoxin AQ4N in human tumor xenografts. Mol Cancer Ther 2009;8: 3266-75
4 Ashton TM et al. The anti-malarial atovaquone increases radiosensitivity by alleviating tumour hypoxia. Nature Communications 2016;7: 12308.
5 O’Connor JPB et al. Imaging Biomarker Roadmap for Cancer Studies. Nat Rev Clin Oncol 2016: doi:10.1038/nrclinonc.2016.162.
Figures