2918
Quantitative Evaluation of Treatment Response to Early Concurrent Chemoradiotherapy with Multi-parametric MRI in Esophageal Cancer1Radiology, Zhejiang cancer hospital, hangzhou, People's Republic of China, 2The second clinical medical college, Zhejiang Chinese Medical University, hangzhou, People's Republic of China, 3Life Sciences, GE Healthcare, Shanghai, People's Republic of China, 4Life Sciences, GE Healthcare, hangzhou, People's Republic of China
Synopsis
The best dose of concurrent chemoradiotherapy for esophageal cancer exists
individual difference because of tumor heterogeneity. The treatment will be
more predictable if we can assess the chemoradiotherapy earlier, which will be helpful
in early intervention for optimization of treatment plan, treatment time and improvement
of overall survival. Multi-parametric MRI is gradually used for evaluating tumor treatment, and provides earlier
and more information than conventional MRI. In this study, we used Ktrans value
(derived from DCE-MRI) and ADC value (derived from DWI) to assess treatment
response after the fifth concurrent chemoradiotherapy in esophageal cancer.
Purpose
To investigate the diagnostic value of Ktrans and ADC parameter in evaluating treatment response to early concurrent chemoradiotherapy in esophageal cancer.Introduce
Esophageal cancer is a malignant digestive tumor [1] in China. Accurate assessment on the efficacy of early chemoradiotherapy (CRT) is crucial for final treatment outcome. Early imaging assessment is helpful for optimization of treatment plan and improvement of overall survival in patients. The conventional MRI mainly relies on changes in tumor volume [2] , sometimes causing false assessment. Multi-parametric MRI is a promising tool for evaluating treatment earlier. Diffusion weighted imaging (DWI)-derived ADC (apparent diffusion coefficient) value may be associated with treatment response[3] , The Ktrans (volume transfer constant) value in dynamic contrast enhanced magnetic resonance imaging (DCE-MRI) can assess vascular permeability in tumor angiogenesis [4] .We aimed to explore the usefulness of Ktrans and ADC values in evaluating the treatment response to early CRT (after the fifth CRT) for esophageal cancer.Methods
Forty patients with pathologically confirmed esophageal squamous cell carcinoma underwent three times DCE-MRI and DWI scan in a 3.0T MR scanner (Siemens Medical Systems, Erlangen, Germany). Three serial multi-parametric MRI scans including prior-to CRT, during-treatment (after the fifth CRT) and one month after post-treatment(20 times concurrent CRT in general). The scan sequences included (i) DWI sequence using single-shot EPI, TR/TE= 10205/70ms, matrix 160 x 120, FOV 38 x 28cm, slice thickness 3mm, with b values of 0 and 800 s/mm2); (ii) DCE-MRI using VIBE sequence, with 4 flip angles of 3°, 6°, 9°and 12°, TR/TE=3.9/1.4ms, matrix 256x192, slice thickness 3mm, FOV 38 x 28cm. According to the observations from post-treatment and RECIST grading, all patients were divided into the two groups: 31 patients with good response to CRT (CR: complete response and PR: partial response) and 9 non-response patients to CRT ( PD: progressive disease and SD: stable disease). The Ktrans and ADC values in tumor areas were measured (Omni-Kinetics, GE Healthcare). The Mann-Whitney U test, ROC curve and Spearman correlation were used to statistical analysis.Results
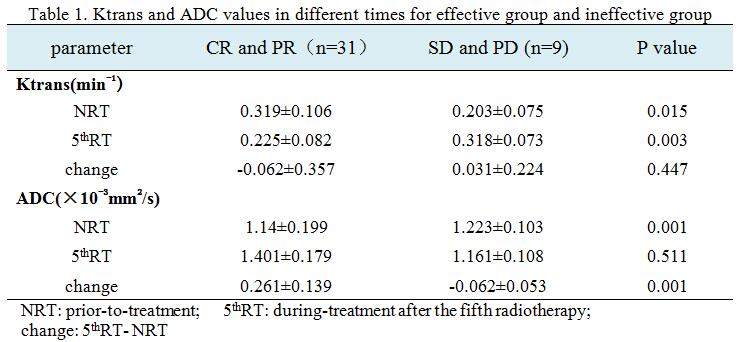
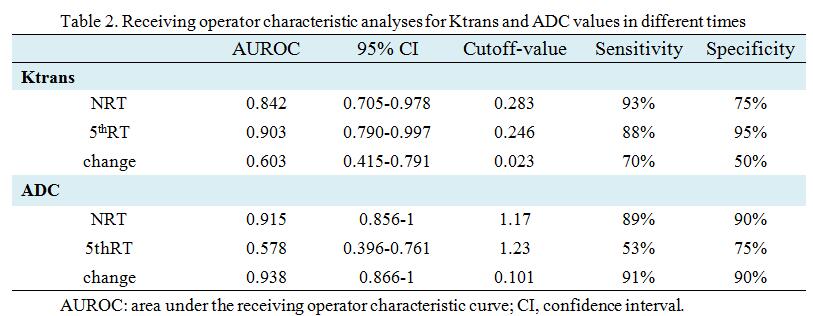
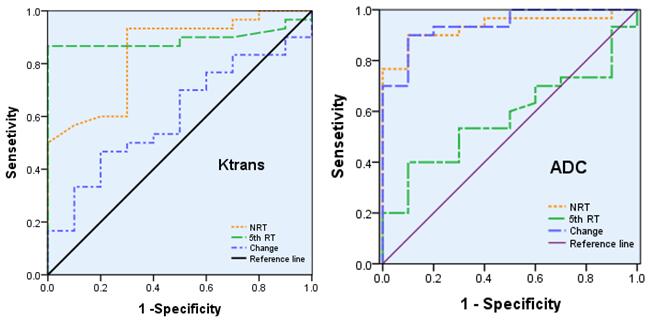
The Ktrans maps and ADC maps of a good response patient (CR) in prior-to-treatment, during-treatment and post-treatment were shown in Figure 1, and a trend of decreasing Ktrans and increasing ADC from pre- to post-treatment. Figure 2 demonstrated that pretreatment Ktrans and ADC values were (0.319±0.106)min-1 and (1.14±0.199)×10-3mm2/s in the response group, (0.203±0.075)min-1 and (1.223±0.103)×10-3mm2/s in the non-response group; Ktrans for response group in during-treatment were (0.225±0.082) min-1 while in non-response group were (0.318±0.073) min-1; The change of prior-to treatment and during-treatment in ADC was (0.261±0.139)×10-3mm2/s while in the non-response group this difference was (-0.062±0.053)×10-3mm2/s. There were significant differences between above parameters (p< 0.05). Figure 3 showed that the areas under the ROC curve of Ktrans in pretreatment, Ktrans in during-treatment, ADC in pretreatment and ADC in the change of pretreatment and during-treatment were 0.842, 0.903, 0.915 and 0.938, respectively. The diagnostic sensitivity of above parameters were 93%, 88%, 89% and 91%, respectively , the specificity were 75%, 95%, 90% and 90%, respectively and the cutoff values were 0.283 min-1 , 0.246 min-1 , 1.17×10⁻³mm2/s and 0.101×10⁻³mm2/s (Figure 4). It can be seen that Ktrans in during-treatment and ADC in pretreatment and in the change of pretreatment and during-treatment have higher performance and sensitive prediction than other parameters. In addition we found that ADC and Ktrans were negatively slightly correlated(r=-0.305, p<0.01) (Figure 5).
Conclusions
Quantitative parameters Ktrans after the fifth CRT, ADC prior-to treatment and ADC in the change of the fifth CRT and prior to treatment had higher sensitivity, specificity and diagnosis performance as a predictor for treatment response in esophageal cancer. Ktrans and ADC may become a biomarker in predicting the treatment response to early concurrent CRT for optimizing treatment plan and providing personalized therapeutic schedule.Acknowledgements
We would like to extend our sincere gratitude to Guoliang Shao for his instructive and useful guidance. Furthermore, We greatly appreciate Peipei Pang for making it possible to use their Omni-Kinetics package.References
[1] Smit JK, Faber H, Niemantsverdriet M, et al. Prediction of response to radiotherapy in the treatment of esophageal cancer using stem cell markers[J]. Radiother Oncol.2013;107(3):434-441.
[2] Bruce D.Minsky, Thomas F.Pajak, Robert J.Ginsberg, et al. INT0123 (Radiation Therapy Oncology Group 94-05) Phase III Trial of Combined-Modality Therapy for Esophageal Cancer: High-Dose Versus Standard-Dose Radiation Therapy[J]. Clin Oncol, 2002;20(5):1167-1174.
[3] Jie Chen, Jing Sheng, Wei Xing, et al. Monitoring early response of lymph node metastases to radiotherapy in animal models: diffusion-weighted imaging vs. morphological MR imaging[J]. Acta Radiologica, 2011;52(9):989-994.
[4] Cornelis G.van Niekerk, Jeroen A.W.M. van der Laak, Thomas Hambrock, et al. Correlation between dynamic contrast-enhanced MRI and quantitative histopathologic microvascular parameters in organ-confined prostate cancer[J]. Eur Radiol, 2014; 24(10): 2597-2605.
Figures