2917
Providing improved reliability of plasma volume fraction estimates for monitoring anti-angiogenic effects in liver metastases with DCE-MRI1CR-UK Cancer Imaging Centre, The Institute of Cancer Research and Royal Marsden Hospital, London, United Kingdom
Synopsis
Pharmacokinetic modelling of DCE-MRI data allows characterisation of tumour response to anti-angiogenic therapies by estimating the volume transfer constant Ktrans and the plasma volume fraction Vp. This work assesses the impact on Ktrans and Vp of treatment changes in an early clinical trial cohort by comparing 4 models: Kety, extended Kety (with two lower limits on Vp), and a new model with Vp proportional to Ktrans. When Ktrans is the endpoint of interest, use of the Kety model is sufficient to depict cohort response. If Vp is also of interest, the new model improves the significance of Vp treatment effects.
INTRODUCTION
Pharmacokinetic modelling of DCE-MRI data allows characterisation of tumour response to anti-angiogenic therapies by analysing the temporal biodistribution of a contrast agent within the imaged tumour1. In clinical trials, it is recommended2 that the primary endpoints are the volume transfer constant Ktrans and the integrated area under Gadolinium concentration curve over 60s (IAUGC60). Additional endpoints, such as the plasma volume fraction (Vp), can also be reported, but the quality of such estimates is often sub-optimal.
The extended Kety/Tofts model3,4 gives estimates of Ktrans and Vp. In practice it is often found that this model yields non-zero Ktrans estimates but with Vp=0, which is not logically consistent. We propose a new model (presented in more detail in a separate abstract5) that uses the fact that Vp=Tc/E∙Ktrans for a wide range of compartmental models (Tc=capillary transit time, E=extraction fraction). The new model assumes that Tc/E is the same for all pixels in each tumour, and an estimate of Tc/E is obtained for each DCE-MRI study using a Bayesian approach5. Here we evaluate the impact of this new model on Ktrans and Vp treatment changes compared with the standard Extended Kety model usage in a clinical trial cohort.
PATIENTS AND METHODS
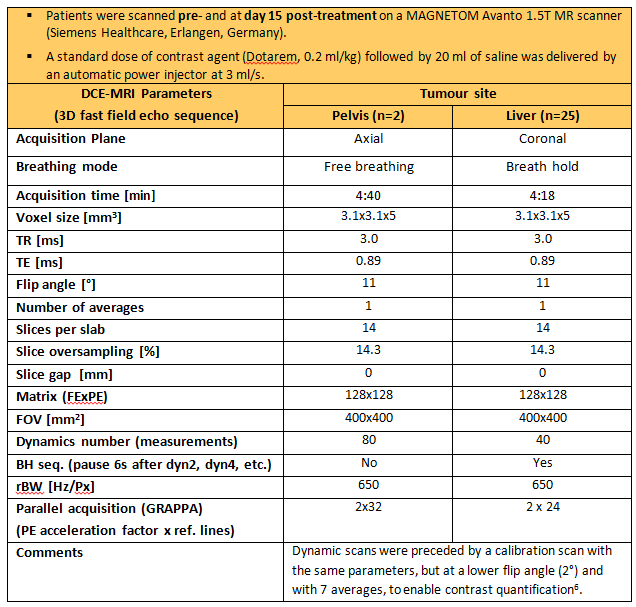
25 liver and 2 pelvic metastases from patients enrolled in a novel anti-angiogenic drug trial were scanned pre/post-treatment (Table 1; 6).
Data from liver patients were manually registered (in-plane technique) prior to any post-processing, the pelvic data were not registered. Volumes of interest (VOI) of the target lesion were drawn on all pre- and post-treatment data by a radiologist. Pixel-wise analysis was performed for each tumour using in-house software7, and median values were reported for every patient at each visit.
The pharmacokinetic analysis compared four models: NonExtKety: Kety model (Vp=0), ExtKety: extended Kety with Vp≥0, LimExtKety: extended Kety with Vp≥4×10⁻⁵, and VpPropKtrans: the proposed new model5. The limit for the LimExtKety model was the lowest non-zero median Vp from the ExtKety results from these data. A population-averaged arterial input function8,9 was used for all patients and median Ktrans, Vp and IAUGC60 were reported for each tumour.
Lilliefors test for normality (MATLAB 2016a) of all three parameters indicated that the treatment differences in Vp were not normally distributed, whereas differences of its log-transformed estimates were normally distributed; transformed and un-transformed differences of Ktrans and IAUGC60 were normally distributed. For completeness, treatment effects were therefore assessed using paired t-tests (MATLAB 2016a) on both un-transformed and log-transformed data. Pearson’s correlation coefficient was calculated to compare changes in log(Ktrans) and log(Vp).
RESULTS AND DISCUSSION
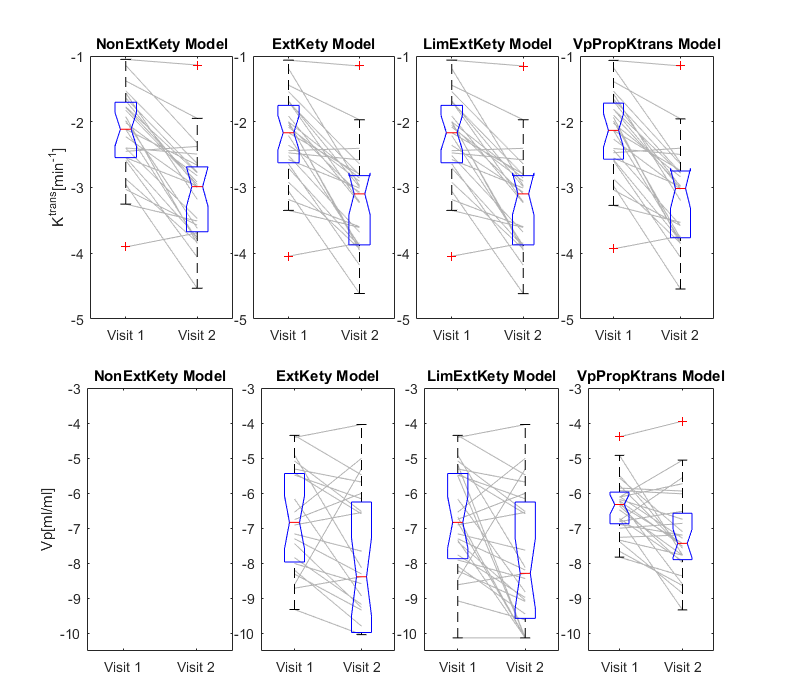
A cohort treatment response to the anti-angiogenic agent was observed for all parameters with all models, see Figure 1. Treatment response t-tests are summarised in Table 2.
When the parameters of interest are IAUGC60 and Ktrans, highly significant treatment effects were observed for log-transformed and un-transformed estimates from all models, suggesting that under these conditions the simpler NonExtKety model performs just as well as the more complicated models. The treatment significance was greater for the log-transformed estimates of IAUGC60 and Ktrans, though in these data the level of significance is sufficiently high that this difference is not important.
For Vp, however, use of the log-transform is important as the Lilliefors test indicates its use, and treatment effects are significant for all models when the log-transform is used, but are non-significant for the un-transformed data. For the ExtKety model 6/54 datasets returned median Vp values of zero, which makes use of the log-transform impossible. For this study, the 6 patients were excluded from the ExtKety statistics, but this is not an acceptable approach in general, hence the evaluation of the LimExtKety and VpPropKtrans models. The most significant Vp changes were found with VpPropKtrans (p=0.0006) compared to a non-significant effect observed with the ExtKety (p=0.0659). Although LimExtKety changes reach significance (p=0.003) and despite this model being simpler to implement, the selection of the lower limit is unacceptably ad hoc. On the other hand, the VpPropKtrans model implies an assumption that Tc/E is equal for all pixels, and so further work is needed to assess the veracity and applicability of this assumption. Vp vs. Ktrans changes had very low correlation for all models, see Table 2 (correlation for ExtKety was computed by excluding the 6 patients with Vp=0).
CONCLUSION
These results suggest that in clinical trials where only the primary DCE endpoints are of interest, use of the (non-extended) Kety model is sufficient to assess cohort response. If Vp is of interest, the proposed VpPropKtrans model improves the significance of the treatment effects observed in this trial.Acknowledgements
CRUK and EPSRC support to the Cancer Imaging Centre at ICR and RMH in association with MRC & Dept of Health C1060/A10334, C1060/A16464 and NHS funding to the NIHR Biomedical Research Centre and the Clinical Research Facility in Imaging.References
1. Leach MO, Morgan B, Tofts PS, et al., Experimental Cancer Medicine Centres Imaging Network Steering Committee. Imaging vascular function for early stage clinical trials using dynamic contrast-enhanced magnetic resonance imaging, Eur Radiol. 2012, 22(7):1451-1464.
2. Leach MO, Brindle KM, Evelhoch JL, et al., The assessment of antiangiogenic and antivascular therapies in early-stage clinical trials using magnetic resonance imaging: issues and recommendations, British J. of Cancer 2005; 92:1599 -1610.
3. Kety SS. The theory and applications of the exchange of inert gas at the lungs and tissues, Pharmacol Rev. 1951; 3(1): 1-41.
4. Tofts PS. Modeling tracer kinetics in dynamic Gd-DTPA MR imaging, J Magn Reson Imaging 1997; 7(1): 91-101.
5. Orton MR, Rata M, Collins D, et al., Utilizing correlations between Ktrans and plasma volume fraction estimates improves Extended Kety modelling of DCE-MRI data, submission ISMRM 2017.
6. Fram EK, Herfkens RJ, Johnson GA, et al., Rapid calculation of T1 using variable flip angle gradient refocused imaging, Magn Reson Imaging, 1987; 5(3): 201-208.
7. D`arcy JA, Collins DJ, Padhani AR, et al., Informatics in Radiology (infoRAD): Magnetic Resonance Imaging Workbench: analysis and visualization of dynamic contrast-enhanced MR imaging data, Radiographics. 2006; 26(2): 621-32.
8. Orton MR, d’Arcy JA, Walker-Samuel S, et al., Computationally efficient vascular input function models for quantitative kinetic modelling using DCE-MRI, Phys Med Biol 2008; 53(5): 1225-1239.
9. Parker GJ, Roberts C, Macdonald A, et al., Experimentally-derived functional forms for a population-averaged high-temporal-resolution arterial input function for dynamic contrast-enhanced MRI, Magn Reson Med 2006; 56(5): 993-1000.
Figures