2916
Ultra-early ADC (apparent diffusion coefficient) footprint successfully detects tumor irradiation and predicts radiotherapy outcome1Radiotherapy Research Unit, Department of Oncology, University of Copenhagen, Herlev and Gentofte Hospital, Herlev, Denmark, 2Department of Radiology, University of Copenhagen, Herlev and Gentofte Hospital, Herlev, Denmark
Synopsis
If ultra-early stratification of radiotherapy response was possible it could potentially reduce unnecessary irradiation of normal tissue and improve disease management. In this study repeated diffusion weighted magnetic resonance imaging was conducted along with fractionated radiotherapy in brain metastases patients. It was found that the decrease in the apparent diffusion coefficient (ADC) observed 24 hours after the first radiotherapy fraction may be an indicator of irradiation. Responding patients versus non-responding patients could be differentiated by their corresponding change in ADC seen 48 hours after start of radiotherapy. These findings may have great impact for the emerging hybrid MR – linear-accelerator systems.
INTRODUCTION
Tumor response after radiotherapy (RT) is generally seen as a change in gross tumor volume manifesting months later. If early patient specific prognoses were possible it could identify responding and non-responding patients, and potentially reduce unnecessary irradiation of normal tissue and improve disease management. In this study the temporal evolution of the apparent diffusion coefficient (ADC) was investigated using repeated diffusion weighted magnetic resonance imaging (DW-MRI) in brain metastases patients treated with fractionated RT. Specifically, the ADC change immediately (within 1 hour) after irradiation, and semi-immediately (within 48 hours) after irradiation, was investigated. The aim was to see if ultra-early ADC changes have the potential for identification of irradiated tissue and stratification of treatment response.METHODS
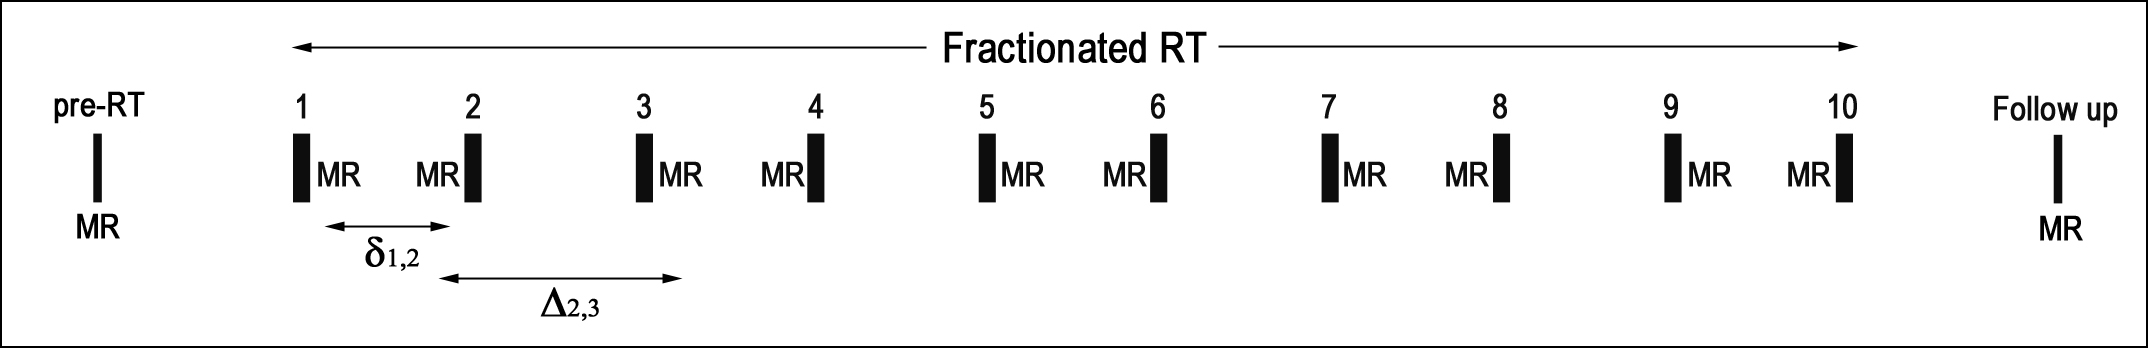
In this prospective study 30 patients with brain metastases were included. All patients were scheduled for palliative intent RT with a total dose of 30 Gy in ten fractions (five fractions/week), delivered as whole brain photon irradiation. After exclusion of non-eligible metastases twenty-nine metastases (N=29) from twenty-one patients were analyzed. Scanning was performed with a 1 T MRI system to acquire DW-, T2*W-, T2W- and contrast enhanced T1W scan, before start of RT (pre-RT) and at follow-up two to three months after RT. Additionally, DW-, T2*W-, T2W- scans were acquired within 1 hour before or 1 hour after each RT fraction according to fixed scheme (fig. 1). The tumor regions were outlined using b=800 s/mm2 images and the ADC was estimated using high b-values (b=400, 500, 600, 800 s/mm2) in a mono-exponential model. Treatment response evaluation was volume based using T1W scans and numerical thresholds from RECIST (version 1.1). Paired t-test with Bonferroni correction was used to test for inter-fraction ADC change. The area under the receiver operatic characteristic curve (AUC) was calculated using the statistical toolbox in Matlab.RESULTS
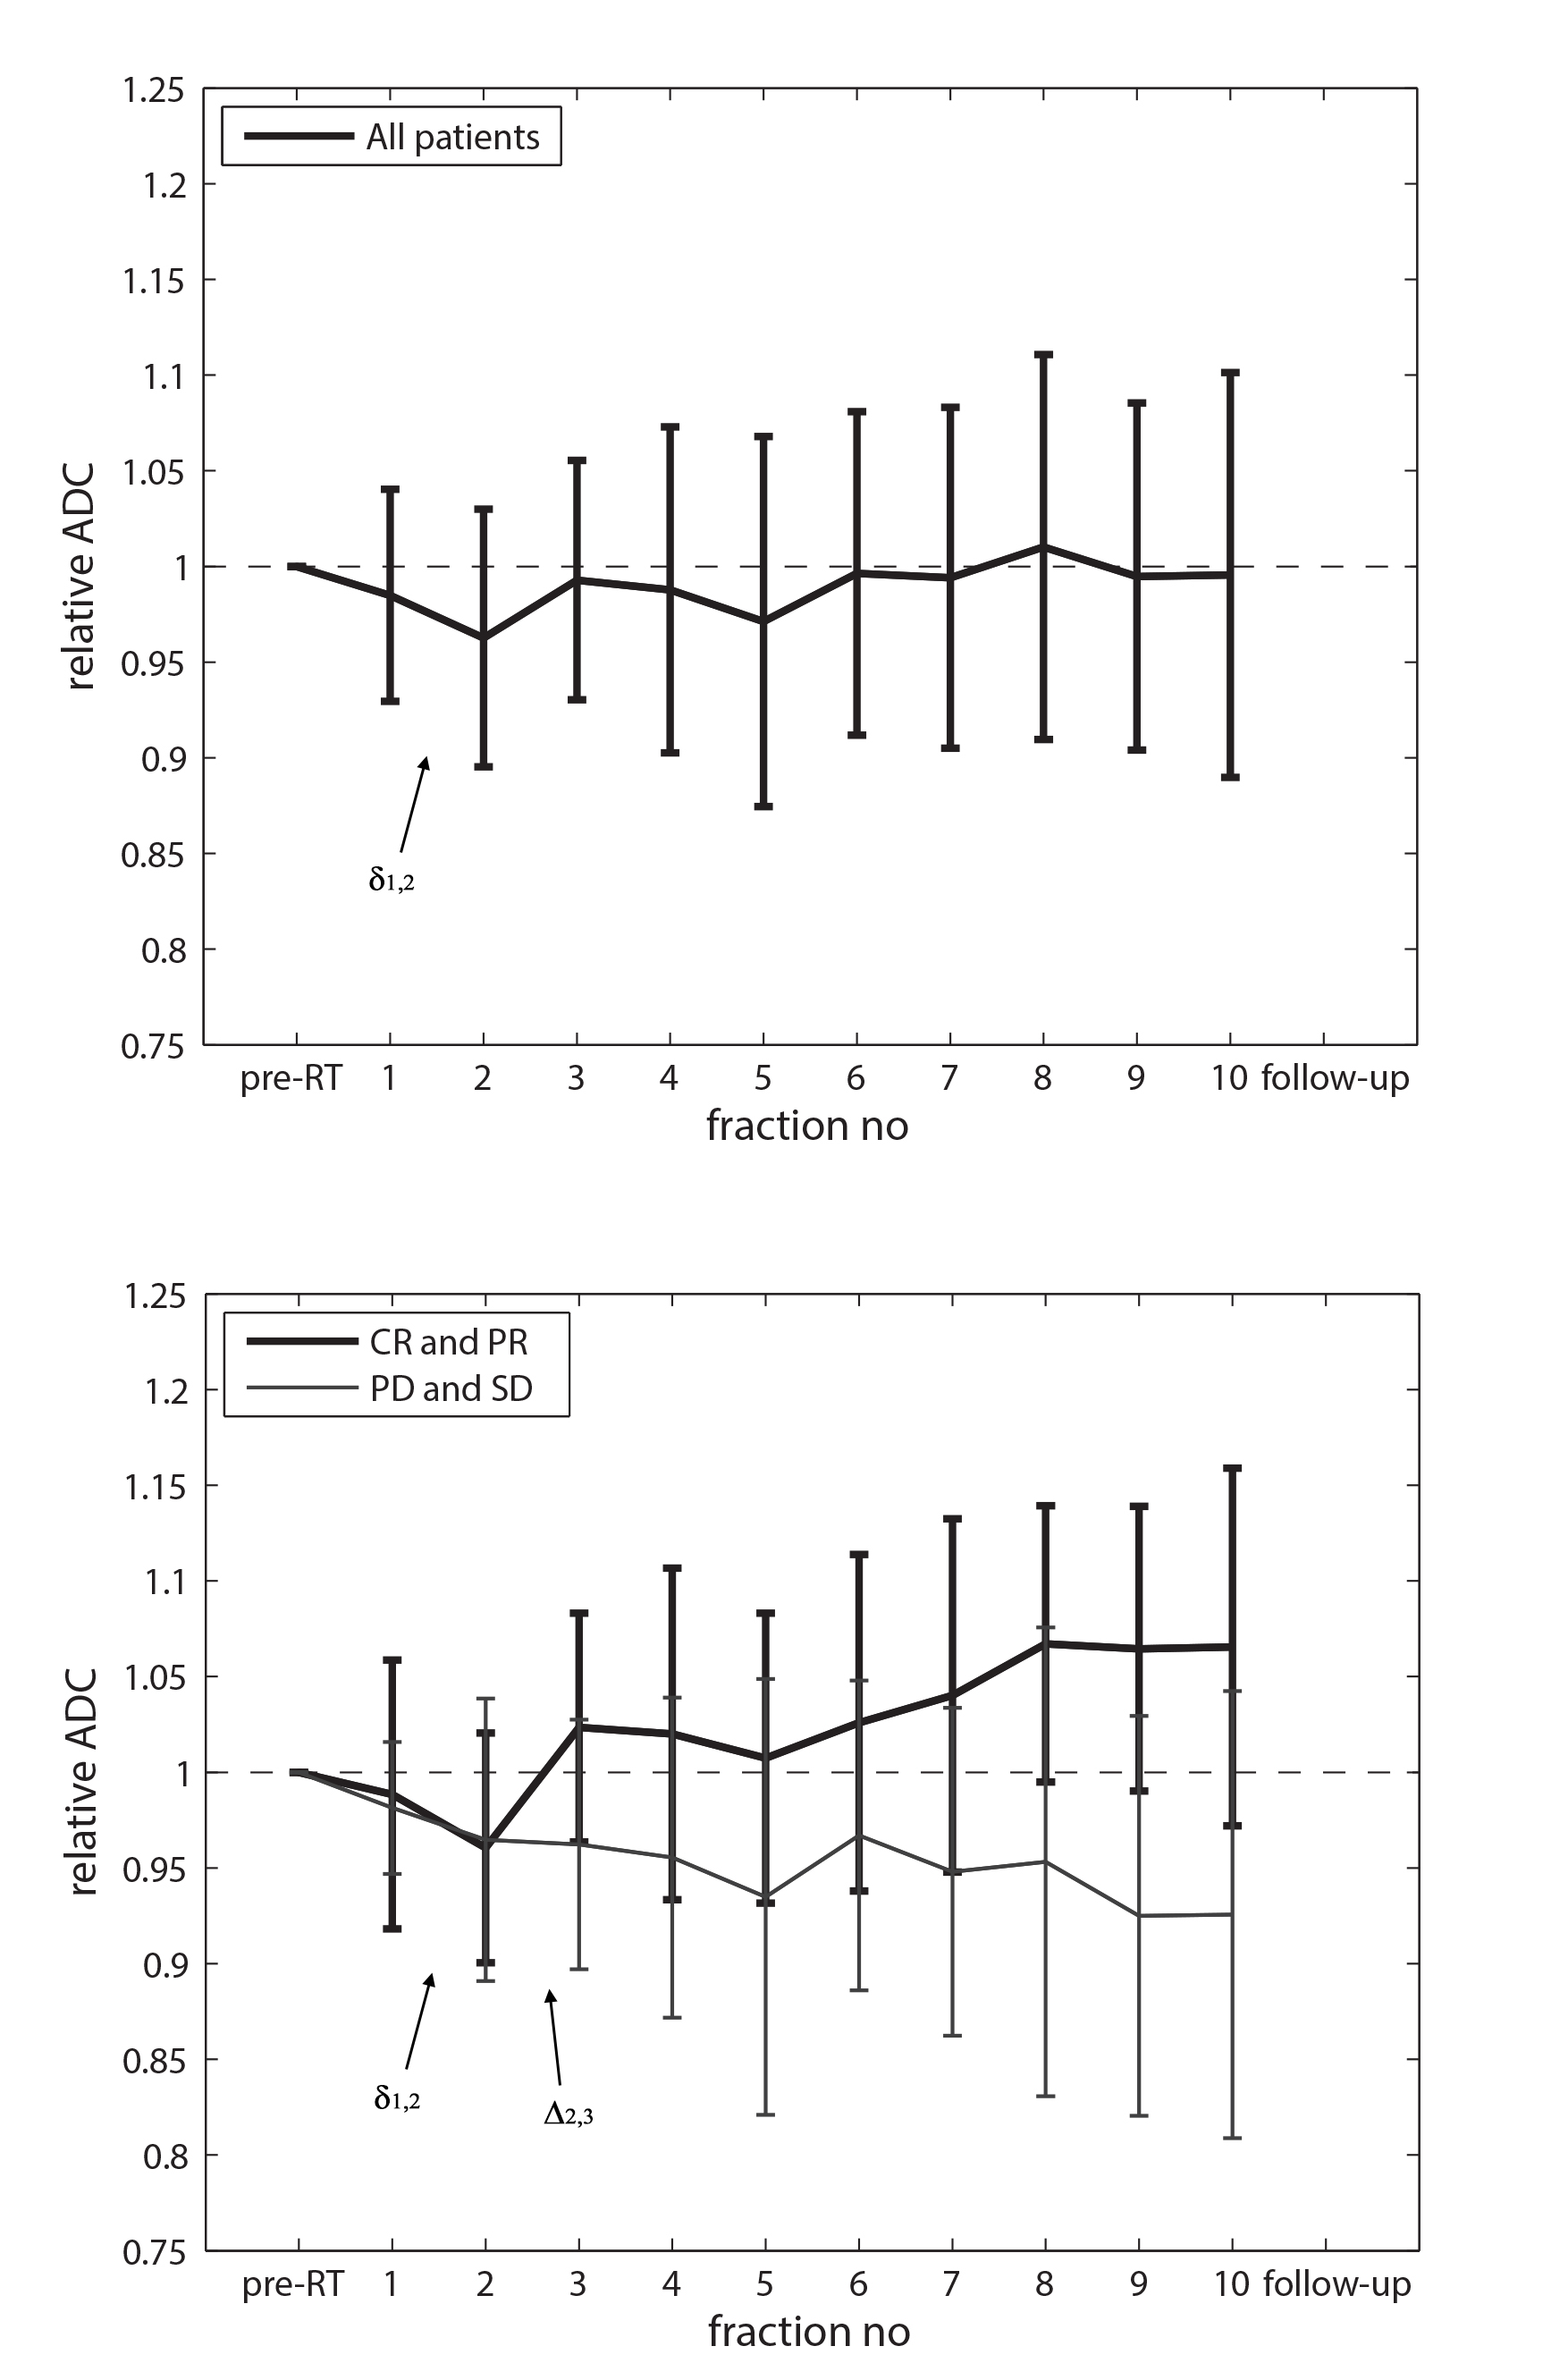
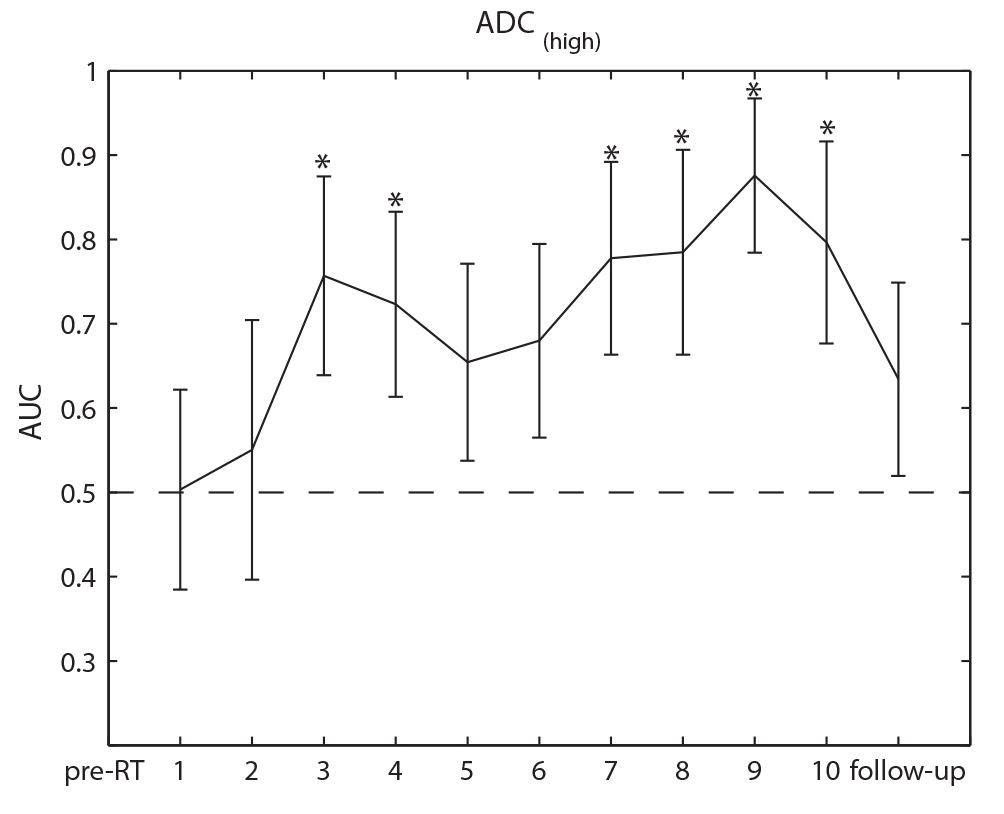
The average ADC when all patients are pooled is nearly unchanged from baseline (fig. 2). A closer examination shows that ADC change (decrease) δ1,2 is significant both when patients are pooled (p<0.00036), and when grouped as responders (p<0.0066) (complete response and partial response) and non-responders (p<0,03) (stable disease and progressive disease). This is followed by a significant ADC change (increase) Δ2,3 in responders (p<0,0011) whereas no change is seen in non-responders (p<0.7) (fig. 2). Beyond fraction 3, no significant inter-fraction change in ADC was observed. Also no significant ADC change is seen immediately (within 1 hour) after fraction 1. Overall, an almost monotonous increase in ADC in responding patients, and decrease in non-responding patients is seen (fig. 2). The very early ability of stratification of treatment response (between fraction 2 and 3), and later (from fraction 7) corresponds with significant AUC increase at these time points (fig. 3).DISCUSSION
Our results show that the ADC decrease seen about 24 hours after the first fraction (3 Gy) of RT is indicative of irradiation of brain metastases. The ADC decrease may indicate cell swelling (cytotoxic edema) a radiation induced cellular reaction proposed earlier1. We did not see this effect within 1 hour after irradiation which may indicate a biological lag time and/or not sufficient signal-to-noise ratio. In responding patients this cellular state evolves into apoptosis and necrosis/lysis resulting in a reduction in cellularity and increase of ADC consistent with our results. The increase in ADC seen about 48 hours after the start of the RT course is consistent with the sharp increase in the AUC. The results of this study potentially have a two-fold application in future image-guided radiation therapy, applying especially to the emerging MR-Linac (hybrid MR system - linear accelerator). First of all it may be possible to verify tumor coverage between fractions, and secondly, to perform early treatment adaptation in non-responding patients2. Due to differences in tumor histology and phenotype the results of this study cannot be applied generally in the clinic or in clinical studies, but it can serve as qualified help in designing future studies.CONCLUSION
The results indicate that the decrease in ADC measured 24 hours after the first fraction of RT is an effective biomarker for irradiated tissue (metastases). Further, in responding patients this decrease is followed by an increase in ADC during the next 24 hours. In non-responding patients no increase was seen. This differentiated ADC response was shown to have significant predictive capacity for treatment outcome.Acknowledgements
We thank the radiographers at the Division of Radiotherapy, Herlev Hospital, especially Annette Kahlen, for skillful assistance with the MRI scans. This work was partially funded by Forskningsraadet at Herlev Hospital.References
1. Moffat BA, Chenevert TL, Lawrence TS, et al. Functional diffusion map: a noninvasive MRI biomarker for early stratification of clinical brain tumor response. Proc Natl Acad Sci U S A. 2005;102(15):5524-5529. doi:10.1073/pnas.0501532102.
2. Kerkmeijer LGW, Fuller CD, Verkooijen HM, et al. The MRI-Linear Accelerator Consortium: Evidence-Based Clinical Introduction of an Innovation in Radiation Oncology Connecting Researchers, Methodology, Data Collection, Quality Assurance, and Technical Development. Front Oncol. 2016;6:215. doi:10.3389/fonc.2016.00215.
Figures