2912
Label-free CEST MRI detection of albumin and albumin-based nanoparticles1F.M. Kirby Research Center for Functional Brain Imaging, Kennedy Krieger Institute, Baltimore, MD, United States, 2Department of Radiology, Johns Hopkins University School of Medicine, Baltimore, MD, United States, 3Department of Radiology, Guangzhou Panyu Central Hospital, 4Ludwig Center, Howard Hughes Medical Institute and Sidney Kimmel Cancer Center, Johns Hopkins University School of Medicine, Baltimore, MD, United States
Synopsis
Albumin is emerging as one of the most attractive drug carriers for the targeted delivery of therapeutic peptides and drugs. Herein, we developed a label-free MRI approach for monitoring albumin-based drug delivery systems by directly utilizing the inherent CEST signal of albumin. Our in vitro study showed that both human serum albumin (HSA) and albumin-based nanoparticle Nab-paclitaxel (Abraxane) could generate a strong CEST signal at ~2 ppm. Using this inherent CEST signal, we successfully demonstrated the label-free CEST MRI detection of the tumor uptake and distribution HSA and Nab-paclitaxel in a xenograft mouse model.
PURPOSE
To develop a label-free CEST MRI approach for the detection of albumin and albumin-based nanoparticles. Because no chemical labeling is needed, this new approach will be easily incorporated in the application of albumin-based drug delivery systems as an imaging companion for the early prediction of treatment responses based on their delivery efficiency.
METHODS
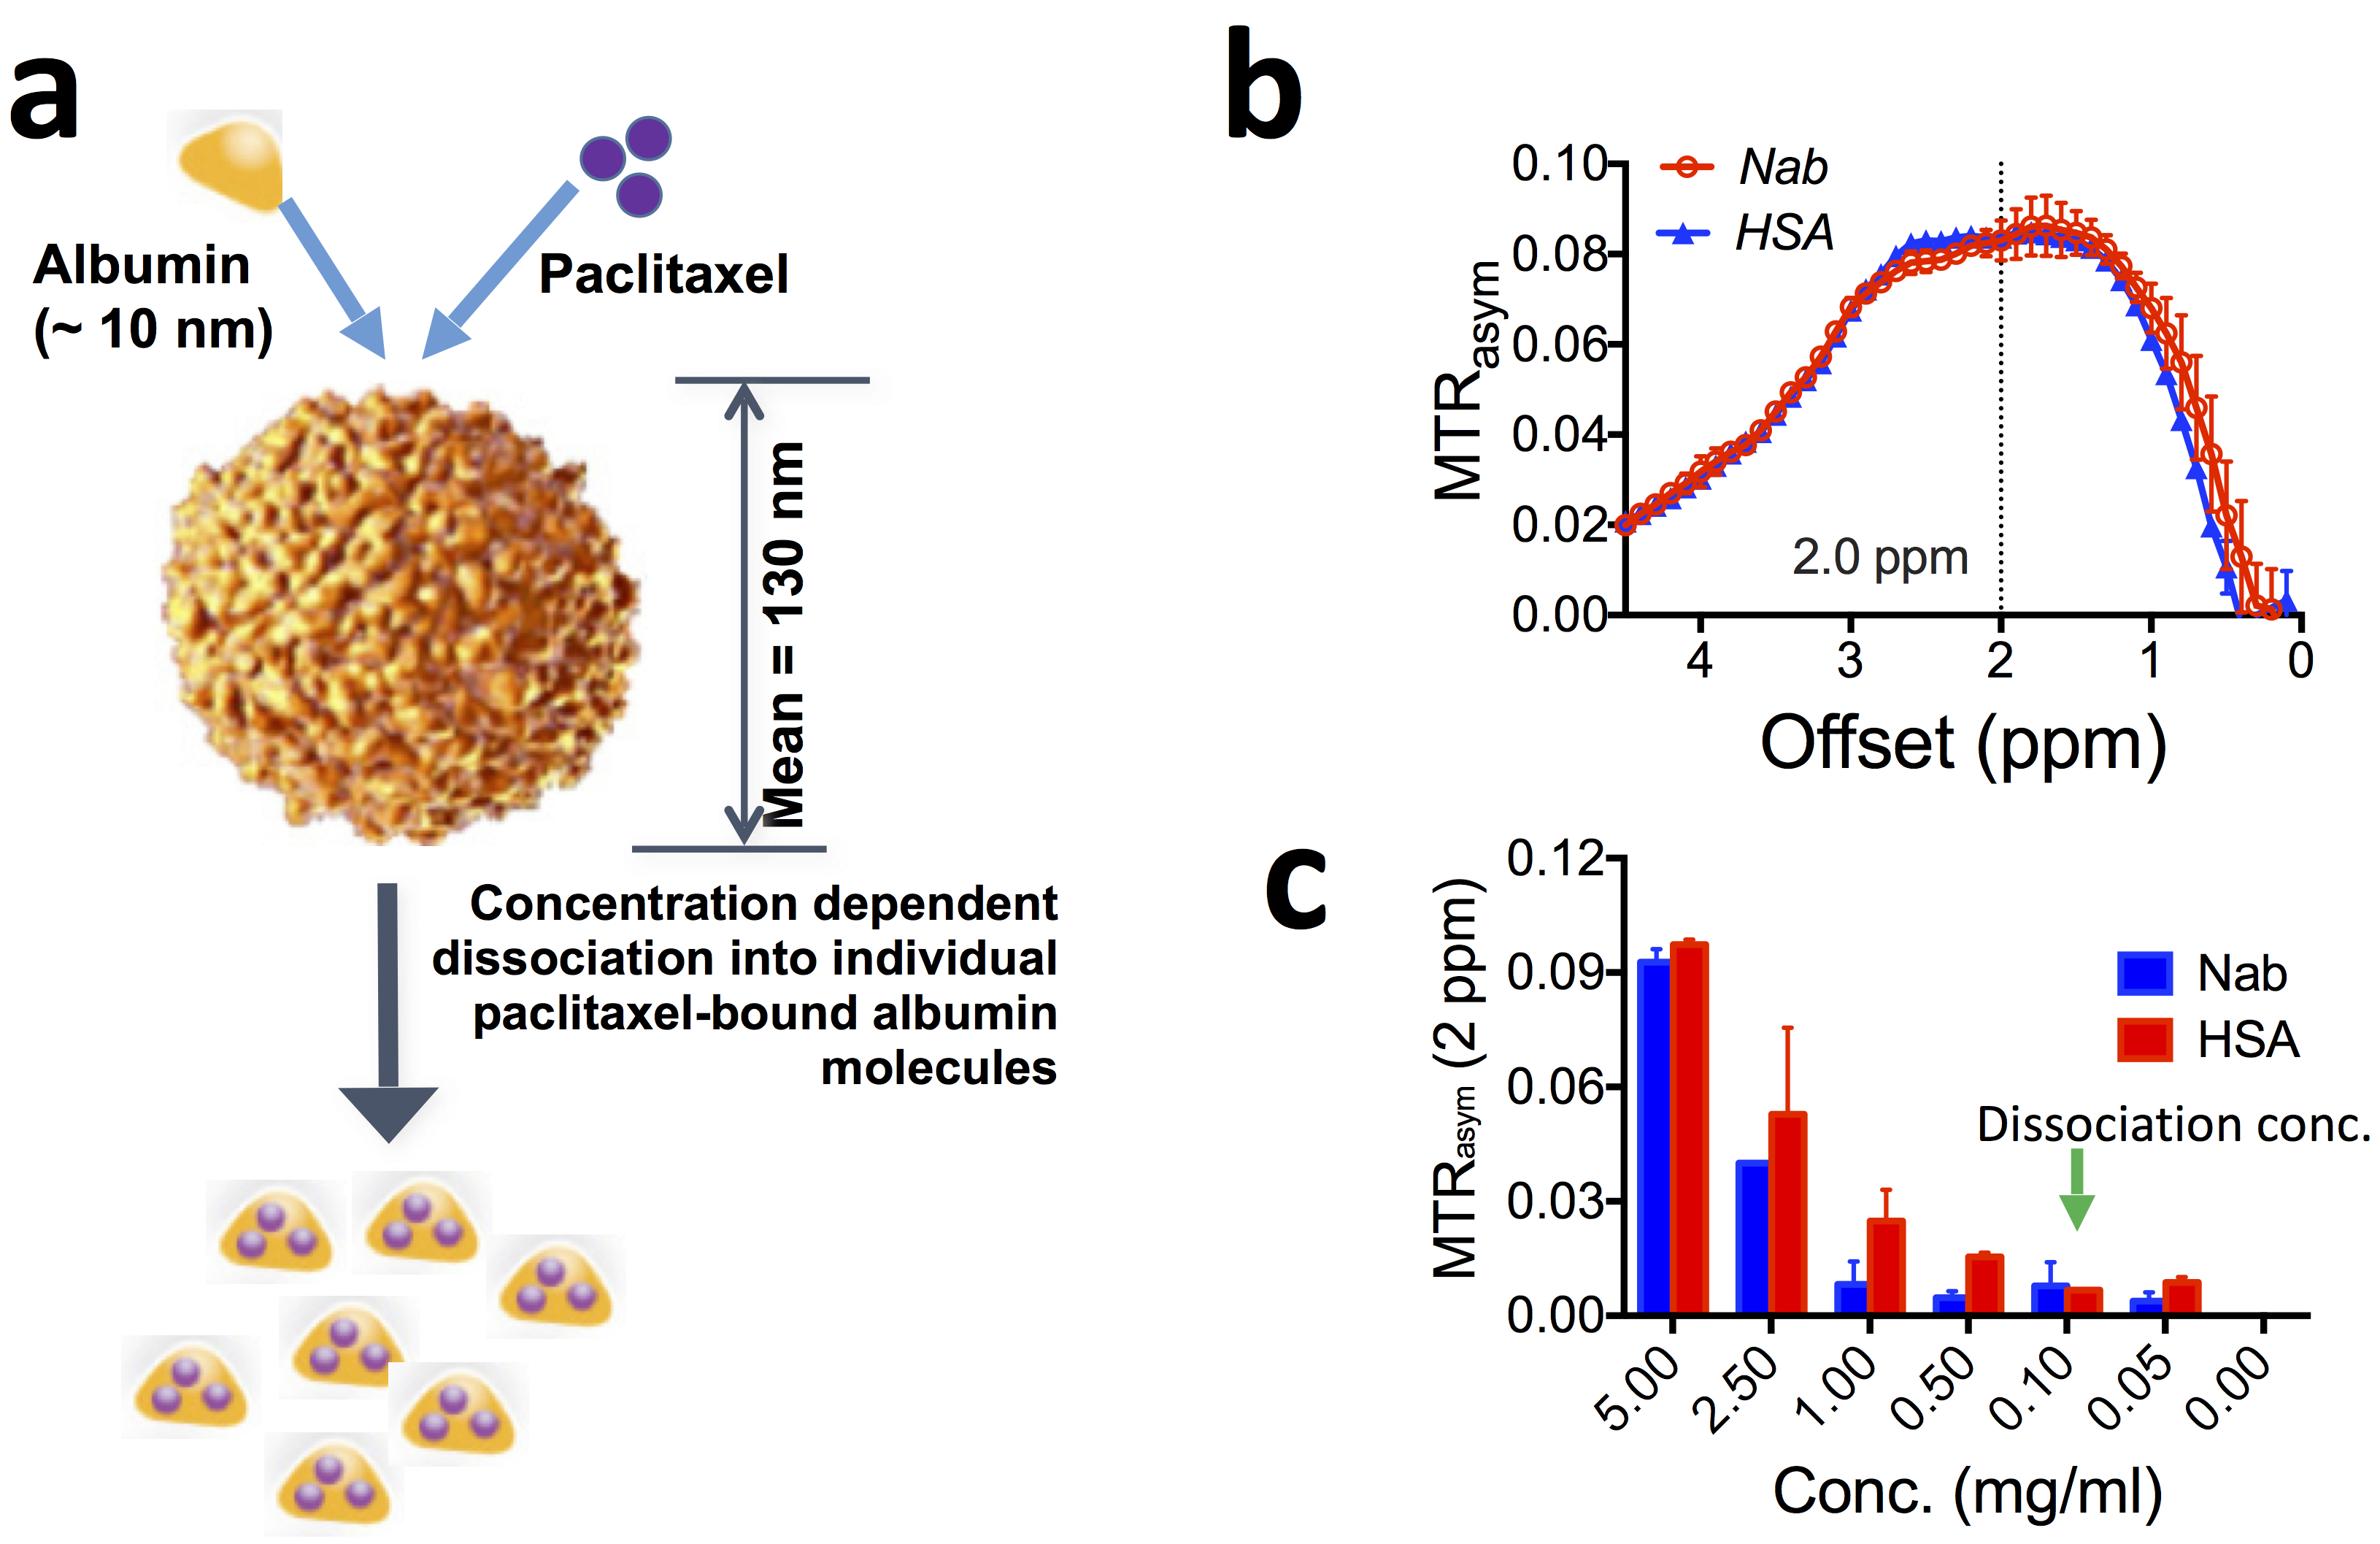
Human serum albumin (HSA, MW=66.5 kD) and nab-paclitaxel (Nab, Fig.1a) were prepared at a concentration of 0.05 to 5 mg/ml (1 mg/ml = 25 µM per albumin molecule) in PBS buffer (pH=7.4) and assessed for their CEST contrast using a vertical bore Bruker 11.7 T MRI scanner equipped with a 15 mm volume coil as described previously.1 In vivo MR studies were carried out on a Biospec11.7 T horizontal MRI scanner equipped with a 23 mm mouse brain volume coil. MR images were acquired to monitor the changes in CEST contrast upon i.v. injection of HSA or Nab (100 µL, 125 mg/kg) into Balb/c mice bearing CT26 colon tumors in the flank (~350 mm3, 14 days after the implantation of 5x10⁶ CT26 cells). A fat-suppressed RARE sequence (TR/TE=5000/4 ms, RARE factor=10) was used, with a continuous wave pre-saturation pulse (B1=3.6 µT and 3 seconds) swept from -4 to 4 ppm (step=0.2 ppm)2. Each acquisition took ~28 minutes. After CEST acquisition, contrast-enhanced images were acquired using a T1-w spin echo sequence (TR/TE=500/10 ms) before and 15 minutes after i.v. injection of Gd-DTPA (0.5 mmol/kg; 50 µL bolus over about 3 s). The changes were quantified by ∆MTRasym= MTRasym (post)- MTRasym (pre).RESULTS
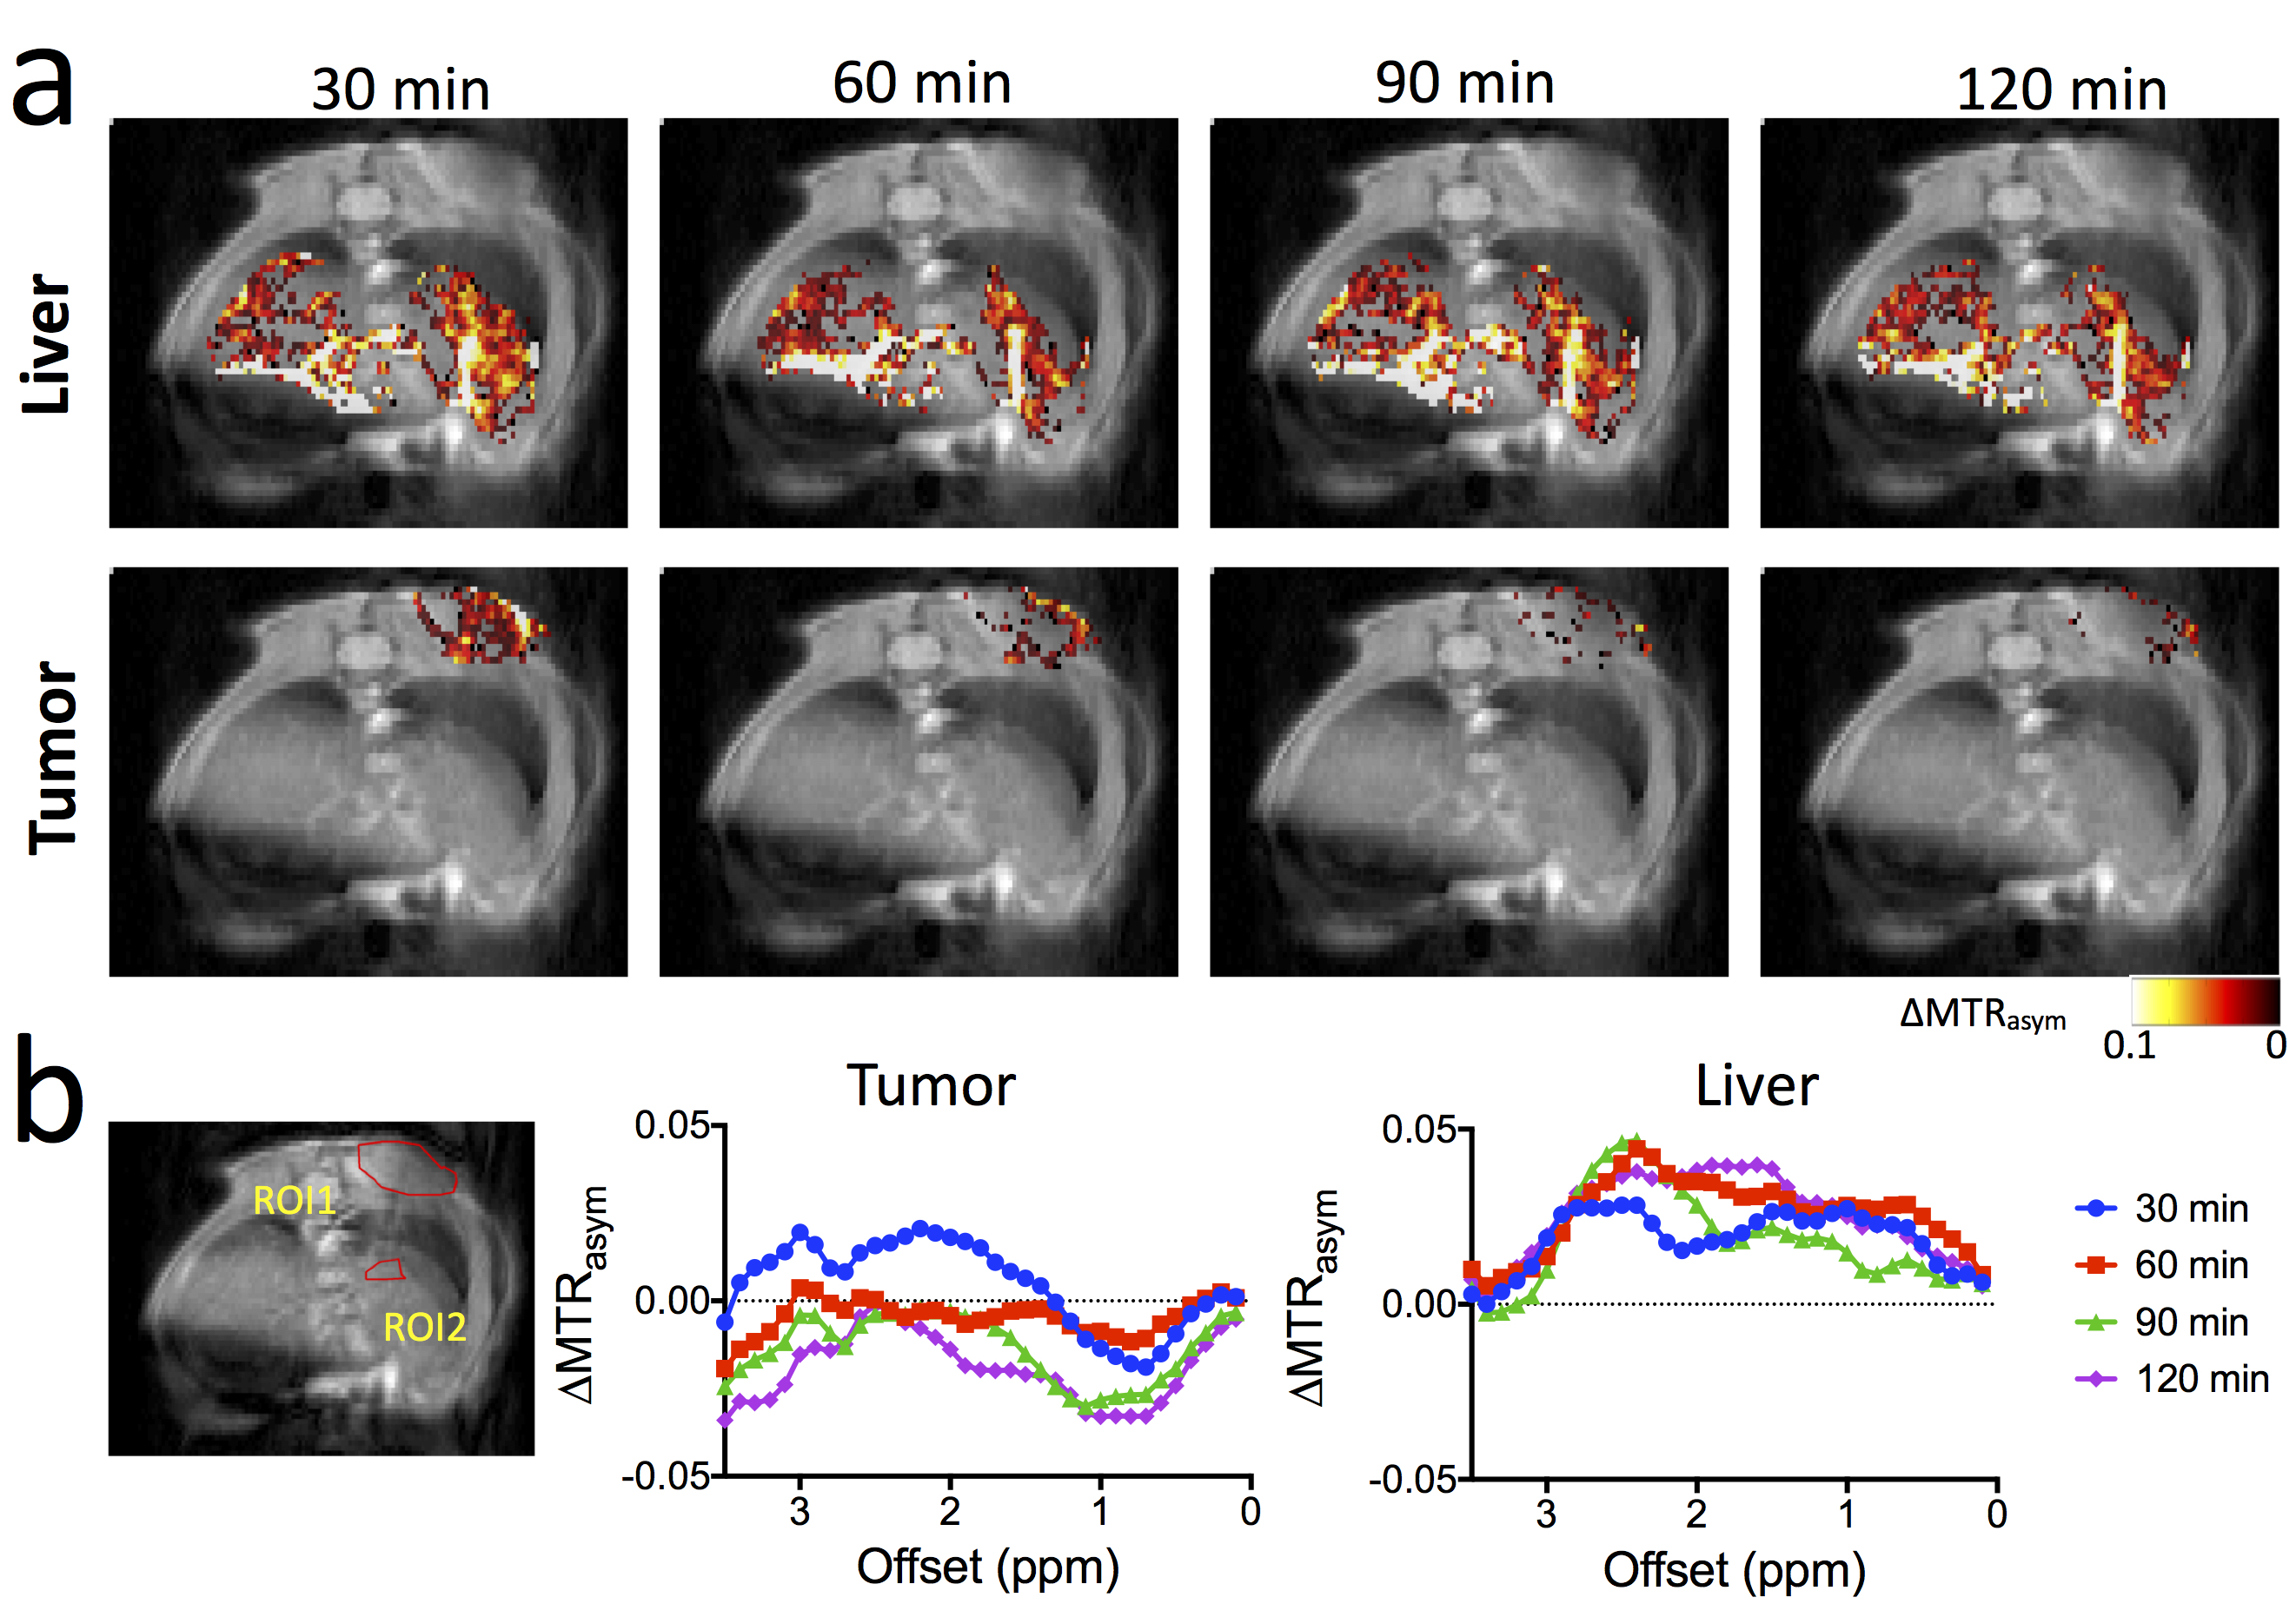
Our in vitro results (Fig. 1b) showed that the albumin has a broad CEST signal resonant at 1.5-4 ppm with the peak around 2.0 ppm (pH 7.4), in good agreement with recent studies of the CEST signal of BSA at 3T, 7T, and 11.7 T3,4. While the CEST signal (quantified by MTRasym) of free albumin was preserved in Nab, Nab has an MRI detectability significantly lower than that of HSA at the concentration range above the dissociation concentration (~0.1 mg/ml), likely attributed to the partially restricted water accessibility of albumin exchangeable protons after formation of nanoparticle. We then tested the feasibility of using CEST MRI to detect the tumor uptake of injected HSA and Nab. As shown in Fig. 2, CEST MRI was able to detect the accumulation of albumin in CT26 colon tumors. The distribution of both HSA and Nab revealed by CEST MRI (Fig.2c) were similar to the contrast-enhanced areas shown in Fig. 2b. The ∆MTRasym plots shown in Fig. 2d confirmed the increase in CEST signal around 2 ppm after the injection of HSA or Nab. We also performed studies to monitor the dynamic change in CEST signal in the tumor and liver (Fig. 3). While the CEST signal in the tumor decreased markedly after 30 minutes, that in the liver continued to increase and reached its maximum at 60 minutes post-injection. The same trend can be observed in the ∆MTRasym plots of the tumor ROI and a representative ROI in the liver at different time points after the injection of Nab.DISCUSSION
Albumin and albumin-based nanoparticles can be transported through tumor endothelium because of the high binding affinity to gp60 (Ki ~ nM) and accumulated in the tumor facilitated by SPARC (Secreted Protein, Acidic and Rich in Cysteine). While the success of Nab has inspired enormous studies of new albumin-based drug delivery systems, the only clinical biomarker for predicting the efficacy of Nab is the immnunohistochemical assessment of SPARC expression. A non-invasive imaging tool that can quantify the tumor uptake of albumin will be invaluable for the pre-clinical development and clinical application of albumin-based therapeutics. Our new label-free imaging approach could be translated to the clinic easily, and will be ultimately useful for monitoring the delivery efficiency of albumin-based drug delivery systems in a personalized manner.Conclusion
To the best of our knowledge, this is the first demonstration of the utilization of the inherent albumin-CEST MRI signal for monitoring albumin-based drug delivery systems. Using this approach, we successfully detected both unlabeled HSA and a clinical albumin-based nano-chemotherapeutic agent Nab in tumor-bearing mice at a clinically relevant dose. The dynamics of liver and tumor uptake of Nab were detected by CEST MRI, which allows the real-time monitoring of the drug delivery of albumin-based nanoparticles and early prediction of treatment response based on their delivery efficiency.Acknowledgements
R21EB015609, R03EB021573, R01EB019934, and R01EB015032.References
(1) Liu, G., et al. Contrast Media Mol. Imaging 2010, 5, 162-70.
(2) Chan, K. W., et al. Magn. Reson. Med. 2012, 68, 1764-73.
(3) Lee, J. S., et al. Contrast Media Mol. Imaging 2016, 11, 4-14.
(4) Xu, J., et al. Magn. Reson. Med. 2016, 10.1002/mrm.26165.
Figures