2911
ADC and D from diffusion-weighted MRI correlate with histopathological assessment of nuclear-to-stromal ratio, and histology confirms Dixon fat fraction in retroperitoneal sarcomas1Cancer Research UK Cancer Imaging Centre, The Institute of Cancer Research, London, United Kingdom, 2MRI Unit, The Royal Marsden NHS Foundation Trust, Sutton, United Kingdom, 3Department of Histopathology, The Royal Marsden NHS Foundation Trust, London, United Kingdom, 4Department of Radiotherapy, The Royal Marsden NHS Foundation Trust, London, United Kingdom, 5Department of Surgery, The Royal Marsden NHS Foundation Trust, London, United Kingdom
Synopsis
Soft-tissue sarcomas are often highly heterogeneous tumours. Clinical trials of non-surgical treatments, for example combined radiotherapy and systemic agents, require non-invasive methods for response assessment. Quantitative MRI provides non-invasive response assessment of the whole tumour volume, but metrics require validation against histopathology. In this study, 26 patients with retroperitoneal sarcoma were imaged prior to surgery, with written consent, as part of a prospective single-centre study. Diffusion-weighted MRI parameters (ADC, and D from IVIM) showed correlation with nuclear-to-stromal ratio, and were also related to stroma type and stroma grade. Dixon-derived fat fraction correlated strongly with histopathological assessment of fat fraction.
Background
Soft-tissue sarcomas are often highly heterogeneous tumours with variable components, which can include cellular tumour, fat, necrosis, and cystic change. Functional imaging provides non-invasive assessment of the whole tumour volume, and may enable identification of highly cellular or vascular regions, e.g. to identify regions for dose-escalation in radiotherapy1 or for response assessment in non-surgical treatments.2,3 However, validation of the relationship between quantitative MRI parameters and histopathology is required to underpin use of functional imaging in treatment planning and response assessment.Purpose
To investigate relationships between quantitative MRI parameters and histopathology in retroperitoneal sarcomas: (i)apparent diffusion coefficient (ADC, from diffusion-weighted-MRI [DW-MRI]) and D (diffusion coefficient from intra-voxel incoherent motion [IVIM] model of DW-MRI) versus histopathological assessment of nuclear-to-stromal ratio, stroma type, and stroma grade; (ii)fat fraction estimated from Dixon MRI versus histopathological assessment of fat fraction; (iii)f and fD* from IVIM, R2*, and enhancing fraction (EF) versus histopathological assessment of vessel density.
Methods
Patients: 50 regions of interest (ROIs) from 26 patients (20 liposarcomas, 4 leiomyosarcomas, 1 spindle cell sarcoma, 1 lipoma) were included as part of a prospective single-centre study, with permission from ethics committee and written consent. Patients had an MRI examination before surgical removal of their tumour. 10 patients (6 liposarcomas, 3 leiomyosarcomas, 1 spindle-cell sarcoma) received radiotherapy before imaging and surgery; 16 patients were treated with surgery alone.
Imaging: Images were acquired using a 1.5T MR scanner (Aera, Siemens). Diffusion-weighted images with 3 b-values (50,600,900smm-2) were used to estimate ADC; an additional DW-MRI series (0,25,50,80,150,300,500,800smm-2) was used for estimation of IVIM parameters; Dixon-derived fat/water images were used to estimate fat fraction; multiple gradient-echo images (TE=5,10,30,45,55ms) were used to estimate R2*; and pre- and post-contrast T1-w images (17° FLASH) to estimate EF.
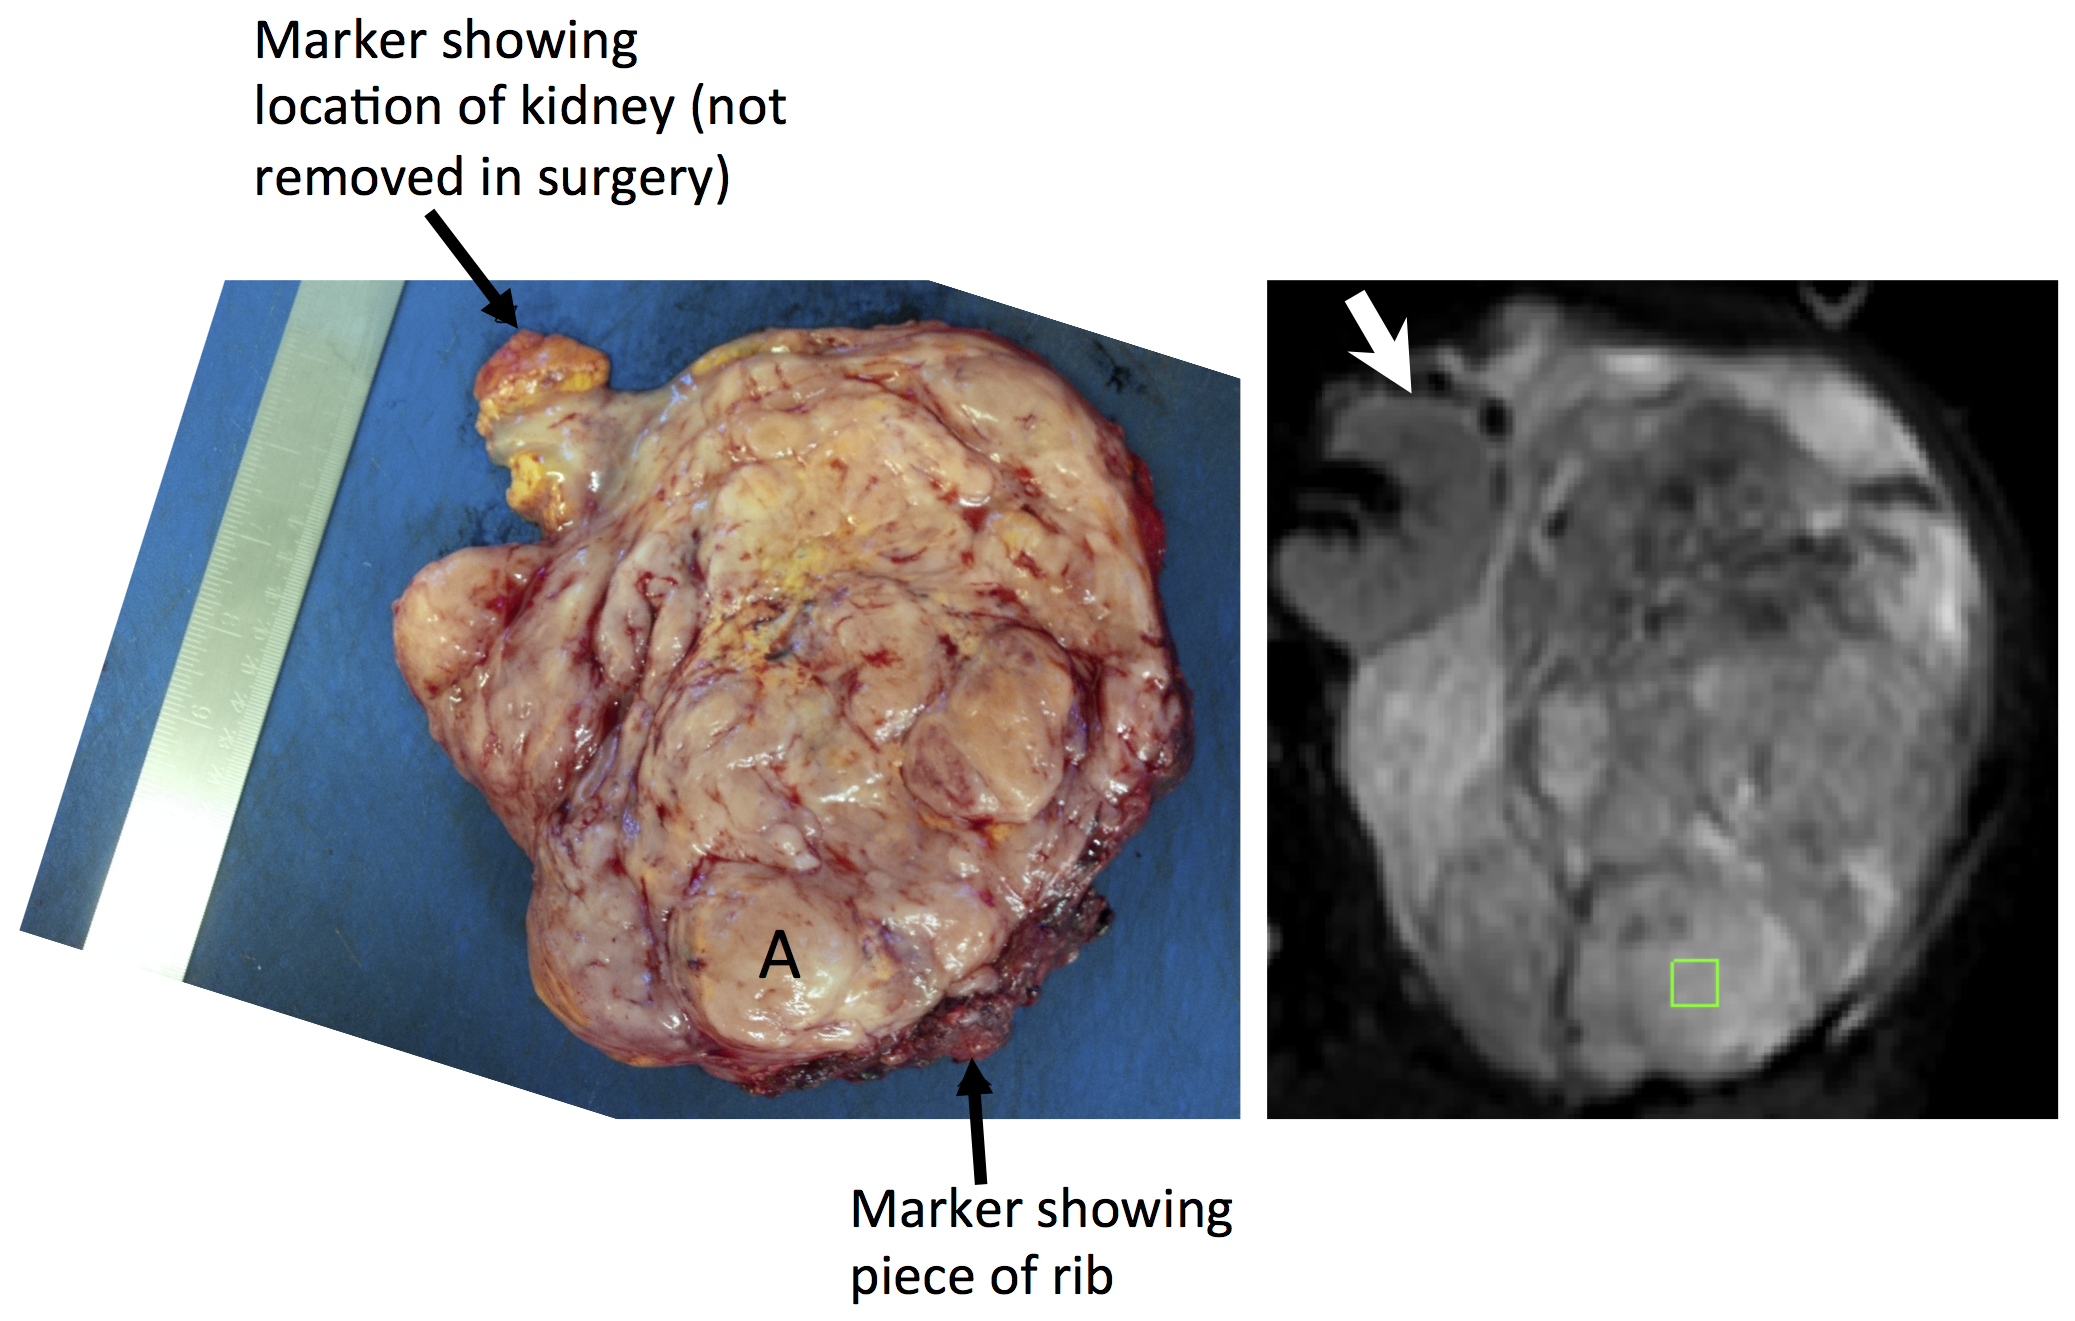
Histopathology: A representative axial slice of the tumour was selected by a consultant radiologist using pre-operative T2-w images. Following surgery, the surgeon aligned and marked the tumour for sectioning by a histopathologist. ROIs (~1cm2) were selected jointly by the radiologist and histopathologist to ensure correlation, and positioned using anatomical landmarks (Figure 1). Up to 3 ROIs were chosen in each tumour to be representative of the tissues present. The following properties were assessed in each ROI: cellularity, quantified using the nuclear-to-stromal ratio; fat fraction; and vessel density. ROIs were categorised by stroma type as fibrous (with fibrous stroma grades 1 to 5), myxoid and fibromyxoid.
MR image analysis: Model fitting was performed voxel-by-voxel using a Levenberg-Marquardt least-squares algorithm (ADC, R2*) or a Markov chain Monte Carlo approach (IVIM) using in-house software. ROIs were positioned by a consultant radiologist on each functional imaging series to match the sampled area. The median value of ADC, D, f, fD*, R2* and fat fraction was estimated for each ROI. EF was defined as the fraction of pixels in the ROI that increased in signal intensity by >5% between pre- and post-contrast T1-w images.
Results
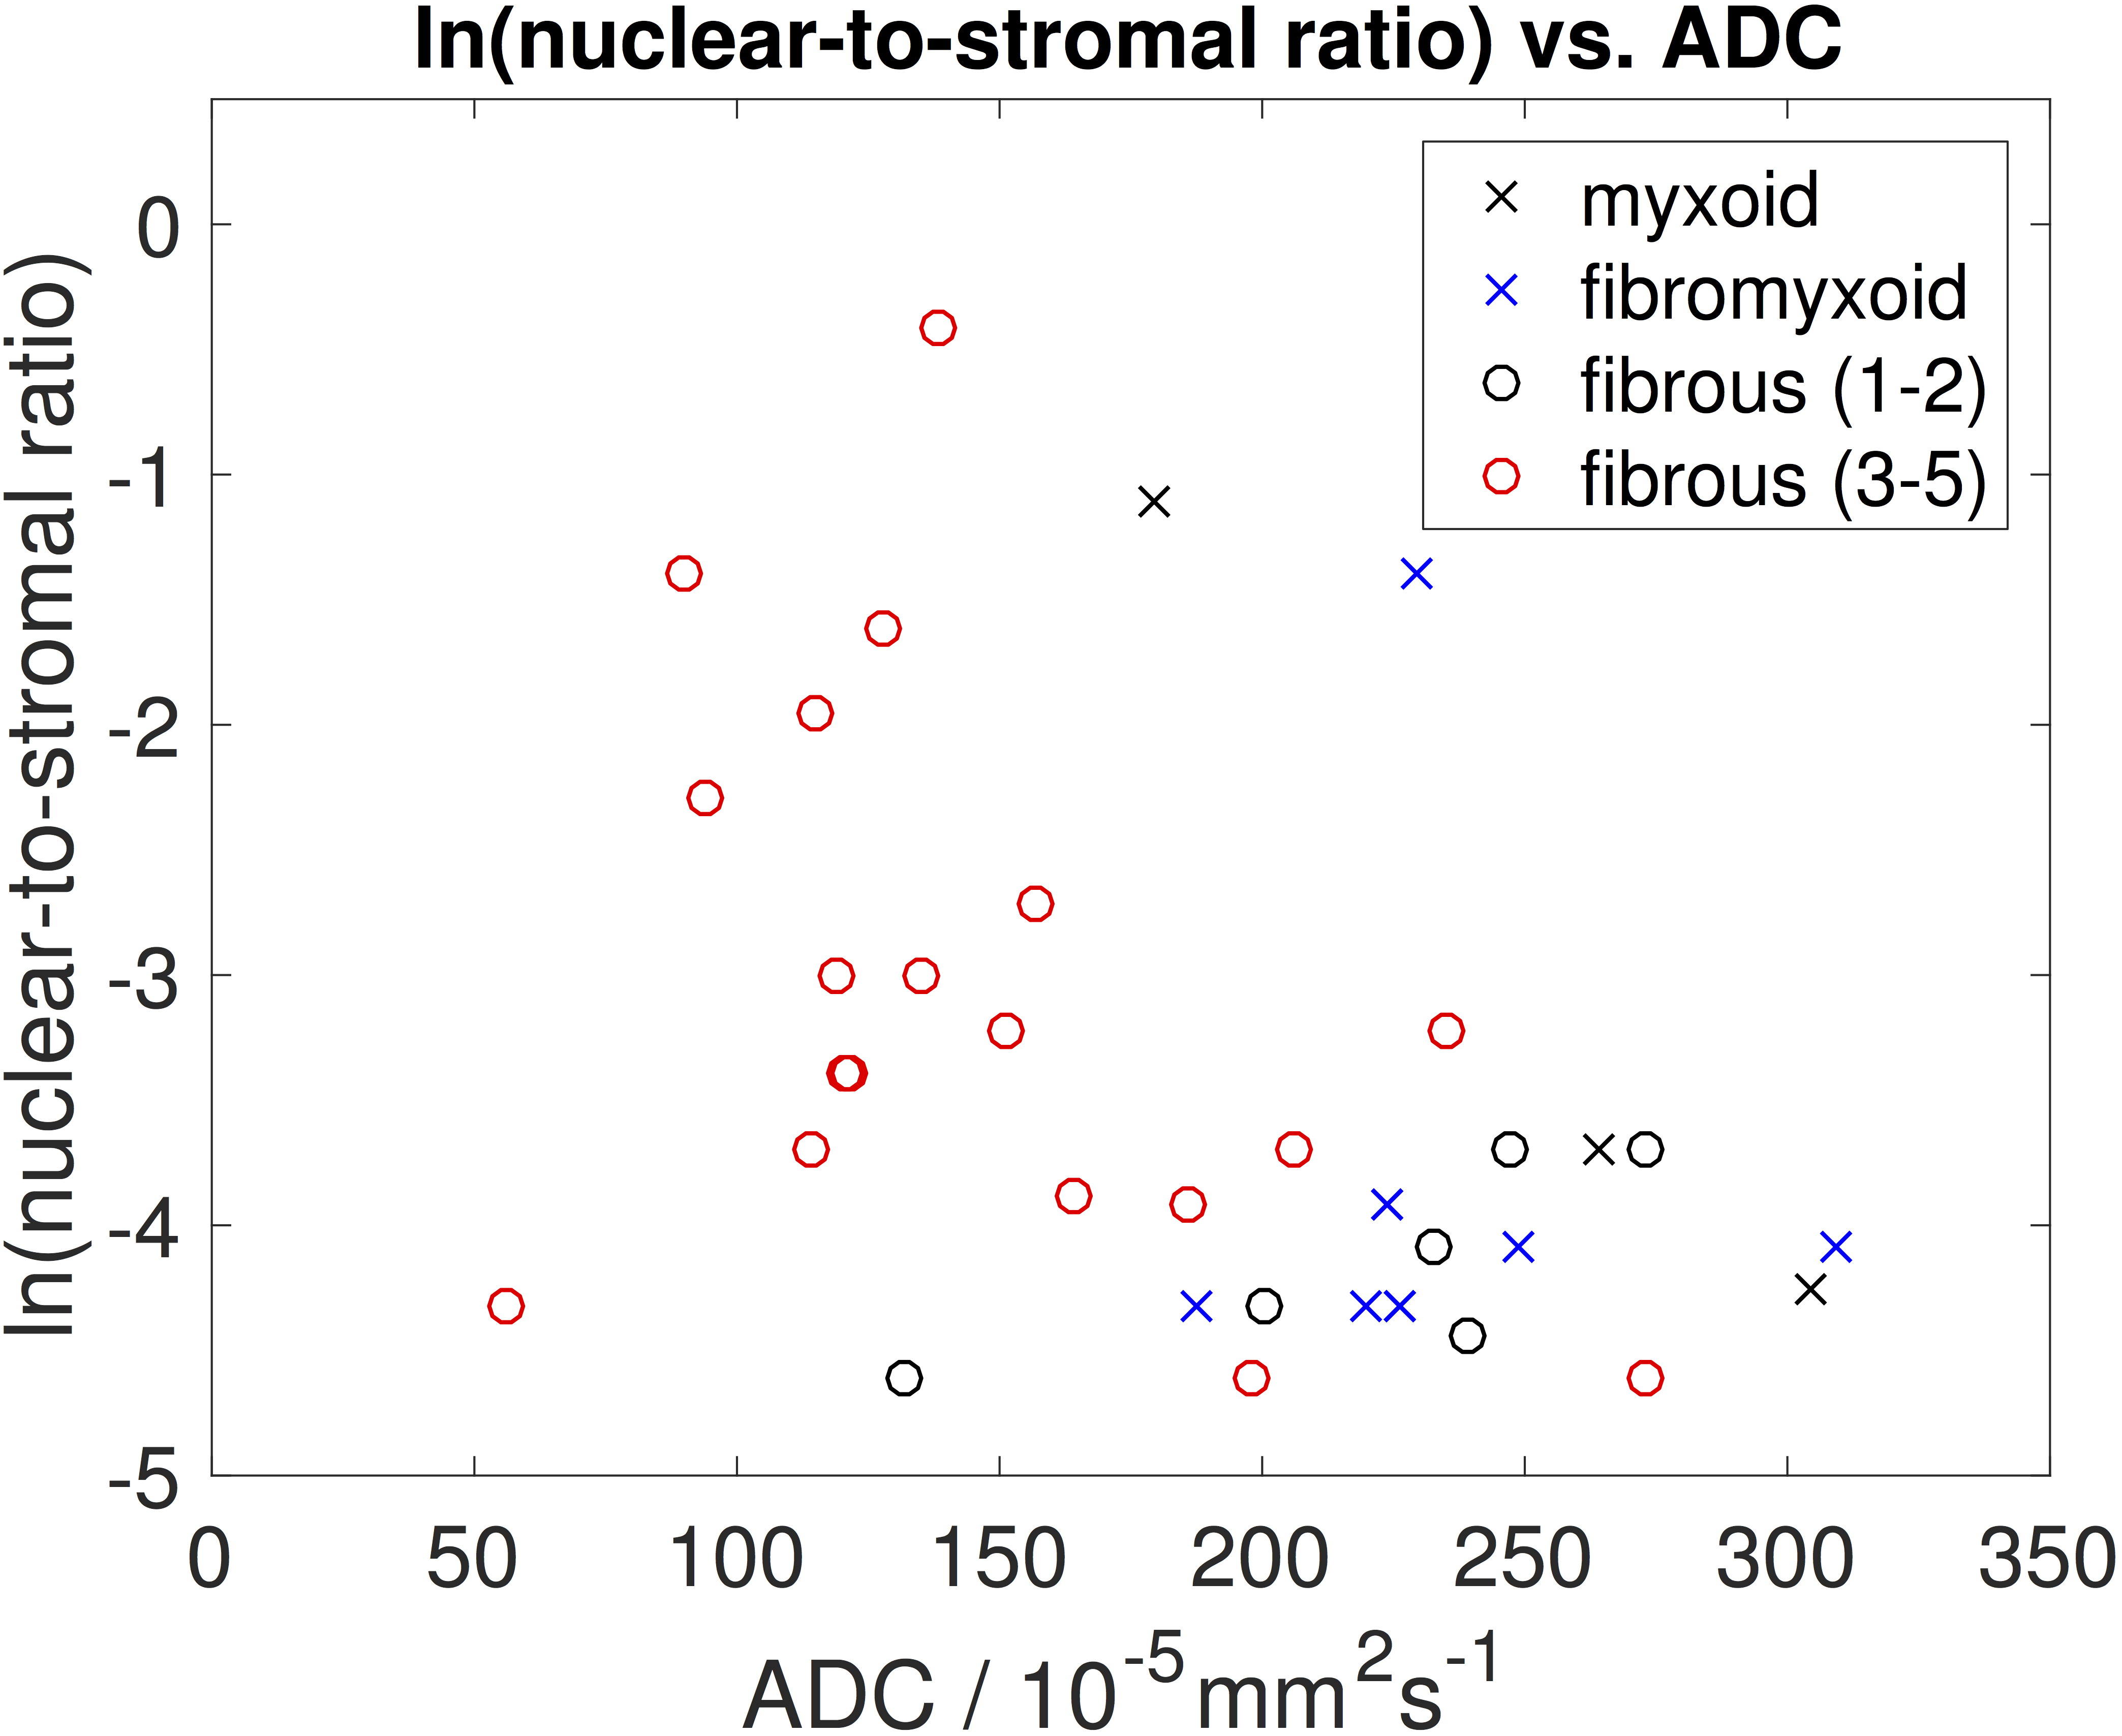
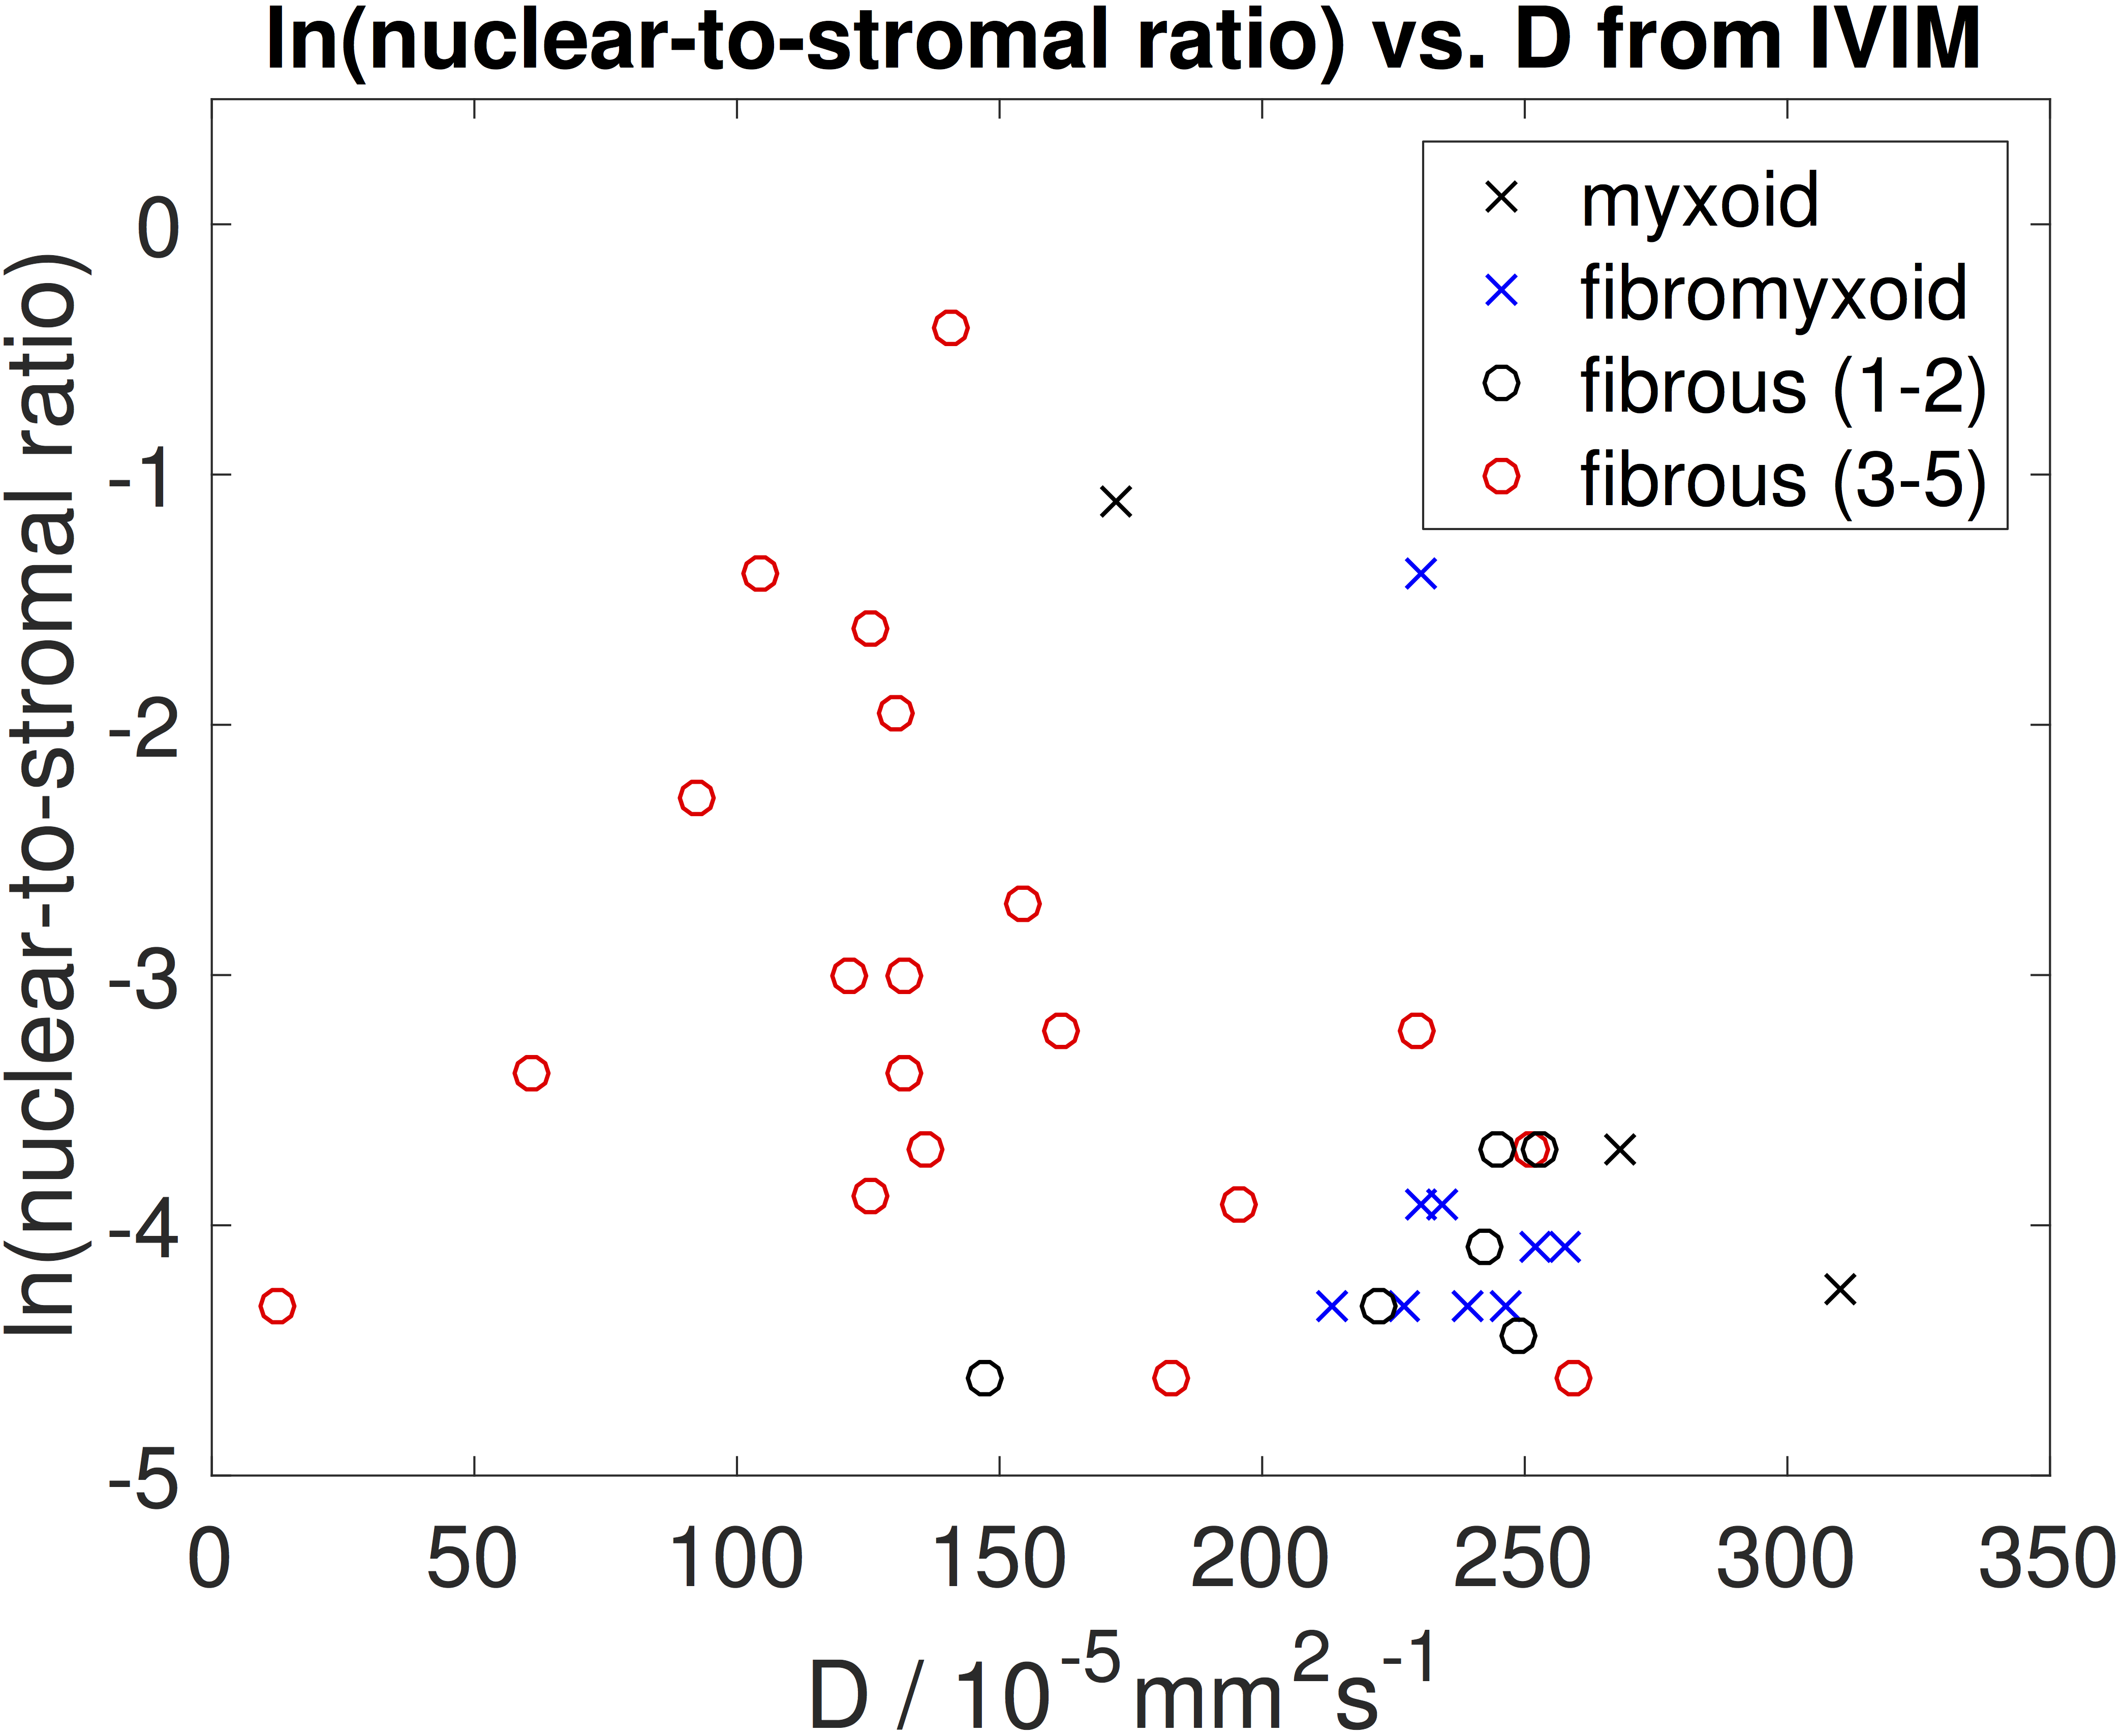
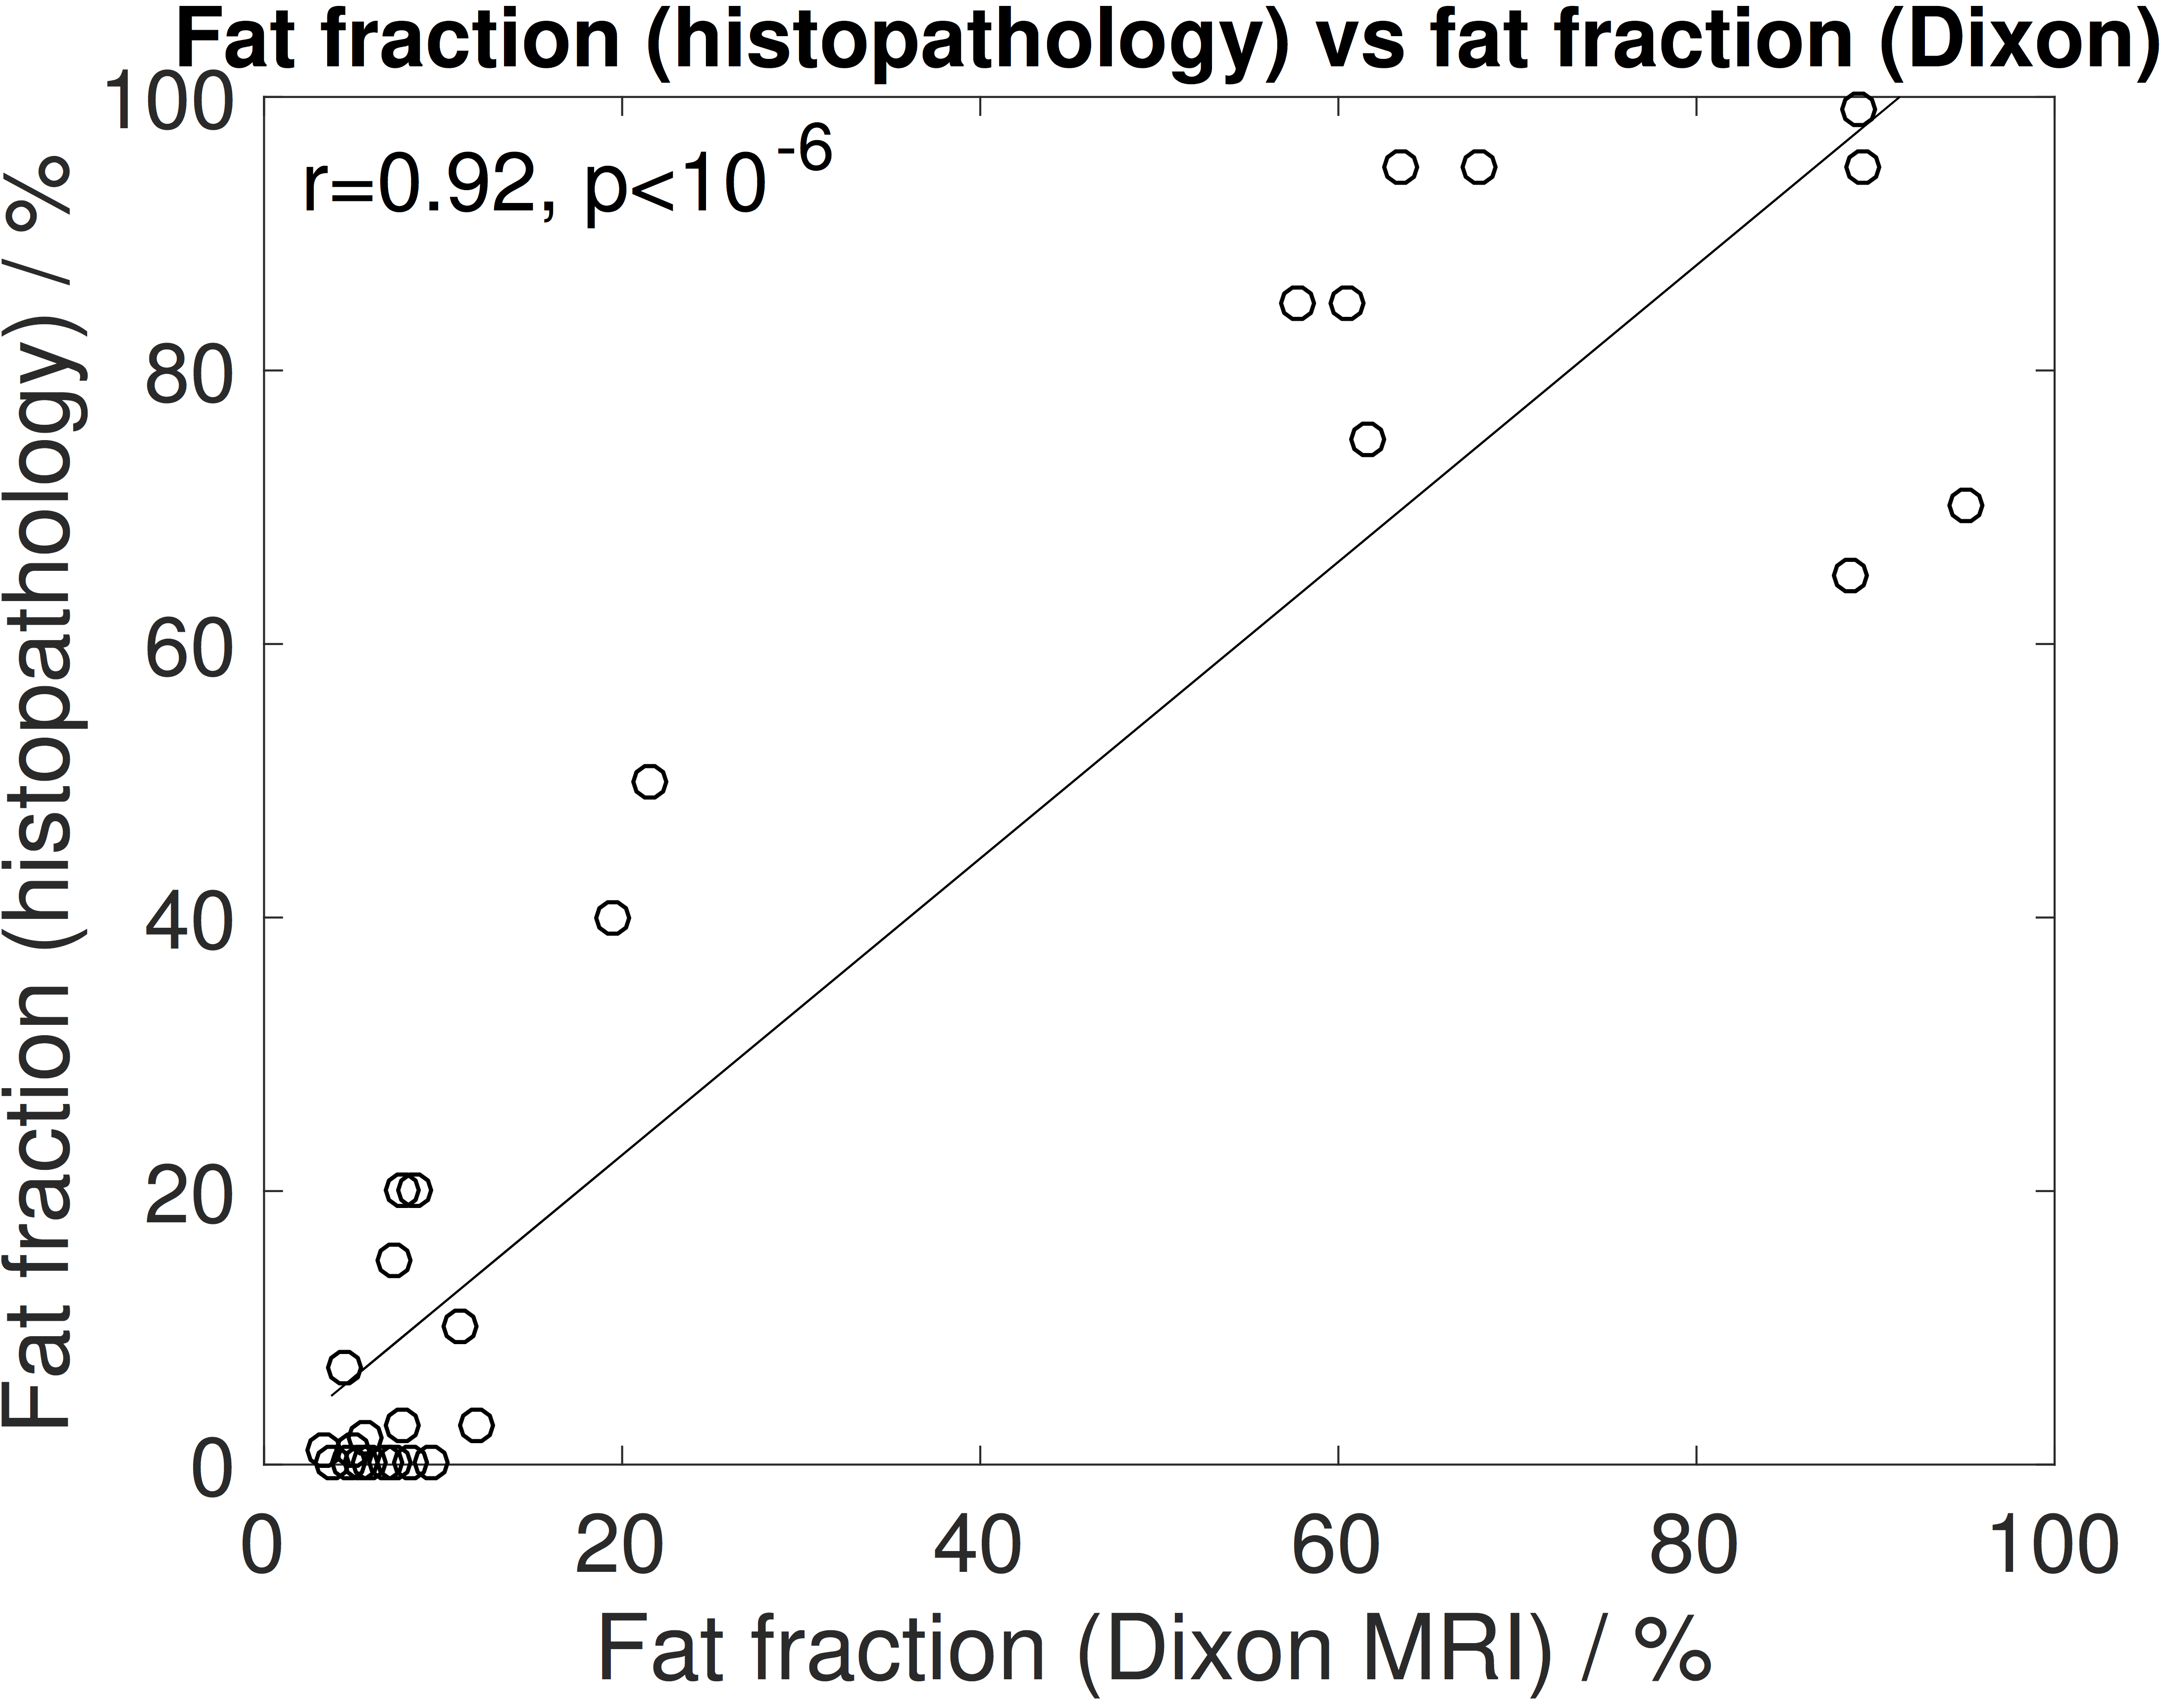
Figure 2 demonstrates a relationship between ADC and nuclear-to-stromal ratio, with low ADC in ROIs with high nuclear-to-stromal ratio and high ADC in ROIs with low nuclear-to-stromal ratio. Figure 2 also shows a relationship between ADC and stroma type and stroma grade. In fibrous stroma, higher ADCs are observed in fibrous grades 1 and 2, with lower ADCs in fibrous grades 3 to 5 (t-test, p=0.007). Figure 3 shows similar relationships for D from the IVIM model. There is no clear relationship between vessel density and either f, fD*, R2*, or EF. Fat fraction estimated from Dixon shows strong correlation with histopathological assessment of fat fraction (Figure 4, r=0.92, p<10-6).Discussion
These results indicate a relationship between restricted diffusion (low ADC or D) and high cellularity (high nuclear-to-stromal ratio) that may be more complicated than a simple correlation owing to the additional relationships of ADC or D with stroma type and stroma grade. The lack of correlation between vessel density and f or fD* may indicate that the IVIM model does not describe a perfusion (pseudo-diffusion) component in these tumours. These data do not exhibit the steep deviation from mono-exponential behaviour at low diffusion weightings that is characterised by the IVIM model. Histopathological assessment of vessel density does not describe the same functional properties of the vasculature as f, fD*, R2*, or EF, as these also relate to flow, oxygenation and permeability.Conclusion
ADC and D show relationships with cellularity and stroma in retroperitoneal sarcomas. There is no apparent relationship between vessel density and either f, fD*, R2*, or EF in this cohort of patients. Fat fraction estimated by Dixon MRI shows strong correlation with histopathological assessment of fat fraction.Acknowledgements
We acknowledge CRUK and EPSRC support to the Cancer Imaging Centre at ICR and RMH in association with MRC and Department of Health C1060/A10334, C1060/A16464 and NHS funding to the NIHR Biomedical Research Centre and the Clinical Research Facility in Imaging at The Royal Marsden and ICR and the support of the NIHR Clinical Research Network. We thank Alto Stemmer at Siemens Healthcare for providing DWI prototype packages.References
1. McBride S et al. Locoregional recurrence after preoperative radiation therapy for retroperitoneal sarcoma: adverse impact of multifocal disease and potential implications of dose escalation. Ann Surg Oncol 2013;20:2140-2147.
2. Canter R et al. Radiographic and histologic response to neoadjuvant radiotherapy in patients with soft tissue sarcoma. Ann Surg Oncol 2010;17:2578-2584.
3. Roberge D et al. Radiological and pathological response following pre-operative radiotherapy for soft tissue sarcoma. Radiother Oncol 2010;97:404-407.
Figures