2910
The role of ADC histogram analysis in discriminating between benign and malignant tumours in children1Institute of Cancer and Genomic Sciences, University of Birmingham, Birmingham, United Kingdom, 2Department of Paediatric Oncology, Birmingham Children's Hospital, Birmingham, United Kingdom, 3Department of Paediatric Radiology, Birmingham Children's Hospital, Birmingham, United Kingdom
Synopsis
We evaluated histogram analysis of ADC maps to differentiate benign from malignant solid paediatric tumours in children and distinguish tumour type. Fifty children (38 malignant, 12 benign tumours) were imaged using multi-b value diffusion-weighted MRI at diagnosis. Whole tumour regions-of-interest (ROIs) were drawn, ADC histograms constructed, and median, 2nd to 98th percentile ADC values, skewness, kurtosis and entropy calculated. ADC histogram parameters were significantly different between malignant and benign lesions, with skewness and kurtosis being the most predictive of malignancy.
Purpose
Definitive diagnosis of solid tumours in children is not possible using conventional imaging alone. Diffusion-Weighted MR Imaging (DWI) provides information about tissue cellularity through measuring the microscopic rate of water diffusion. Images acquired with high and low-diffusion weighting (b-values) are used to calculate the Apparent Diffusion Coefficient (ADC), a quantitative measure with an inverse relationship with cellularity1-5. Constructing ADC histograms may provide information about tumour heterogeneity to non-invasively discriminate benign from malignant tumours or differentiate tumour type.
This study aimed to evaluate the value of histogram analysis of ADC maps in differentiating benign from malignant solid tumours in children or distinguishing tumour type, and identify histogram parameters predictive of malignancy.
Methods
Fifty children (38 malignant, 12 benign tumours) were included. Malignancies included neuroblastoma, wilms, rhabdoid, rhabdomyosarcoma and hepatoblastoma. Benign lesions consisted of vascular malformations, lipomas, mesoblastic nephromas and ganglioneuromas.
All patients underwent 1.5T MR examination (Siemens Avanto, Siemens Healthcare, Erlangen, Germany). The imaging protocol consists of fat-suppressed axial pre- and post-gadolinium T1-W turbo spin echo, axial and coronal T2-W short tau inversion recovery. DW-MRI was acquired using an echo-planar imaging (EPI) sequence in an axial acquisition plane with a field of view (FOV) 187 x 250 mm2, matrix size 144 x 192, slice thickness 5.0 mm, gap 5mm. For each subject 6 b-values (0, 50, 100, 150, 600, 1000 s/mm-2) were acquired in three orthogonal directions with TR/TE = 5700/92 ms.
ADC maps were automatically generated by scanner software. MIROR, an in-house developed medical image analysis toolbox was used for data extraction and regions of interest (ROI) analysis. ROIs were drawn in MIROI around the entire solid tumour on high resolution B0 images by an experienced radiologist prior to overlay on matched ADC maps. Conventional MR guided definition of the outline of the tumour at each consecutive tumour-containing slice, excluding peritumoural oedema. Median, 2nd, 5th, 10th, 15th, 25th, 75th, 85th, 90th, 95th and 98th percentile ADC, skewness, kurtosis and entropy were extracted and their discriminatory potential evaluated. Groups were compared using the Kruskal-Wallis test and p values reported. Multivariate discriminant analysis determined the combination of histogram parameters most predictive of malignancy, and ROC curve analysis the diagnostic value for malignancy of each significant parameter.
Results
ADC values were significantly lower in malignant than benign tumours (median, 2nd, 5th, 10th, 15th, 25th, and 75th percentile ADC; p=0.004 to p=0.035). Higher percentile values (85th, 95th and 98th) did not reach statistical significance. Malignant lesions had more positively skewed histograms (p<0.0001), and significantly higher kurtosis (p<0.0001) and entropy (p=0.031) (Table 1, Figure 1). Discriminant analysis revealed skewness and kurtosis as highly predictive of malignancy (accuracy 92%). In ROC analysis, skewness yielded the best Area Under Curve, AUC (0.86, p=0.001, 95%CI 0.69-1.00, sensitivity 95%, specificity 69%) with cut-off 0.017. Small sample size precluded determination of significant differences between individual tumour types.
Of clinical relevance, malignant neuroblastoma could be distinguished from benign ganaglioneuroma through the former demonstrating significantly lower median, 2nd, 5th, 10th, 15th, 25th, 75th and 85th centile (p=0.004) ADC values, more positive skewness (p=0.004) and higher kurtosis (p=0.009). These lesions cannot be differentiated on conventional MR imaging6.
Discussion
Histogram analysis of ADC maps using a whole-tumour ROI approach could facilitate non-invasive differentiation of malignant from benign body tumours in children with 2nd, 5th, 10th, 15th, 25th, 50th and 75th percentile ADC significantly lower and skewness and kurtosis significantly higher in malignancy. Our finding of low ADC of malignant lesions corresponds to other paediatric studies1,7,8.
This is the first study of ADC histogram analysis to differentiate between childhood tumours. Previous paediatric studies evaluating mean or median ADC7-10 do not account for tumour heterogeneity. A histogram-based evaluation provides information about skewness, kurtosis and entropy, reflecting histological characteristics. Skewness and kurtosis were significant predictors of malignancy[JN1] . Similar findings have been reported in adult studies11-13. High skewness could equate to high cellularity reflected by dense population of the left end of the histogram corresponding to low ADC values.
Although histograms of different tumour types appear morphologically different (Figures 3-5), we were unable to identify parameters predictive of individual malignant tumour type. More sophisticated multi-variate analysis may help in this discrimination, but more cases are needed.
Conclusion
Conducting and interpreting diffusion-weighted MRI of childhood solid tumours using quantitative ADC and histogram analysis is feasible. ADC histogram parameters are significantly different between malignant and benign lesions. Skewness and kurtosis are highly predictive of malignancy and potentially useful non-invasive biomarkers which deserve further clinical evaluation.Acknowledgements
We would like to thank Mrs. Shaheen Latif and Dr. Heather Rose for their help in performing DWI and data transfer.
Funding: This work was supported by the National Institute for Health Research (NIHR) grant code 13-0053.
Role of the Funding Source: The sponsor had no role in the writing of this report or the decision to submit the article for publication.
Conflict of interest: none declared
References
1. Humphries PD, Sebire NJ, Siegel MJ, Olsen OE. Tumors in pediatric patients at diffusion-weighted MR imaging: apparent diffusion coefficient and tumor cellularity. Radiology. 2007 Dec;245(3):848–54.
2. Kralik SF, Taha A, Kamer AP, Cardinal JS, Seltman TA, Ho CY. Diffusion imaging for tumor grading of supratentorial brain tumors in the first year of life. AJNR Am J Neuroradiol. 2014 Apr;35(4):815–23.
3. Yamashita Y, Kumabe T, Higano S, Watanabe M, Tominaga T. Minimum apparent diffusion coefficient is significantly correlated with cellularity in medulloblastomas. Neurol Res. 2009 Nov;31(9):940–6.
4. Gauvain KM, McKinstry RC, Mukherjee P, Perry A, Neil JJ, Kaufman BA, et al. Evaluating pediatric brain tumor cellularity with diffusion-tensor imaging. AJR Am J Roentgenol. 2001 Aug;177(2):449–54.
5. Dominguez-Pinilla N, Martinez de Aragon A, Dieguez Tapias S, Toldos O, Hinojosa Bernal J, Rigal Andres M, et al. Evaluating the apparent diffusion coefficient in MRI studies as a means of determining paediatric brain tumour stages. Neurologia. 2015 Feb.
6. Gahr N, Darge, K, Hahn G, Kreher BW, Buiren von , Uhl M. Diffusion-weighted MRI for differentiation of neuroblastoma and ganglioneuroblastoma/ganglioneuroma. European Journal of Radiology. 2011 Sep;79 (3):443-6.
7. Abdel Razek AAK, Gaballa G, Elhawarey G, Megahed AS, Hafez M, Nada N. Characterization of pediatric head and neck masses with diffusion-weighted MR imaging. Eur Radiol. 2009 Jan;19(1):201–8.
8. Gawande RS, Gonzalez G, Messing S, Khurana A, Daldrup-Link HE. Role of diffusion-weighted imaging in differentiating benign and malignant pediatric abdominal tumors. Pediatr Radiol. 2013 Jul;43(7):836–45.
9. Kocaoglu M, Bulakbasi N, Sanal HT, Kismet E, Caliskan B, Akgun V, et al. Pediatric abdominal masses: diagnostic accuracy of diffusion weighted MRI. Magn Reson Imaging. 2010 Jun;28(5):629–36.
10. Lope LA, Hutcheson KA, Khademian ZP. Magnetic resonance imaging in the analysis of pediatric orbital tumors: utility of diffusion-weighted imaging. J AAPOS. 2010 Jun;14(3):257–62.
11. Suo S-T, Chen X-X, Fan Y, Wu L-M, Yao Q-Y, Cao M-Q, et al. Histogram analysis of apparent diffusion coefficient at 3.0 T in urinary bladder lesions: correlation with pathologic findings. Acad Radiol. 2014 Aug;21(8):1027–34.
12. Pereira JAS, Rosado E, Bali M, Metens T, Chao S-L. Pancreatic neuroendocrine tumors: correlation between histogram analysis of apparent diffusion coefficient maps and tumor grade. Abdom Imaging. 2015 Oct;40(8):3122–8.
13. Xu XQ, Hu H, Su GY, Liu H, Hong XN, Shi HB, et al. Utility of histogram analysis of ADC maps for differentiating orbital tumors. Diagn Interv Radiol. 2016 Mar;22(2):161–7.
Figures
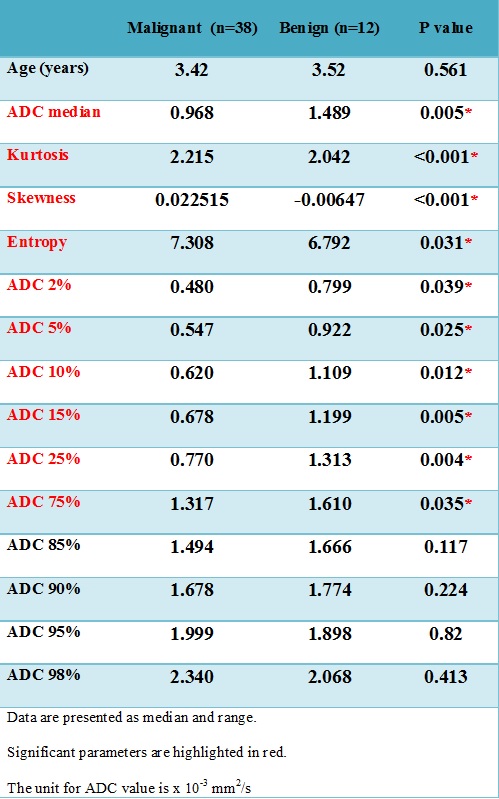
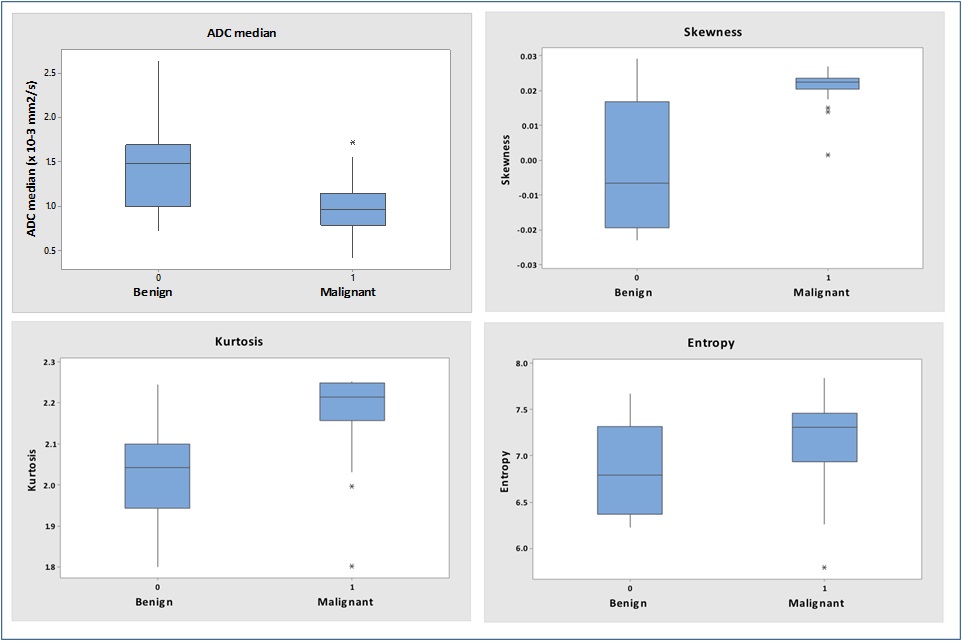
Figure 2. a-d.
Box plots show comparison of ADC histogram parameters (ADC median (a), skewness (b), kurtosis (c) and entropy (d)) for benign and malignant paediatric tumours. The line in box represents the median, height of the box represents the interquartile range, whiskers are the lowest and highest data points within 1.5 interquartile range, and asterisks indicate outliers.
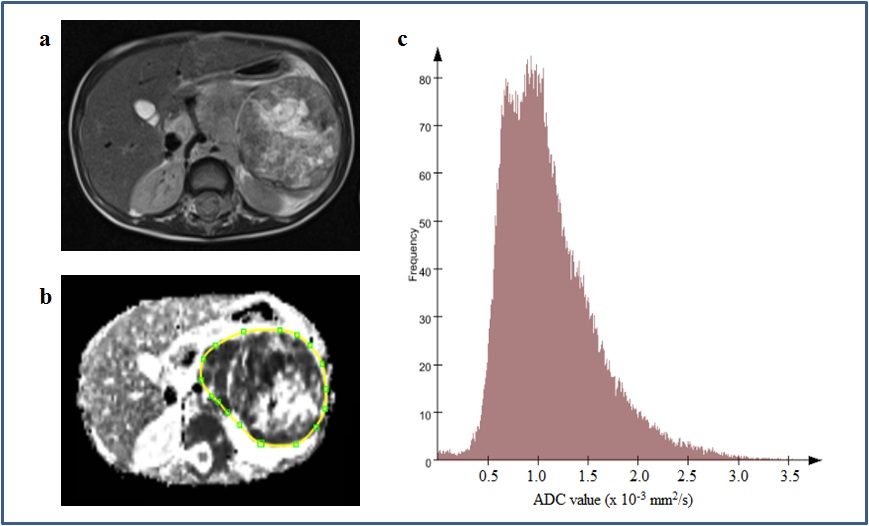
Figure 3. a-c.
A 2 year old girl with a left sided neuroblastoma. Axial T2-weighted image (a) shows a large abdominal mass lying anterior to the left kidney. ADC map was obtained and a whole-tumour ROI selected (b). The corresponding histogram of the neuroblastoma (c) shows ADC median 0.996 × 10⁻³ mm2/s, kurtosis 2.25, skewness 0.0216 and entropy 7.47.
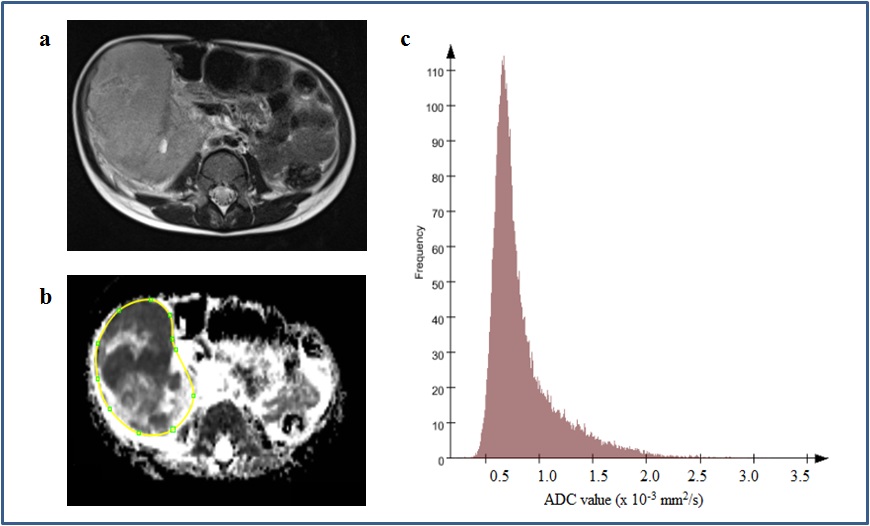
Figure 4. a-c.
A 3 year old boy with a right sided Wilms tumour. Axial T2-weighted image (a) shows a large, lobulated, heterogeneous tumour arising from the right kidney. The mass is prediminantly solid, but contains minor haemorrhage and small cystic lesions. Solid components show restricted diffusion. ADC map was obtained and a whole-tumour ROI selected (b). The corresponding histogram of the Wilms tumour (c) shows ADC median 0.738 × 10⁻³ mm2/s, kurtosis 2.18, skewness 0.0238 and entropy 6.83.

Figure 5. a-c.
A 6 year old boy with a left-sided ganglioneuroma. Axial T2-weighted image (a) shows a well-defined round mass in the left side of the abdomen. The mass enhances heterogeneously and does not restrict diffusion. ADC map was obtained and a whole-tumour ROI selected (b). The corresponding histogram of the ganglioneuroma (c) shows ADC median 1.576 × 10⁻³ mm2/s, kurtosis 2.03, skewness -0.0196 and entropy 6.50.