2909
Radiomic features extracted from T2w MRI differentiates KRAS mutational status in rectal cancers: A pilot study1Radiology, Baylor College of Medicine, Houston, TX, United States, 2KFMC - Riyadh, Saudi Arabia, 3Biomedical Engineering, Case Western Reserve University, 4KFSH - Qassim
Synopsis
Contemporary management of rectal cancer includes consideration of adjuvant anti EGFR therapy; however, KRAS mutational status profiling is mandatory prior to initiation of this therapy. KRAS mutational status is typically assayed on tissue samples (biopsy/surgical specimens). Radiomic features have demonstrated the ability to quantitatively characterize image phenotypic appearance associated with genotype expression in different tumors. We explored the utility of multi-scale, multi-oriented filter banks to define radiomics signatures that distinguish KRAS mutated vs wildtype tumors on T2W MRI. Initial results indicate that macro-scale radiomic features depict significantly different responses between the 2 genotypic groups.
Purpose
In rectal cancer patients, a mutated KRAS genotype confers a negative overall survival and indicates potentially poor response to adjuvant anti-EGFR therapy [1]. Hence, current standard of care warrants profiling of KRAS mutational status, prior to consideration of anti EGFR therapeutic strategies. Typically, KRAS mutational status is assayed on surgically resected specimens or biopsy samples [2]. This requires invasive intervention, as well as being prone to sampling errors (as gene profiling is assayed only on a small portion of tissue). However, pre-operative MRI is routinely available for rectal cancer patients for disease staging. MRI-based measurements of rectal tumor dimensions and stage have recently shown moderate correlation with KRAS status [3]. We retrospectively explored the applicability of radiomic filter banks to extract features from pre-operative T2W MRI, in order to define quantitative imaging signatures of MR image appearance to discriminate KRAS mutated (KRAS+) from KRAS wildtype (WT) rectal cancers.Methods
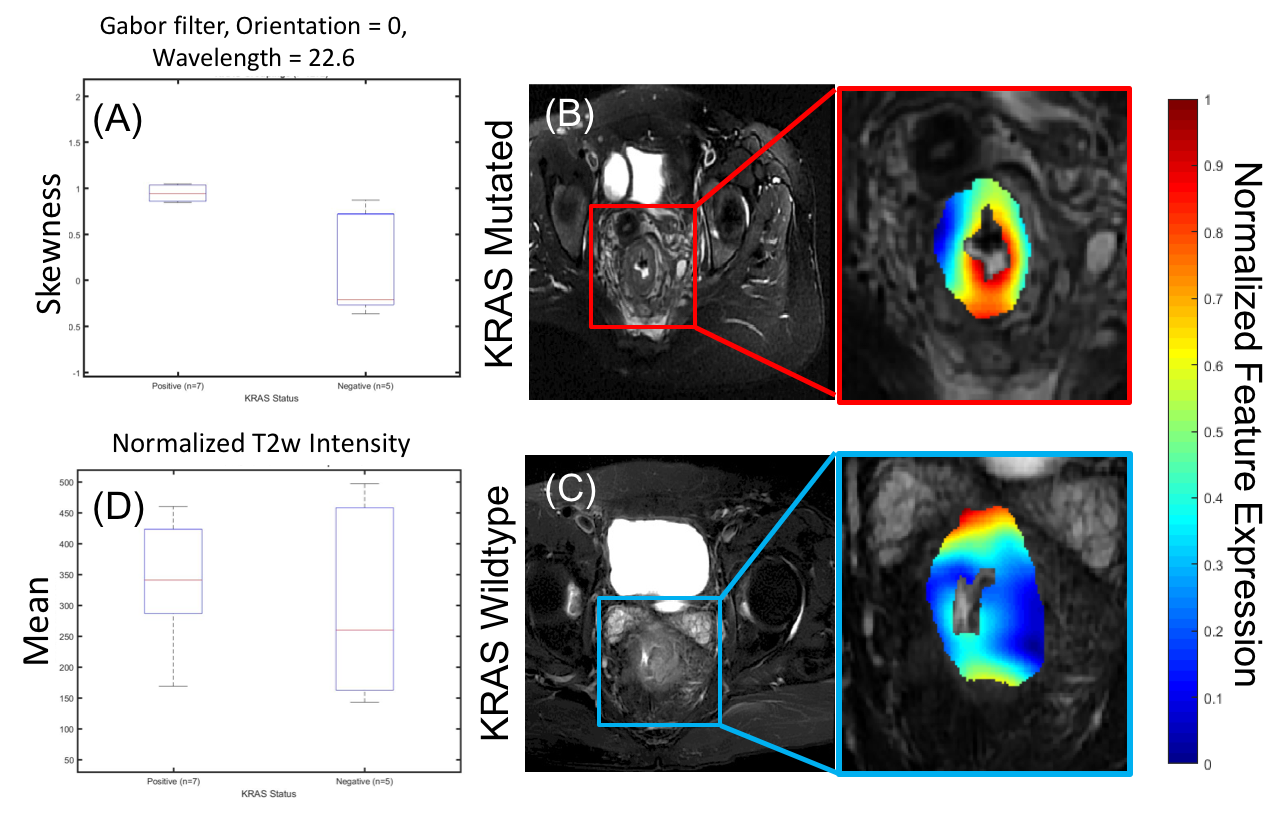
We performed retrospective analysis of baseline/pre-operative T2-weighted MRI (T2w PROPELLER MRI) acquired from 19 patients previously diagnosed with rectal cancer. Gene profiling was performed on tissue samples obtained on surgically resected specimens to determine the KRAS mutation status. A representative T2w MRI section was identified in each dataset, and annotated for tumor extent by an experienced radiologist. A total of 147 2D radiomic pixel-wise features were extracted to quantify tumor appearance [4,5]. These included Haralick (local gray level statistical occurrence), Gabor (multi-oriented, multi-scale filters), and Laws (multi-pattern filters) features. These features were quantified via descriptive statistics (skewness, kurtosis, mean, std deviation) within the annotated region-of-interest. A combined score via independent samples t-testing and nonparametric Wilcoxon rank-sum testing was calculated to identify and rank radiomics features based on showing statistically significant differences between the two groups (KRAS+, WT).Results and Discussion
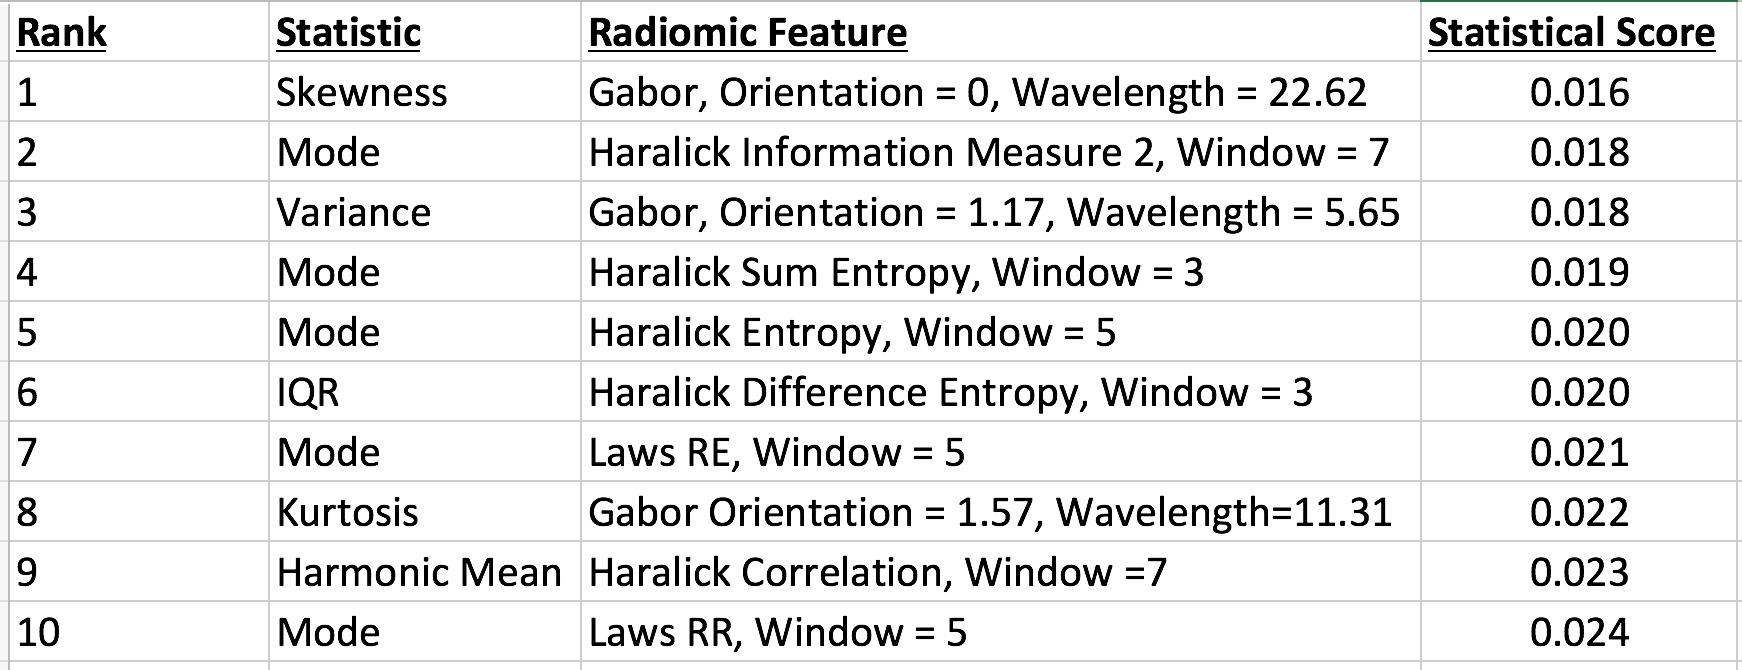
KRAS mutation status was available in 12/19 (KRAS+=7, WT=5) patients. The top ranked radiomic feature in statistical hypothesis testing between the 2 groups was the skewness of a macro-scale oriented Gabor filter response (p=0.015, meanKRAS+ = 1.04 $$$\pm$$$ 0.46 vs meanWT = 0.14 $$$\pm$$$ 0.57). By comparison, the normalized T2w intensity was not significantly different between the groups (meanKRAS+ = 354 $$$\pm$$$ 105 vs meanWT = 316 $$$\pm$$$ 117). Further, the top 10 ranked radiomics features are comprised of primarily Haralick and Gabor filter responses. Based on associated parameters these radiomic features are based on capturing a macro-scale response within KRAS+ tumors compared to WT tumors (macro-scale features are associated with larger wavelengths and window sizes) . Visual inspection of all tumors indicated that both WT and KRAS+ tumors uniformly appeared polypoidal on T2w MRI; indicating that a visually occult and subtle radiomic signature may be associated with the KRAS mutation status in rectal cancers.Limitations
1. Small sample size. 2. Absence of correlation and prediction via radiomic features with clinical response to anti EGFR therapy and outcomes.Conclusion
Initial results in our small cohort demonstrates the feasibility of radiomics features to profile the KRAS mutational status non-invasively on pre-operative MRI via macro-scale oriented filter responses. We envisage prospective validation of these radiomic features in a larger cohort. Non-invasive genotype profiling of rectal cancers via in vivo MRI and radiomics could enable more directed and personalized therapy in these patients.Acknowledgements
Research reported in this publication was supported by Department of Defense PRCRP Career Development Award, (W81XWH-16-1-0329), the National Cancer Institute of the National Institutes of Health under award numbers R21CA179327-01, R21CA195152-01, U24CA199374-01, the National Institute of Diabetes and Digestive and Kidney Diseases under award number R01DK098503-02, the DOD Prostate Cancer Synergistic Idea Development Award (PC120857); the DOD Lung Cancer Idea Development New Investigator Award (LC130463), the DOD Prostate Cancer Idea Development Award; the Case Comprehensive Cancer Center Pilot Grant, the VelaSano Grant from the Cleveland Clinic, the Wallace H. Coulter Foundation Program in the Department of Biomedical Engineering at Case Western Reserve University, the I-Corps@Ohio Program, the Case Urology Translational Research Training Program (CUTRTP), and the Hartwell Foundation.References
[1] Karapetis CS et al., N Engl J Med 359: 1757-1765, 2008
[2] Jo P et al, PLoS ONE 11(4): e0153278, 2016
[3] Yu RS et al, Anticancer Res, 36 (9) 4799-4804, 2016
[4] Aerts HJWL et al, Nature Communications 5: 4006, 2014
[5] Antunes J et al, Transl Oncol. 9(2):155-62, 2016
Figures