2907
4D-T2 weighted MRI for lung radiotherapy treatment planning1Joint Department of Physics, The Institute of Cancer Research and The Royal Marsden NHS Foundation Trust, London, United Kingdom, 2CR-UK Cancer Imaging Centre, The Institute of Cancer Research, London, United Kingdom, 3Medical Physics in Radiology, German Cancer Research Center (DKFZ), Heidelberg, Germany
Synopsis
Compared to 4D-CT, 4D-T2w MRI should better characterise respiratory motion in radiotherapy, due to its superior soft tissue contrast. However, 4D-T2w MRI is difficult to acquire due to the long echo and repetition time required. Here, 4D-T2w MRI is obtained by applying motion information from a 4D-T1w volume to a static 3D-T2w volume. For three patients, 4D-T2w MRI was compared to 4D-T1w MRI. Diaphragm positions were consistent to <1.5mm. A method to calculate 4D-T2w MRI, with potential application to an MR-linac, is presented and verified.
Purpose
To account for respiratory motion in lung radiotherapy, 4D-CT is commonly employed, but suffers from poor soft tissue contrast. T2w MRI offers superior soft tissue contrast, however it is challenging to obtain in 4D due to the long echo and repetition time required to achieve T2w contrast. Here, a method to obtain a 4D-T2w volume by employing motion information from 4D-T1w MRI is presented and verified.Methods
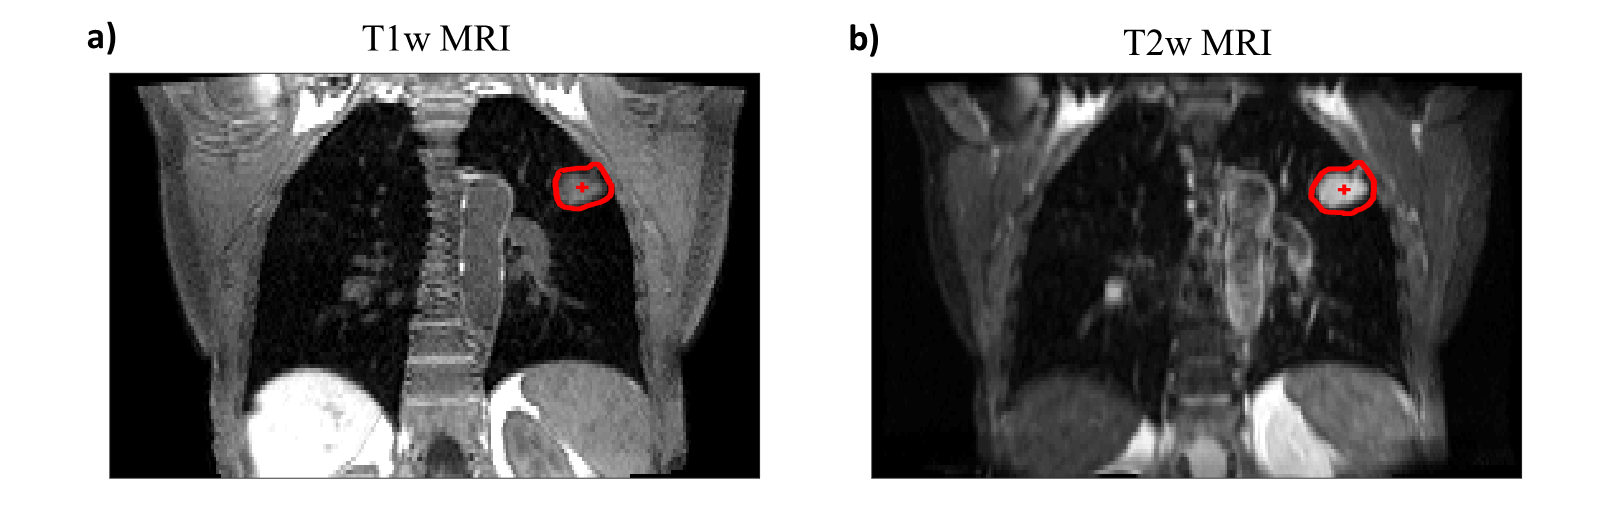
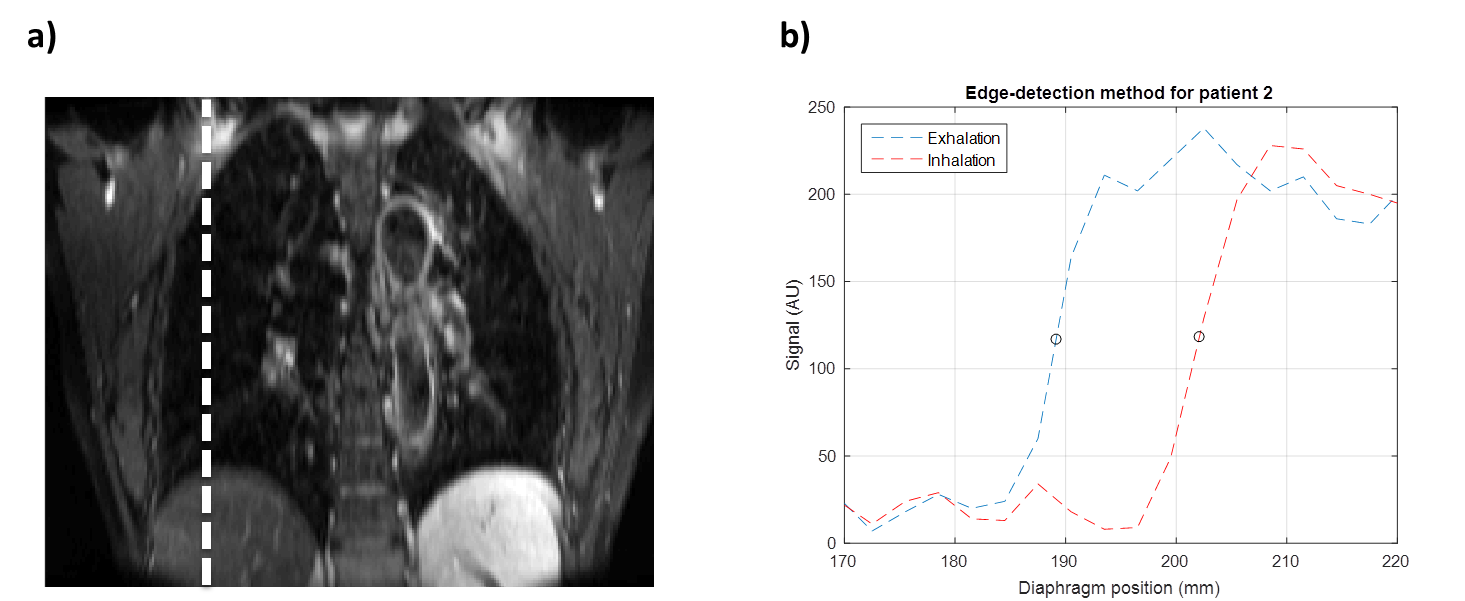
Three lung tumour patients were scanned with an axial 3D-T1w stack-of-stars spoiled gradient echo sequence in free breathing with golden angle spacing1,2 (voxel size 1.5x1.5x3mm3, TR 2.51ms, TE 1.24ms, FOV 384x384x288mm3, flip angle 12°, pixel bandwidth 1085Hz, acquisition time 4:59min) and an axial 3D-T2w turbo spin echo sequence with respiratory gating to exhalation (voxel size 1.5x1.5x3mm3, TR 4.1s, TE 114ms, FOV 480x288x288mm3, pixel bandwidth 600Hz, acquisition time 5:34-9:16min) at 1.5T (MAGNETOM Aera, Siemens Healthcare, Erlangen, Germany). Using the k-space centre magnitude as a self-gating signal, a 4D-T1w volume containing 20 respiratory phases was reconstructed using the 4D-joint MoCo-HDTV algorithm3. A b-splines deformable image registration between the respiratory phases was performed using NiftyReg4; providing motion vector fields describing the respiratory cycle. 4D-T2w MRI was generated by registering the acquired 3D-T2w volume to the exhalation phase of the 4D-T1w volume and then applying the calculated motion vector fields to the registered 3D-T2w volume using MATLAB (The MathWorks, Natick, MA). The calculated 4D-T2w volumes were validated against their corresponding 4D-T1w volumes: an edge-detection method, described in Figure 1, was employed to validate the diaphragm positions and a radiation oncologist delineated tumours for comparison of the tumour centroid positions, as demonstrated in Figure 2. Diaphragm positions were calculated for all phases in one coronal slice. Centroids were calculated from manually delineated tumours, for one coronal slice and all phases.Results
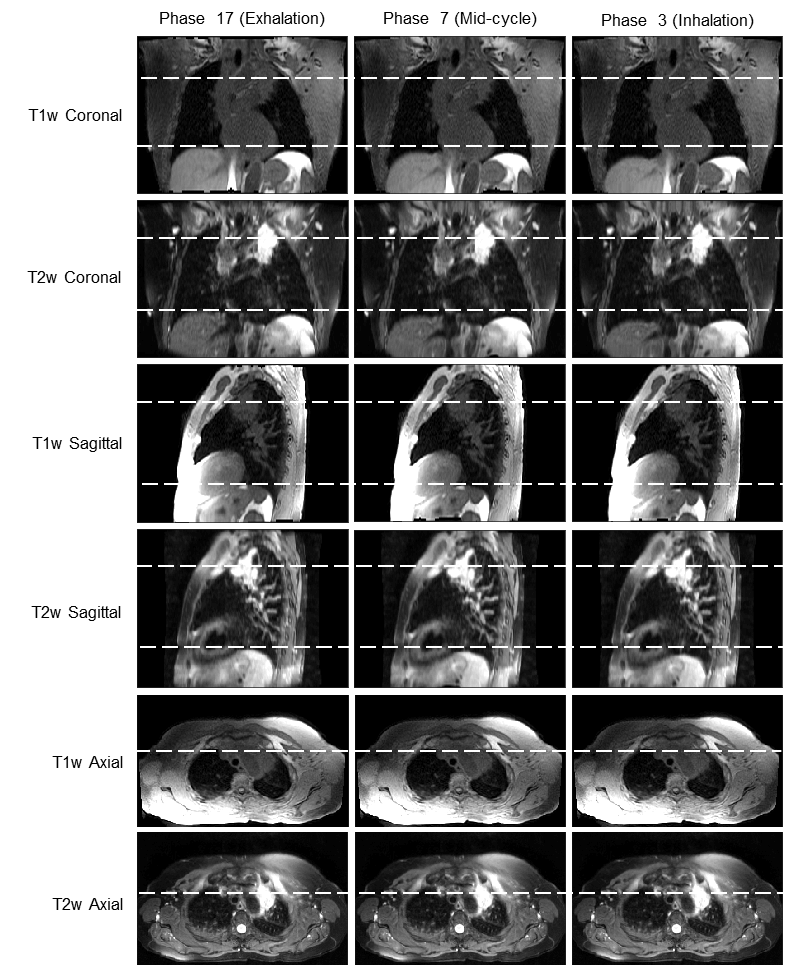
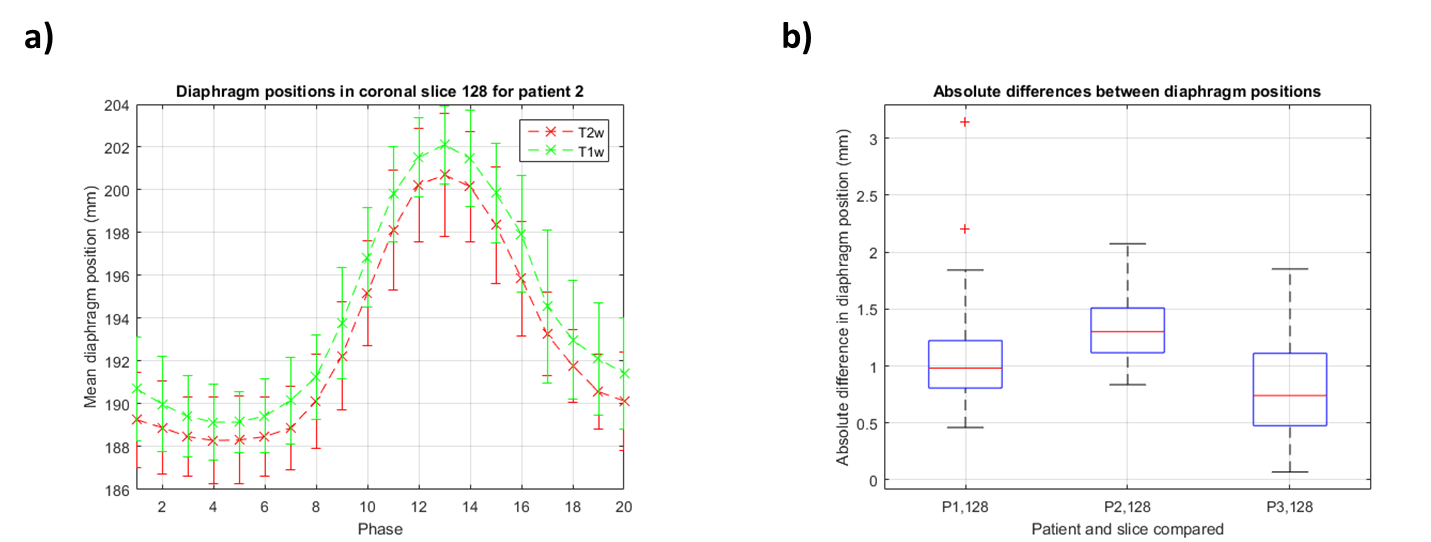
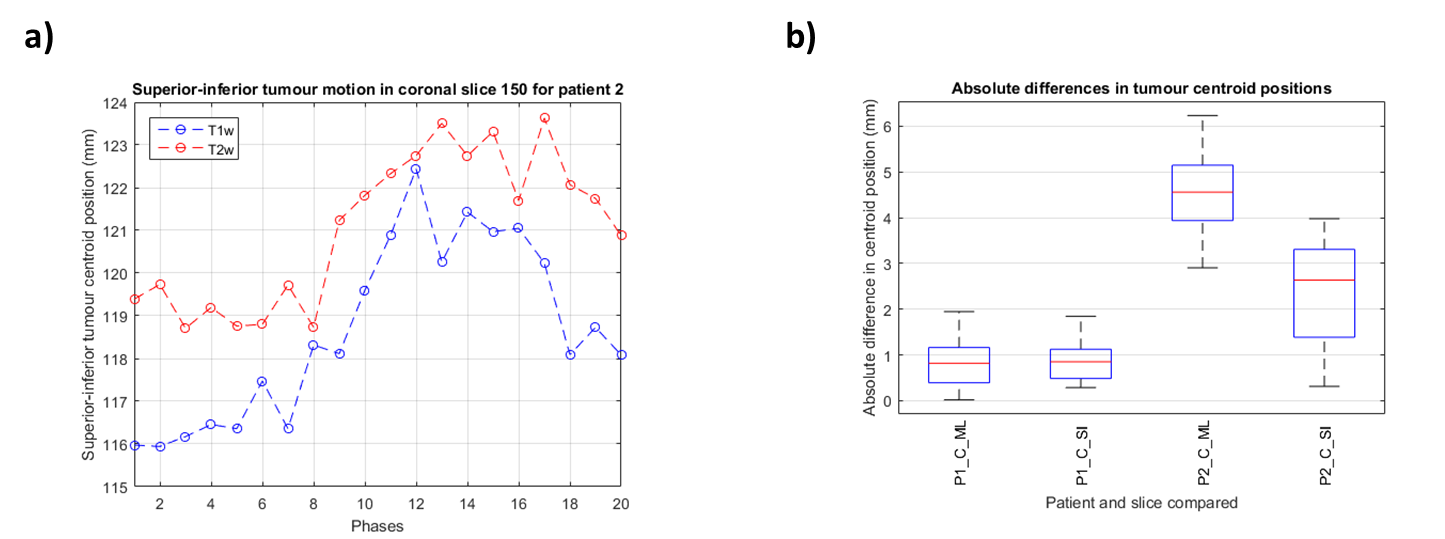
Figure 3 shows an example reconstructed T1w volume and a calculated T2w volume at respiratory phases corresponding to exhalation, mid-cycle and inhalation. For this example, T2w MRI has improved tumour definition when compared to T1w MRI. Mean diaphragm positions were calculated using the edge-detection technique for all patients on both T1w and T2w images. Figure 4a gives an example of the diaphragm positions for a patient. Figure 4b shows the spread of the distance between diaphragm positions on T1w and T2w images, across all respiratory phases. Diaphragm positions were consistent to <1.5mm for most phases. For three patients, tumour centroids were manually delineated. However, for patient 3 the tumour extent was not clearly visible in the 4D-T1w volume and was therefore not included in the delineation study. Figure 5a gives an example of tumour centroid motion. Figure 5b displays the absolute differences between the tumour centroid positions, delineated on the T1w and T2w volumes. Patient 1 showed sub-voxel median absolute differences <1mm. However, the tumour centroids in patient 2 exhibited a systematic shift >2.5mm in both superior-inferior and medial-lateral.Discussion
High quality 4D-T2w volumes were obtained and could assist clinicians in producing radiotherapy treatment plans for moving regions by improved tumour definition compared to 4D-CT volumes, with particular application to the MR-linac5. The presented technique is preferable to existing slice-selective excitation (2D) methods6 as slices are thinner; reducing staircase artefacts due to highly non-isotropic voxel sizes. 3D methods, like the presented technique, offer improved geometrical fidelity through 3D distortion correction, which on commercially available systems is often not available for 2D sequences, but nonetheless is crucial for radiotherapy treatment planning. Additionally, motion vector fields obtained during image reconstruction could be used to propagate e.g. planning contours, reducing clinical time required for delineation. Median diaphragm positions were consistent, demonstrating that the calculated 4D-T2w MRI not only contained respiratory phases corresponding to those of the 4D-T1w MRI, but was spatially coherent. Displacements >2.5mm were observed in the tumour centroid positions for patient 2. This might be because of tumour motion being partly suppressed by spatio-temporal regularisation during image reconstruction, such that for this case no T1w phase matching the acquired T2w volume exactly in both diaphragm and tumour position was found. Another explanation would be the different clinical information present in both T1w and T2w MRI, respectively the increased ability to visualise tumour extent with T2w MRI; also observed in patient 3.Conclusion
As a proof of principle, 4D-T2w MRI was obtained retrospectively by applying the motion information from a 4D-T1w volume to a static 3D-T2w volume. Good quality geometrically accurate 4D-T2w volumes with high spatio-temporal resolution may assist clinicians in delineating lesions within volumes affected by respiratory motion, that are challenging to outline on a 4D-CT volume.Acknowledgements
We acknowledge NHS funding to the NIHR Biomedical Research Centre and the Clinical Research Facility at The Royal Marsden and The Institute of Cancer Research and to the CR-UK Cancer Imaging Centre grant C1060/A10334. We are grateful to Alto Stemmer of Siemens Healthcare, Erlangen, Germany for providing us with WIP sequence #528R. Andreas Wetscherek is funded by CR-UK project grant C33589/A19727. Joshua Freedman is supported under CR-UK Non Clinical Centre grant CRM089X.References
1. Winkelmann S, Schaeffter T, Koehler T, et al. An optimal radial profile order based on the Golden Ratio for time-resolved MRI. IEEE T Med Imaging. 2007;26(1):68-76.2.
2. Block KT, Chandarana H, Milla S, et al. Towards routine clinical use of radial stack-of-stars 3d gradient-echo sequences for reducing motion sensitivity. J Korean Phys Soc. 2014;18(2):87-106.3.
3. Rank CM, Heußer T, Buzan MT, et al. 4D respiratory motion-compensated image reconstruction of free-breathing radial MR data with very high undersampling. Magn Reson Med. 2016;doi:10.1002/mrm.26206.4.
4. Modat M, Ridgway GR, Taylor ZA, et al. Fast free-form deformation using graphics processing units. Comp Meth Prog Bio. 2010;98(3):278-84.5.
5. Raaymakers BW, Lagendijk JJ, Overweg J et al. Integrating a 1.5 T MRI scanner with a 6 MV accelerator: proof of concept. Phys Med Biol. 2009;54(12):N229.
6. Liu Y, Yin FF, Czito BG, et al. T2-weighted four dimensional magnetic resonance imaging with result-driven phase sorting. Med Phys. 2015;42(8):4460-71.
Figures