2905
Texture Analysis on Diffusion Weighted MRI in Osteosarcoma1Center for Biomedical Engineering, Indian Institute of Technology, New Delhi, India, 2Radiodiagnosis, All India Institute of Medical Sciences, New Delhi, India, 3Medical Oncology, Dr. B.R.Ambedkar Institute-Rotary Cancer Hospital, All India Institute of Medical Sciences, New Delhi, India, 4Department of Biomedical Engineering, All India Institute of Medical Sciences, New Delhi, India
Synopsis
Texture analysis (TA) uses mathematical approach to characterize the spatial distribution of signal intensity variations in an image, and extracts quantitative information that are otherwise imperceptible qualitatively. Good soft tissue contrast of MRI facilitates TA to produce promising results in diagnosis and prognosis. Diffusion Weighted (DW) MRI based TA might provide additional useful information as DWI captures early cellular changes in tumors in terms of corresponding intensity variations. We computed textural features in patients with Osteosarcoma. Experimental results revealed that textural features show good discrimination among normal and tumour ROI thus might be useful as diagnostic and prognostic marker.
Purpose
Texture analysis (TA) is a mathematical approach to characterize the spatial distribution of signal intensity variations in an image, and provide quantitative information that is otherwise imperceptible qualitatively. In medical image analysis, texture analysis of MR images has shown promising results in diagnosis and prognosis1. Diffusion in tissue introduces a signal loss that is proportional to the degree of water motion in tissue.Therefore, restricted diffusion in tumour causes higher intensity in Diffusion weighted image (DWI) compared to normal tissue2. DWI is capable of capturing the early cellular changes in tumors in terms of corresponding intensity variations. Therefore, TA in DWI might provide additional information compared to quantitative medical image analysis by capturing subtle variation in its textural properties. TA might also be useful as a marker for response evaluation of chemotherapy in OS. This study was aimed to assess the effectiveness of DWI based texture analysis for tissue characterization in patients with Osteosarcoma.Methods
DWI dataset for sixteen patients (M:F=13:3, Age=16.0±2.9 years), with Osteosarcoma were acquired under the Institutional Review Board approved protocol (IEC-103/05.02.2016, RP-26/2016). The acquisition was performed on 1.5T Philips Achieva MRI scanner with Spin Echo Planar imaging (SP-EPI) sequence with TE=66msec, TR=1782msec, 5mm slice thickness and 192x192 matrix size. Images with b=800 s/mm2 were used for texture analysis.
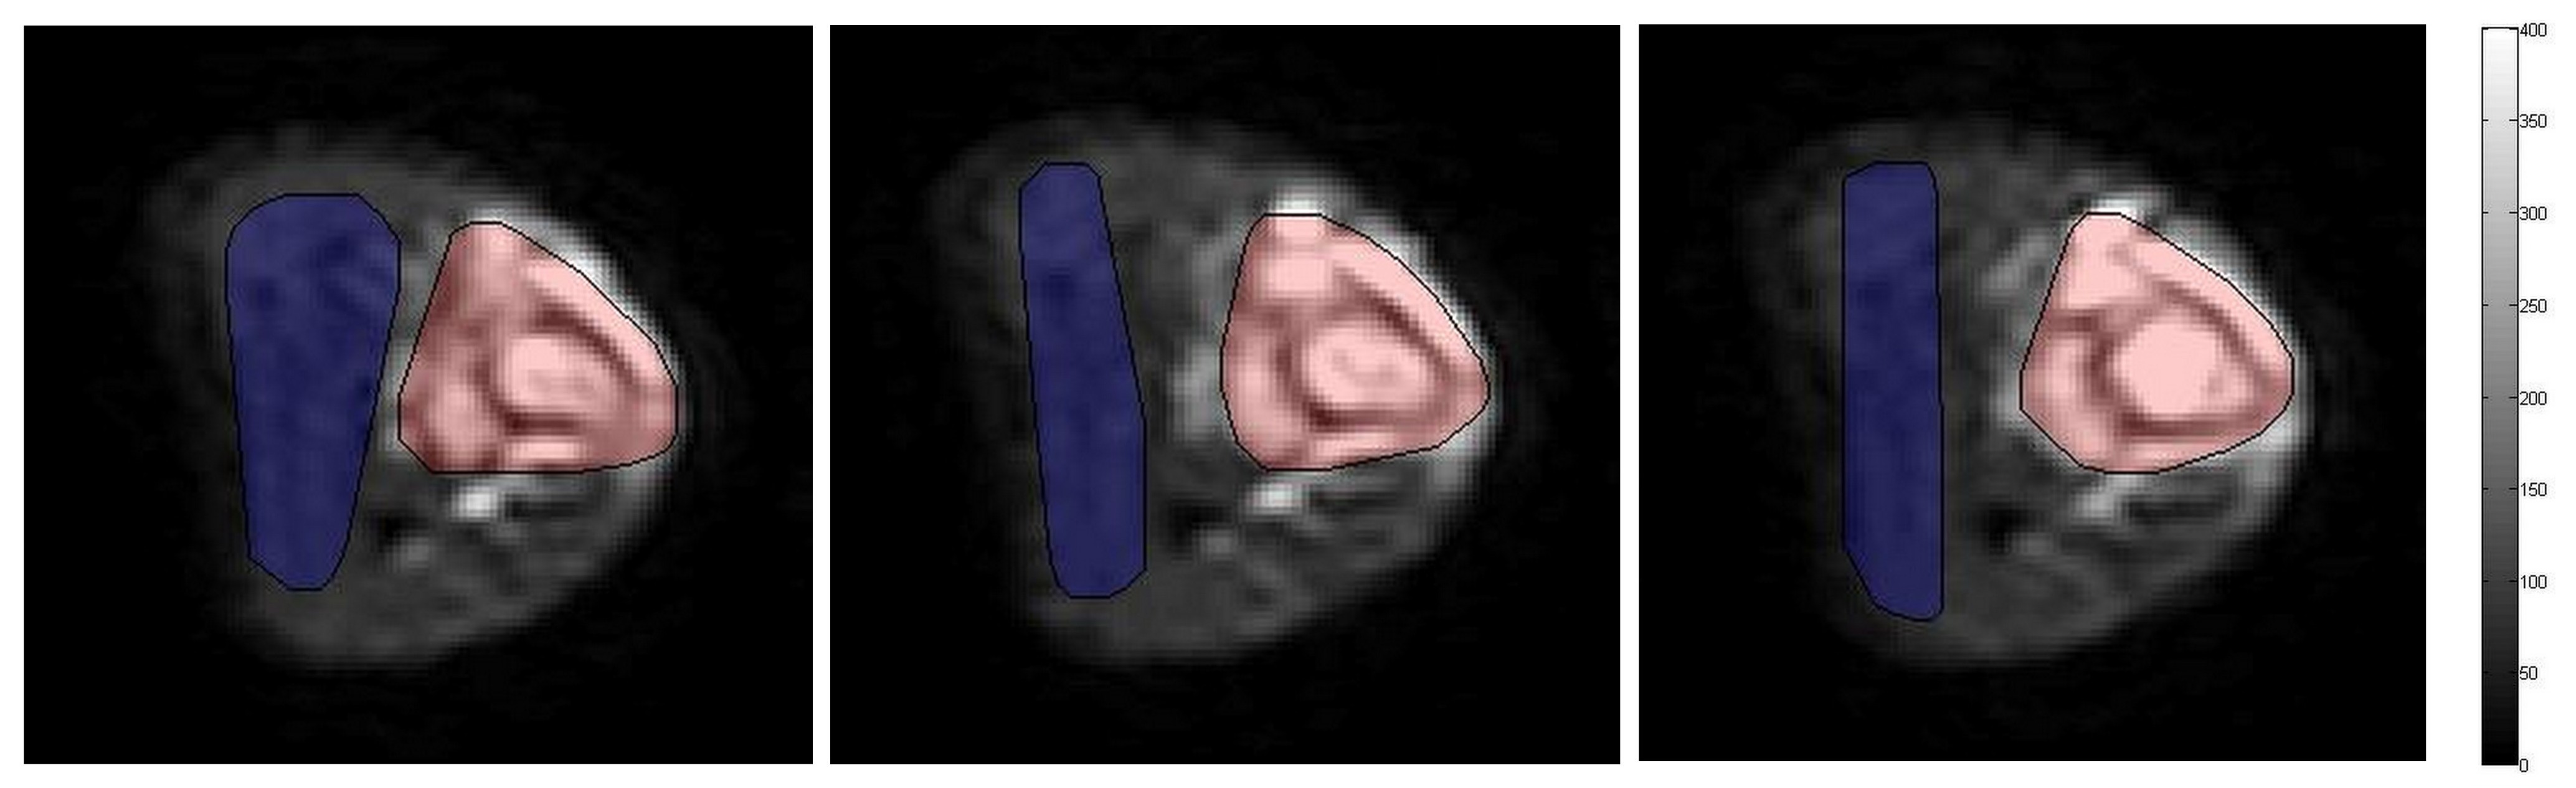
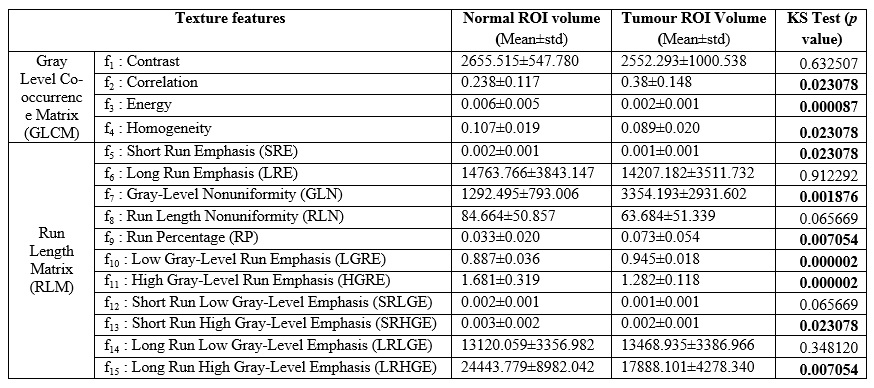
Region of interest (ROI) for tumour and normal tissue were demarcated on each slice manually by a radiologist (>10 years of experience) for all DWI data. Figure1 depicting three DWI slices of a representative patient with ROIs drawn for tumour and normal tissue. For texture analysis, first, ROIs were reduced from 16 bit (65536 gray levels) to 8 bit (256 gray levels), to reduce computational complexity and improve signal-to-noise ratio (SNR). Textural features (elaborated in Figure2) using Grey Level Co-occurrence Matrix (GLCM)3 giving 4 features (f1-f4) and Run Length Matrix (RLM)4,5 giving 11 features (f5-f15), were extracted for tumour and normal tissue ROIs across all slices of each patient, to provide a complete assessment of tissue volumes. GLCMs that contain the joint probability of two adjacent voxels were calculated in four directions (00,450,1350&1800) at voxel co-occurrence distance of 5 and subsequently averaged out. RLMs that contain the probability of run lengths (number of consecutive, collinear voxels having same gray level) of present gray levels were also calculated in similar four directions as GLCM and averaged out. Non-parametric two-sampled Kolmogorov–Smirnov (KS) test was performed on texture features in normal and tumour ROI volumes with p<0.05 for statistical significance. ROC curve analysis was performed to measure the performance of textural features in discriminating normal and tumour ROIs. Textural feature extraction and statistical analysis were performed using an in-house built toolbox in MATLAB and SPSS v.15.0 software.
Results
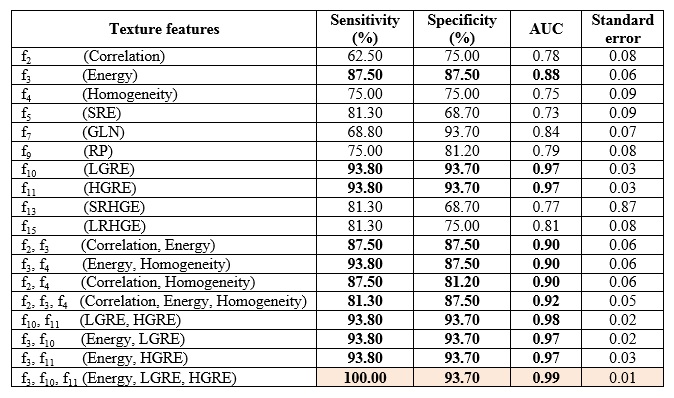
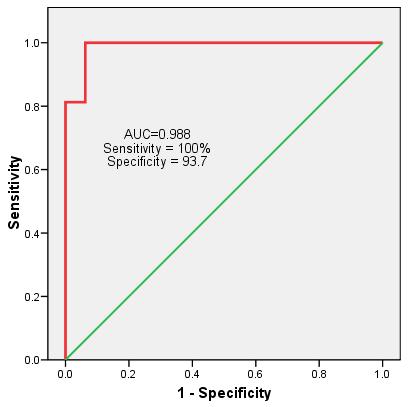
Figure2 shows the mean±standard deviation and p-values for all fifteen texture features used individually for differences between normal and tumour ROI volume. Three GLCM features f2,f3,f4 and seven RLM features f5,f7,f9-f11, f13 &f15 demonstrated significant discrimination among the groups. ROC curve analysis for these 10 significant features is represented in Figure3. Among GLCM features, f3 individually achieved sensitivity and specificity of 87.5% for both (AUC=0.88, cutoff-value=0.0026) in separating normal and tumour ROIs. Whereas, RLM features f10&f11 both individually provided highest sensitivity and specificity of 93.8%&93.7% respectively (AUC=0.97, cutoff-value=0.9247&1.3967 respectively) among all texture features. Different combinations of GLCM and RLM features produced good performance (AUC≥0.90 and sensitivity & specificity both≥80%) in differentiating two groups (Figure3). Combination of texture features f3,f10&f11 produced the highest 100% sensitivity and 93.7% specificity (AUC=0.99) among all feature combinations studied in discriminating normal and tumour ROIs (Figure4 showing ROC analysis).Discussion
GLCM features f3,f4 measure the homogeneity in the image. A lower mean values of those features in tumour ROI volume indicates heterogeneous environment in the tumour than normal ROI volume. RLM features f5&f7 also emphasis local homogeneity and gray-level-non-uniformity in image respectively. Lower f5 and higher f7 in tumour ROI volume might also be supportive to non-uniformity present in the tumour tissue. Features f10-f15 emphasis the joint distribution properties of both run lengths and gray levels. Among them f10&f11 were found more robust in discriminating two groups. TA showed promising result in discriminating normal and tumour tissue in baseline DWI. Future research to be carried out to evaluate the role of TA in response evaluation to chemotherapy in Osteosarcoma using DWI.Conclusion
Textural features extracted from DWI might provide additional information compared to quantitative medical image analysis and be used as diagnostic and prognostic marker for Osteosarcoma.Acknowledgements
Authors would like to thank the Government of India for the funding support required for the study. EBK was supported with the research fellowship funds from Ministry of Human Resource Development, Government of India.References
1. Ahmed A, et al. J.MagnReson Imaging 2013;38:89-101.
2. Koh D.M., et al. AJR.2007; 188:1622 – 1635.
3. Haralick, R.M. et al. IEEE Trans. Syst., Man, Cybern., vol. SMC-3, pp. 610–621, 1973.
4. Galloway, M.M. Comput. Graphics Image Process., vol. 4, pp. 172–179, June 1975.
5. Dasarathy B. V. et al. Pattern Recognition Letters 1991; 12: 497- 502.
Figures