2902
Correlation of Intra-Voxel incoherent motion (IVIM) imaging and Dynamic Susceptibility Contrast (DSC) MRI for high and low grade gliomas1Dayananda Sagar Institutions, Bangalore, India, 2National Institute of Mental Health, Bangalore, India
Synopsis
The aim of this study was to validate the feasibility of Intravoxel Incoherent Motion (IVIM) imaging of human brain gliomas; and to differentiate between high grade and low grade gliomas using IVIM parameters (f, d, D, fD*). These parameters were then compared to CBV maps obtained through DSC-MRI to evaluate the role of non-contrast agent based perfusion imaging. Results obtained showed that IVIM perfusion fraction f could be used to differentiate between high and low-grade brain gliomas
Purpose
The assessment of perfusion characteristics of tumors
using Dynamic Susceptibility Contrast (DSC) has been an important part of
clinical diagnosis and evaluation. 1,2 Goal of this work is to study
the feasibility of IVIM imaging as compared to DSC on gliomas. This would potentially
enable repeated MR imaging of such patient population without the need for
contrast administration.Methods
The local Ethics Review Board (ERB) approved the study. Patient data was obtained after oral informed consent. A total of 24 patients with histologically proven cases of glioma were enrolled in this study (18 men and 6 women, mean age 38.8 ± 18.6, range 12-66 years), from February 2015 to May 2016. DSC and IVIM data were acquired on a 3T clinical scanner (Achieva TX, Philips) with an 8-channel head coil. DSC imaging was performed using gadolinium-based agent (gadoterate meglumine) that was intravenously injected at a dose of 0.2 mL/kg of body weight and at a rate of 3 mL/s, followed by a 20-mL saline flush. Standard echo-planar images were consecutively acquired (TR/TE=1950/43 ms, section thickness = 6 mm, acquisition matrix = 128 X 128). CBV, MTT, and CBF maps were computed from the DSC MR imaging data. IVIM imaging was performed using a single-shot spin echo imaging diffusion sequence; with 15 b-values varying from 0 to 900 s/mm2 (0-200: low b-values and 200-900: high b values) in 3 orthogonal directions and the corresponding trace was calculated. Images were acquired in axial plane with a slice thickness of 4mm, an FOV of 230 X 230 mm2, a matrix size of 256 × 256, with in-plane resolution of 0.89 and TR/TE: 4000/105ms. The standard IVIM bi-compartmental diffusion was used to estimate signal attenuation. A paired t-test was used to evaluate the difference between tumor and contralateral healthy white matter sites on both HGG and LGG cases. The Pearson correlation coefficient ‘r’ between IVIM perfusion fraction f and DSC CBV was calculated and scatter-plotted for each measure. The box-whiskers plots comparing LGG and HGG were plotted only for parameters obtained from IVIM-DWI. Bland-Altman analysis was used to assess agreement (with 95% limits of agreement) between DSC derived CBV and IVIM derived f.Results
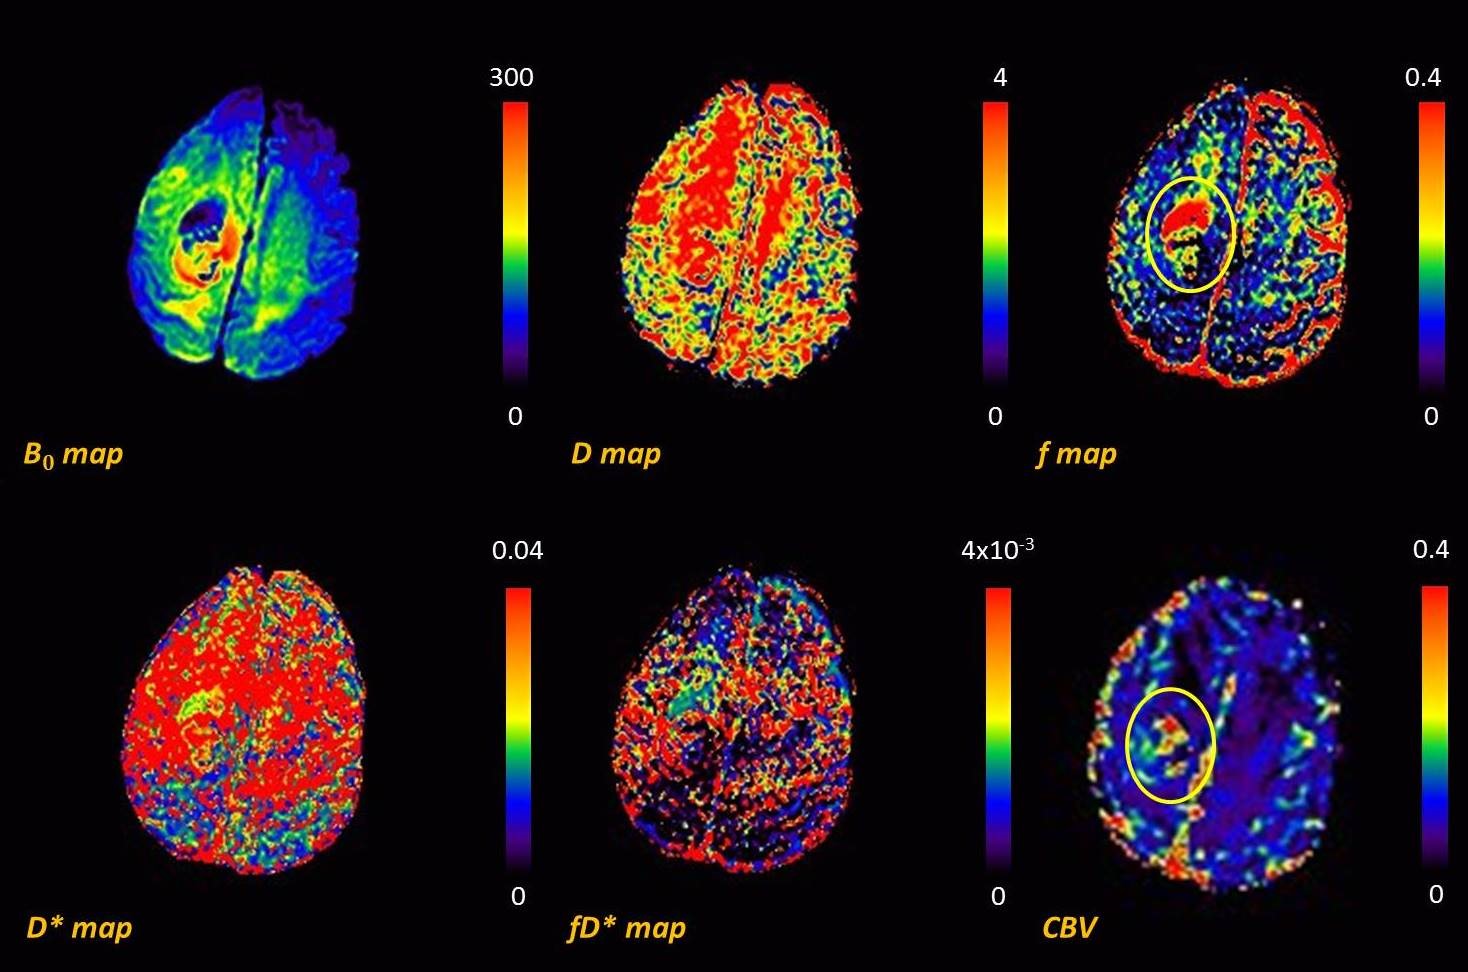
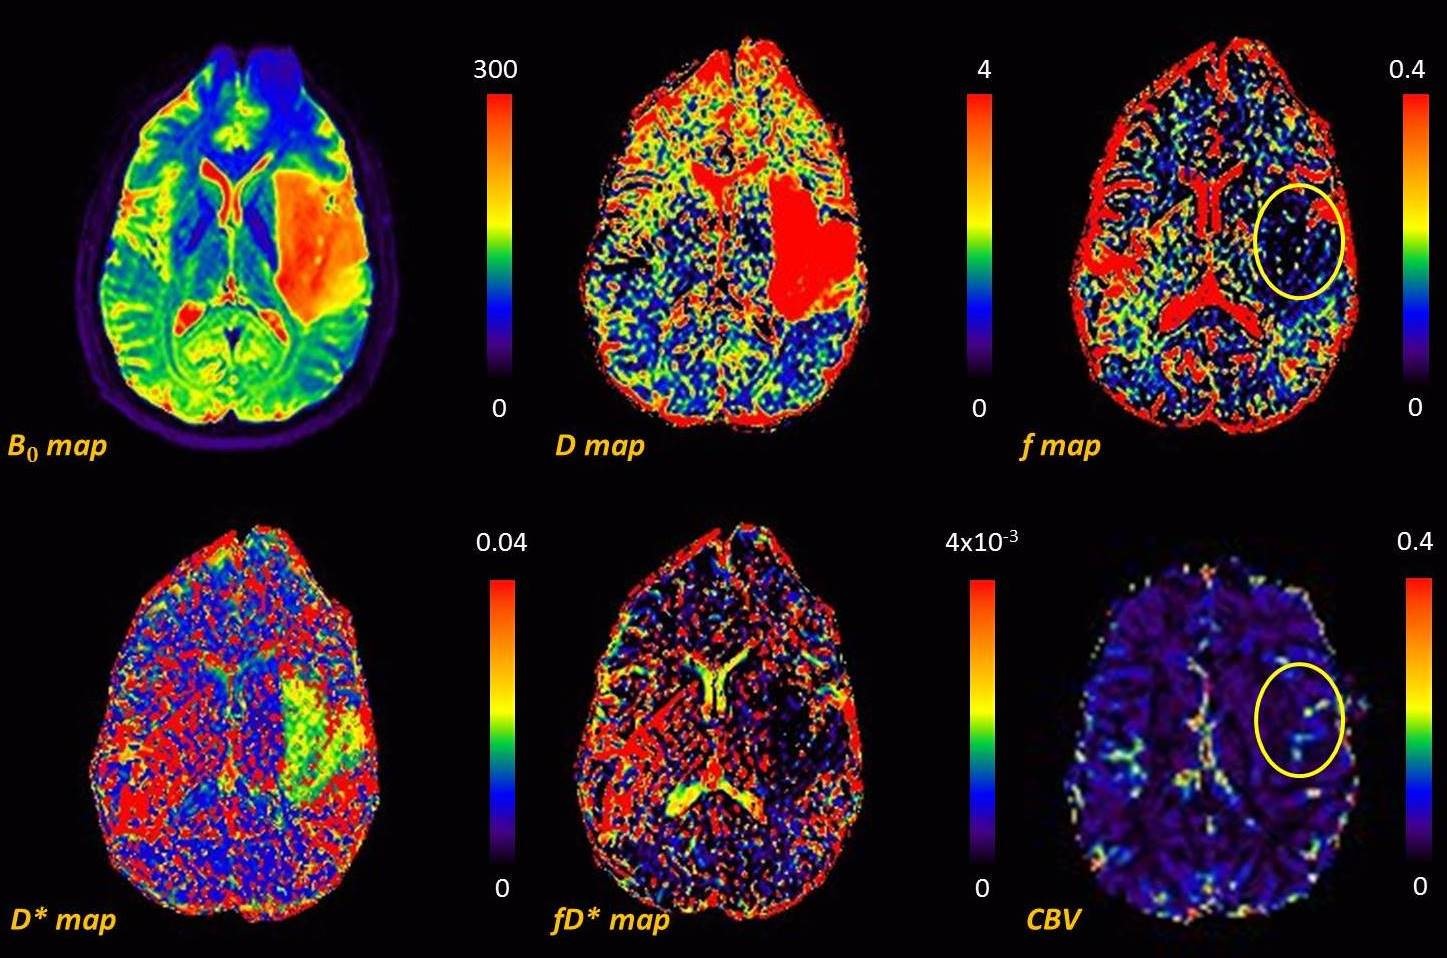
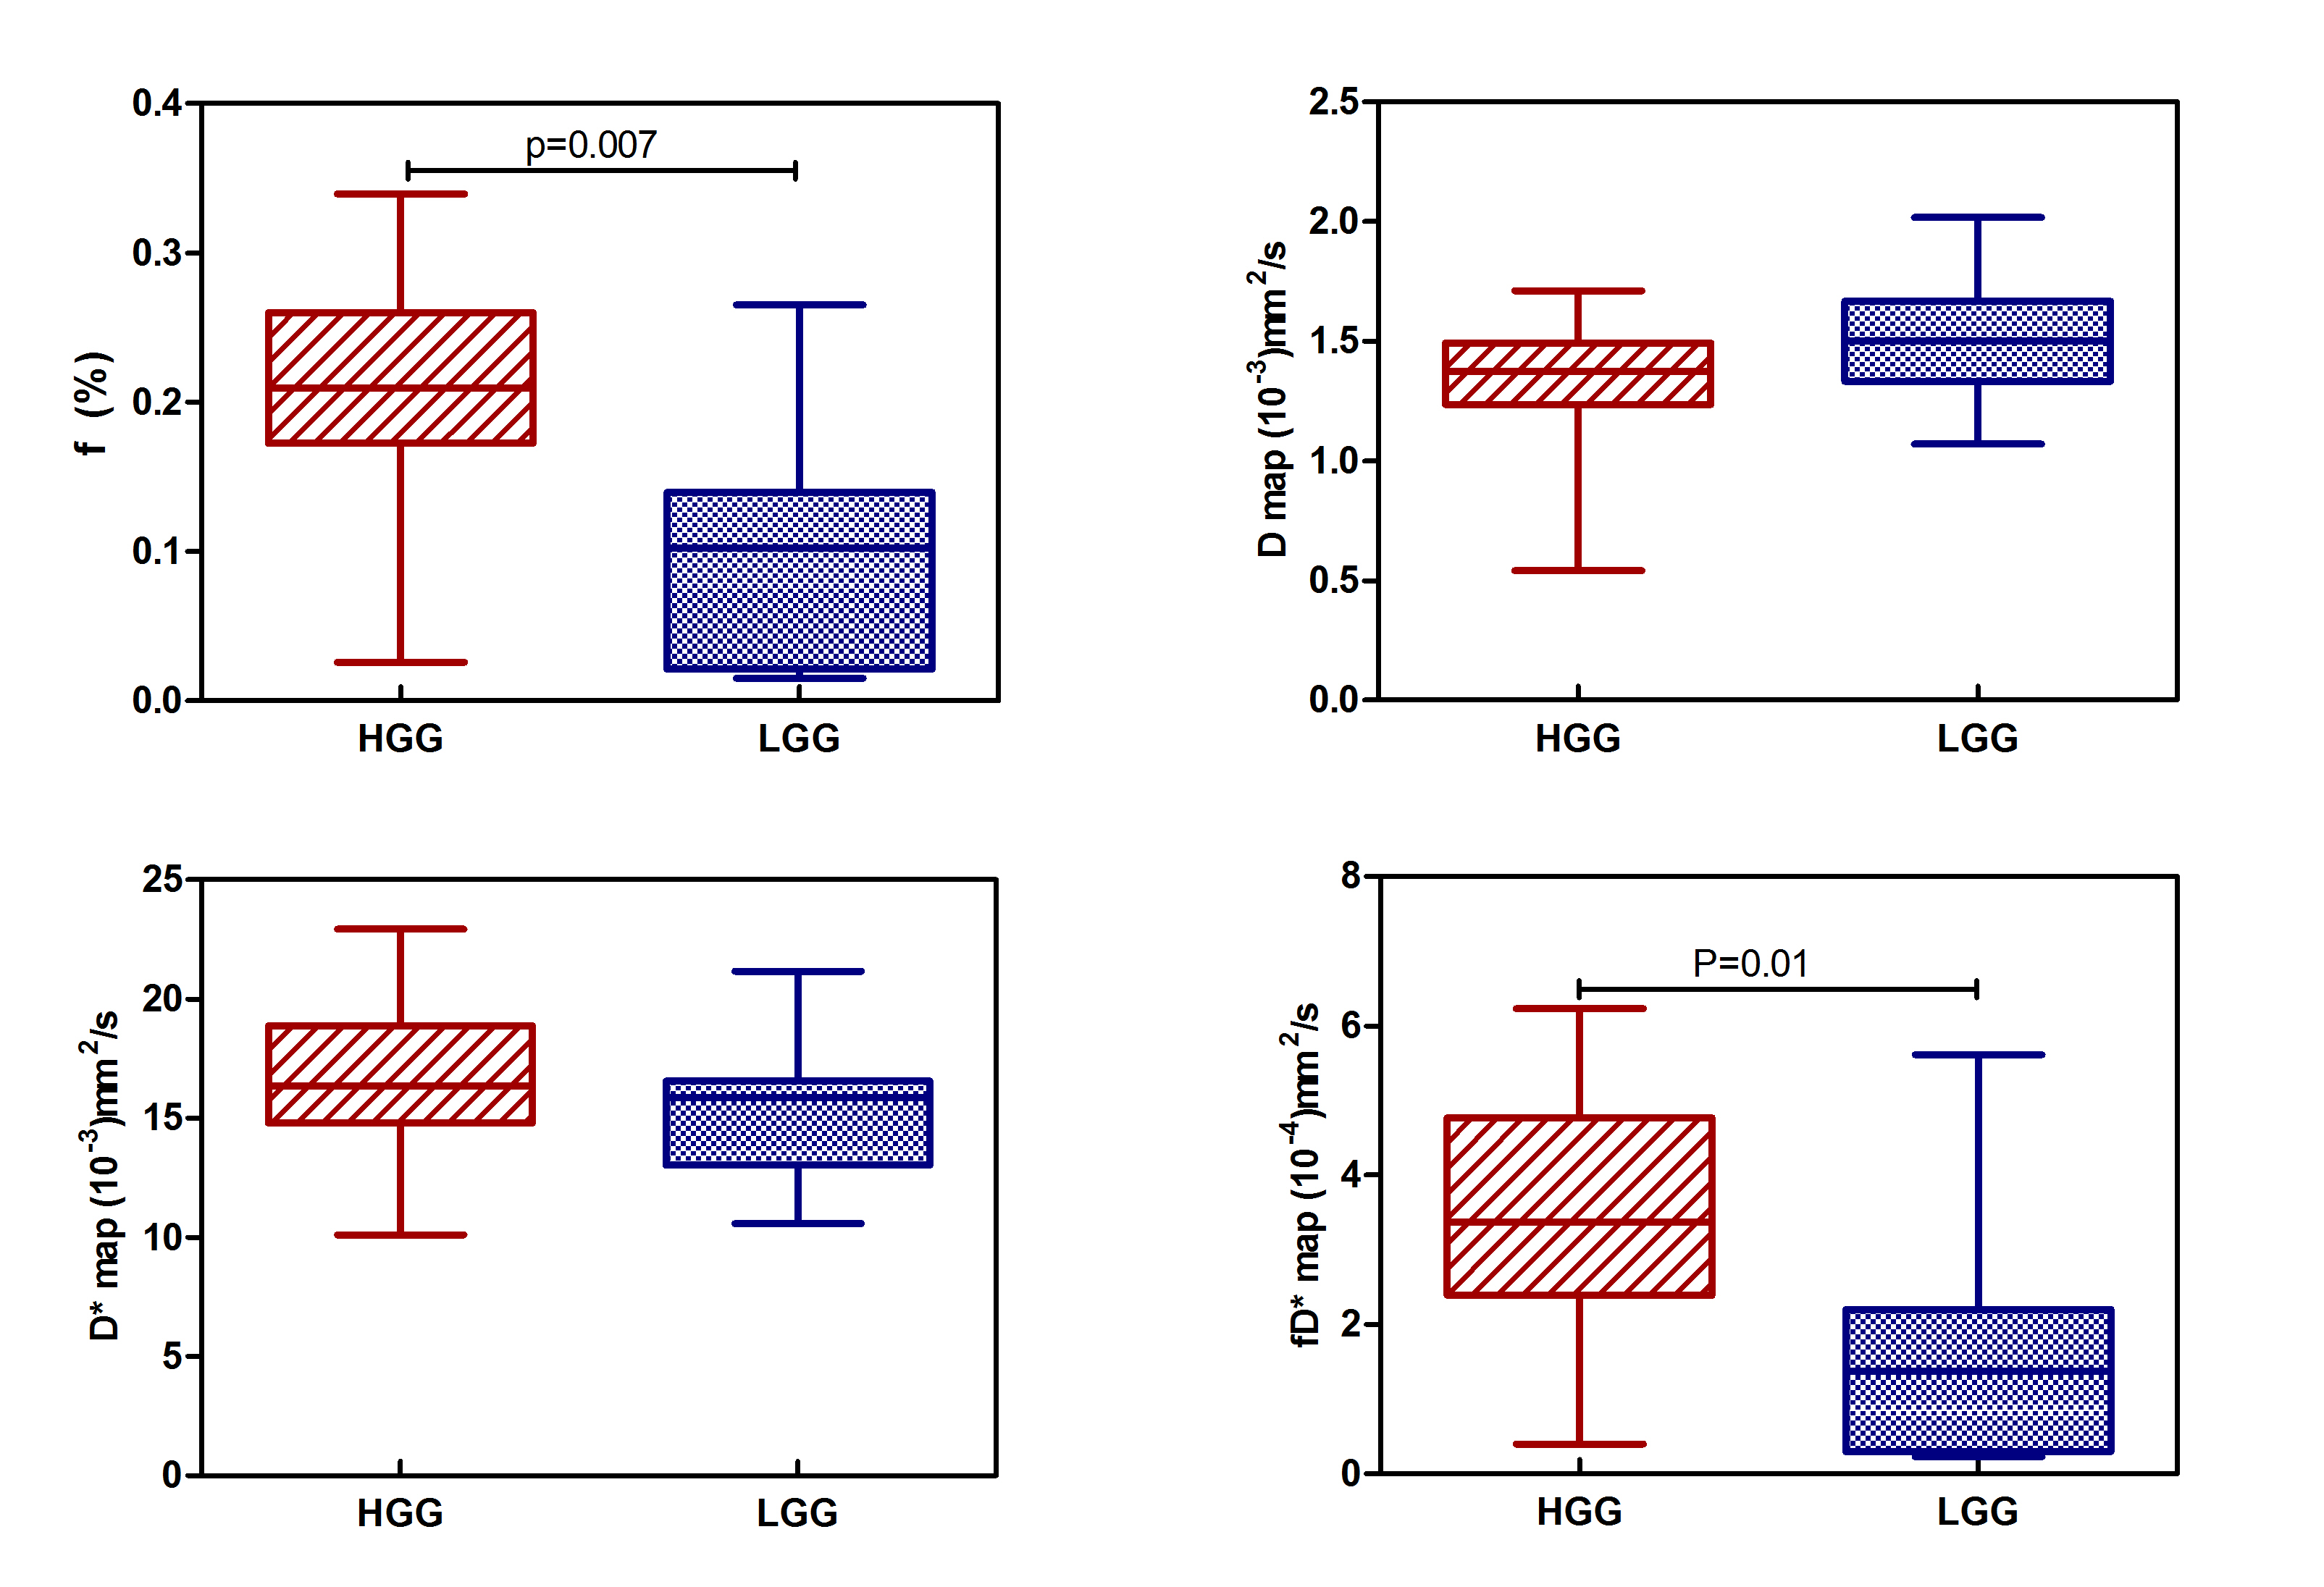
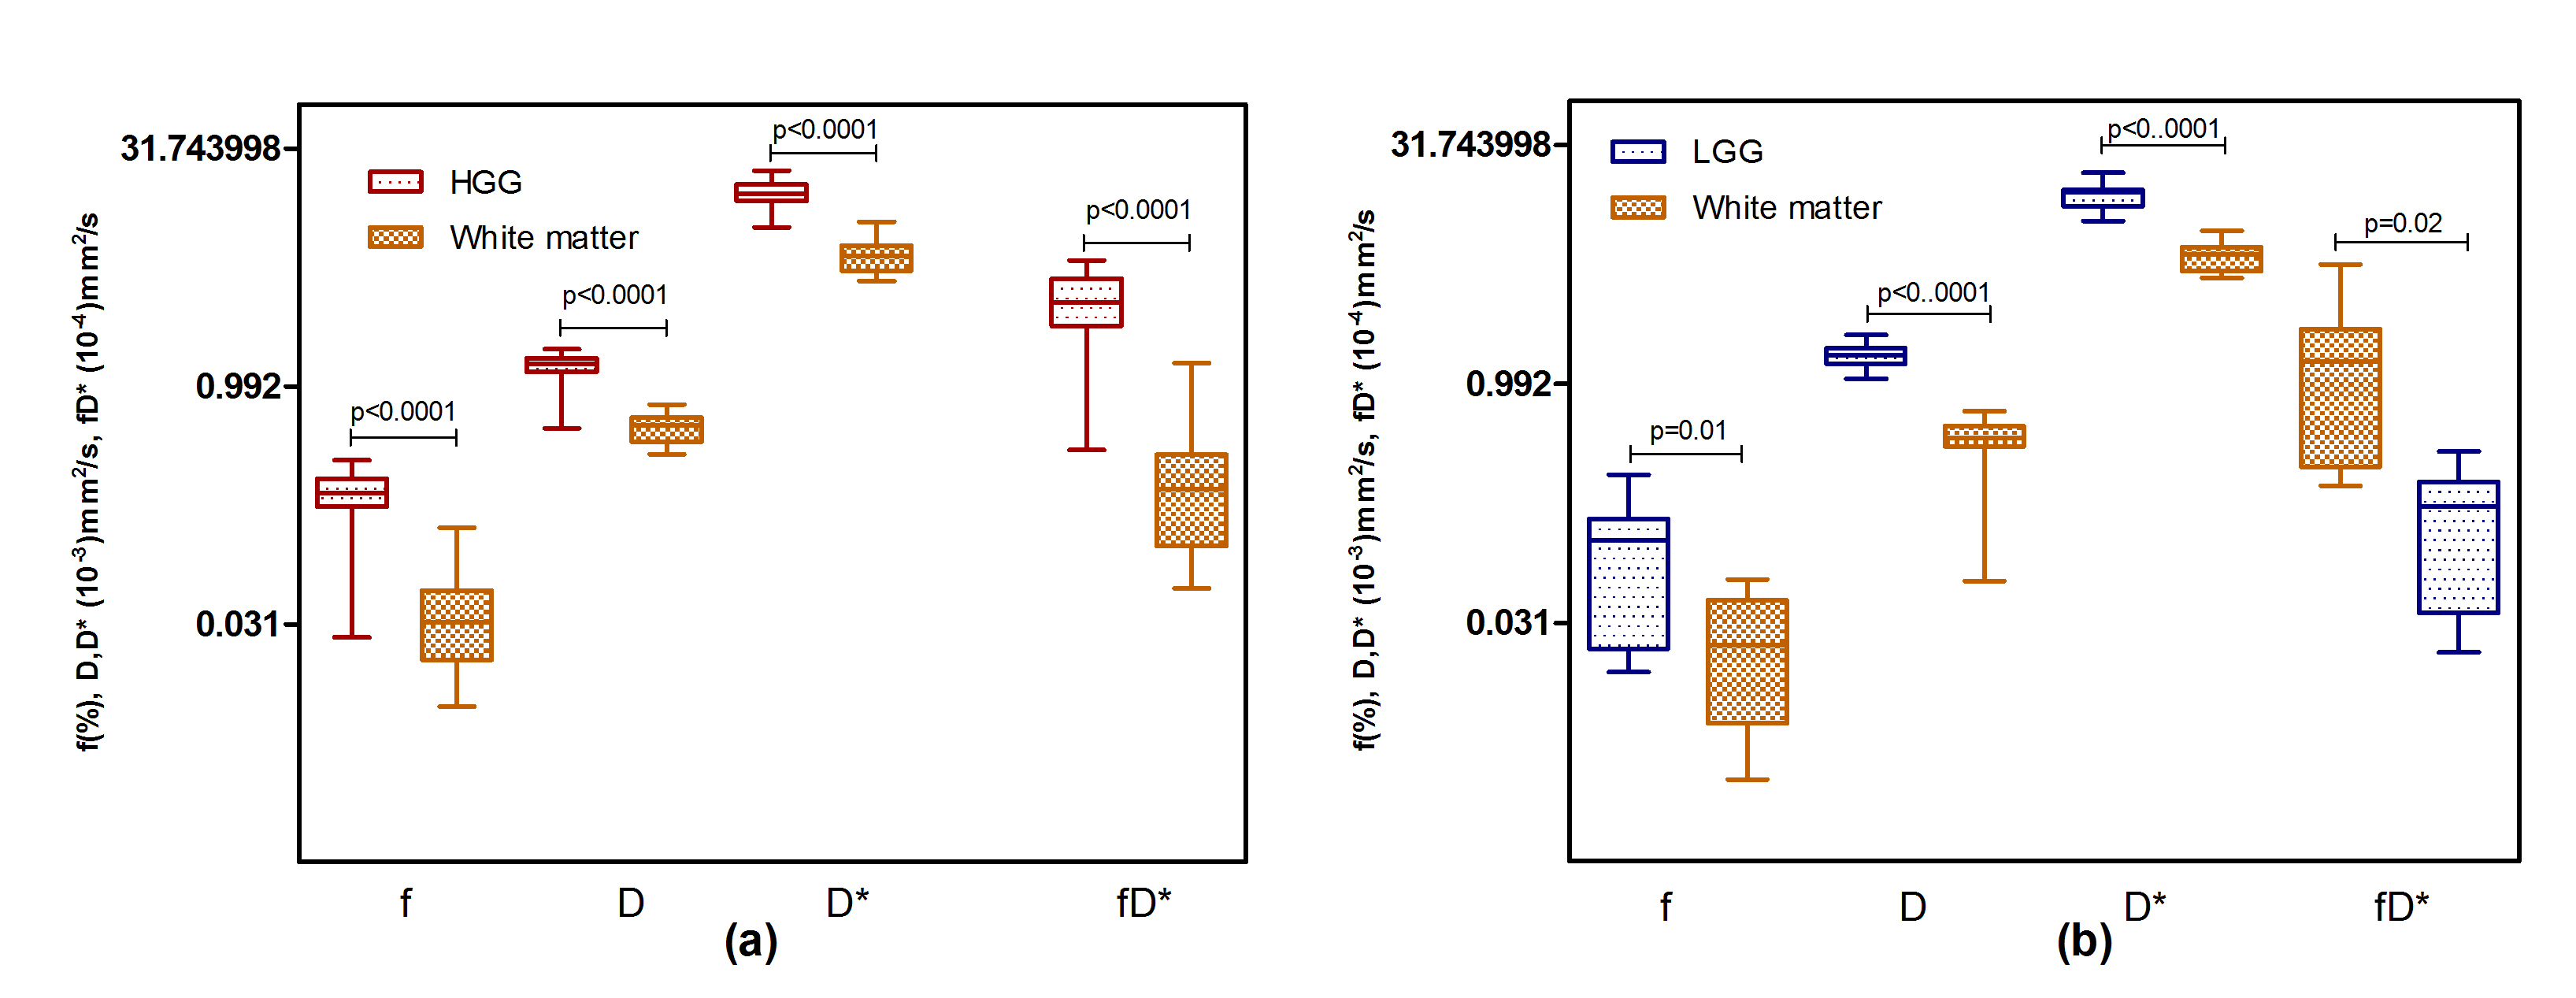
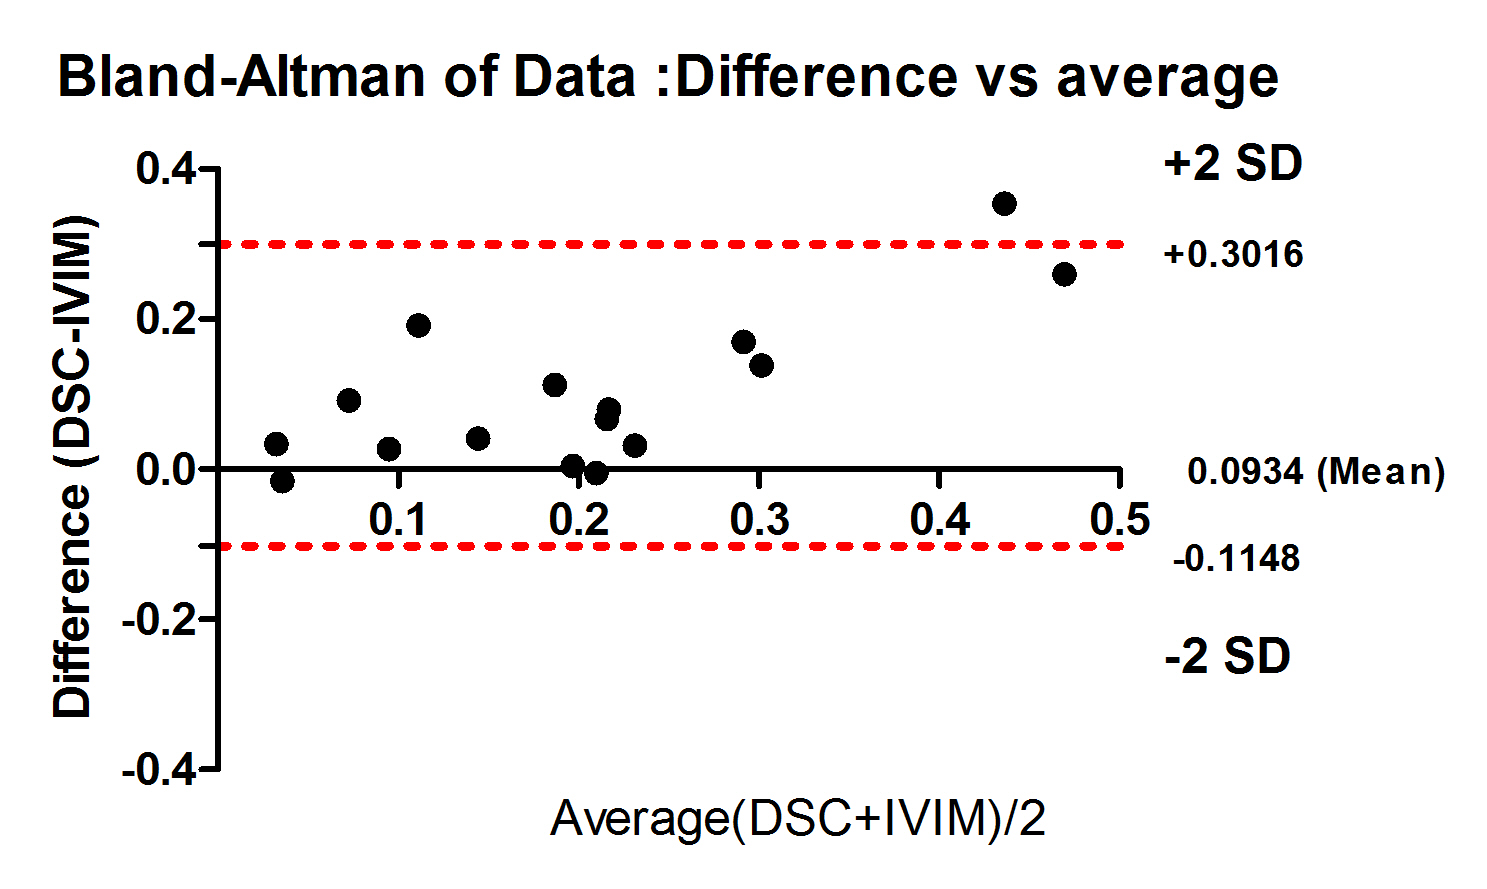
Fig 1 shows the representative multi-parametric MR maps for a patient with HGG. The diffusion and pseudo-diffusion maps show a negative correlation. The perfusion fraction f and DSC derived CBV maps depict a positive correlation in the right parietal lobe, marked in a yellow ellipse. Fig 2 shows corresponding MR parametric maps derived from IVIM and DSC for a representative LGG patient. The D and fD* maps show differences in contrast whereas the f and CBV map show hyper intensities in the left parietal lobe. Fig 3 shows the box-whisker plots comparing the four MR parametric maps for the HGG and LGG patients, while showing the range of these values. The perfusion fraction f and the flow related parameter fD* showed statistically significant differences (p<0.001) between the two tumor grades, with the LGG showing lesser perfusion than HGG. This information could be used as a biomarker for differentiation between the grades. LGG tumor regions had comparatively similar mean values of D as compared to HGG (p=0.90). HGG tumors were characterized by a moderately increased pseudo-diffusion coefficient D* as compared to LGG with no statistically significant difference (p=0.34). Fig. 4a & 4b depicts the differences in the four MR parameters between the two tumor grades and the corresponding contralateral white matter. Both glioma groups showed statistically significant higher f, D, D* and fD* values, as reported in earlier studies.3,4 Fig 5 depicts Bland-Altman analyses showing the correlation between DSC derived CBV and IVIM derived f maps. The difference ranged from -0.1148 lower LOA to 0.3061 upper LOA. It can be noted that there were no statistically significant difference between them and majority of the measured differences were positive. This shows that the two methods are positively correlated.Discussion
In this study, perfusion fraction f values are in reasonable agreement with conventional CBV values obtained from DSC.4,5 D*and fD* maps suffered from poor signal to noise ratio (SNR). Therefore, the perfusion factor f could be a reliable biomarker for differentiation of the two tumor grades.Acknowledgements
This work was supported by Department of Electronics and Information Technology (DEITY/1(15)-2014 ME& HI)References
[1] S. Ulmer, C. Liess, S. Kesari, N. Otto, T. Straube, and O. Jansen, “Use of dynamic susceptibility-contrast MRI (DSC-MRI) to assess perfusion changes in the ipsilateral brain parenchyma from glioblastoma,” J. Neurooncol., vol. 91, no. 2, pp. 213–220, 2008.
[2] R. Wirestam, M. Borg, S. Brockstedt, A. Lindgren, S. Holtas, and F. Stahlberg, “Perfusion-related parameters in intravoxel incoherent motion MR imaging compared with CBV and CBF measured by dynamic susceptibility-contrast MR technique.,” Acta Radiol., vol. 42, no. 2, pp. 123–128, Mar. 2001. [3] C. Federau, P. Hagmann, P. Maeder, M. Müller, R. Meuli, M. Stuber, and K. O’Brien, “Dependence of Brain Intravoxel Incoherent Motion Perfusion Parameters on the Cardiac Cycle,” PLoS One, vol. 8, no. 8, pp. 1–7, 2013.
[4] S. Bisdas, T. S. Koh, C. Roder, C. Braun, J. Schittenhelm, U. Ernemann, and U. Klose, “Intravoxel incoherent motion diffusion-weighted MR imaging of gliomas: feasibility of the method and initial results.,” Neuroradiology, vol. 55, no. 10, pp. 1189–1196, Oct. 2013.
[5] O. Togao, A. Hiwatashi, K. Yamashita, K. Kikuchi, M. Mizoguchi, K. Yoshimoto, S. O. Suzuki, T. Iwaki, M. Obara, M. Van Cauteren, and H. Honda, “Differentiation of high-grade and low-grade diffuse gliomas by intravoxel incoherent motion MR imaging,” Neuro. Oncol., vol. 18, no. 1, pp. 132–141, 2016.
Figures