2900
DDC and α estimates from the stretched exponential model are more robust to variations in b-value selection than ADC estimates, in a cohort of 42 cervical tumours1Cancer Research UK Cancer Imaging Centre, The Institute of Cancer Research, London, United Kingdom, 2MRI Unit, The Royal Marsden NHS Foundation Trust, Sutton, United Kingdom
Synopsis
The influence of b-value selection on fitted parameters from the stretched exponential model (distributed diffusion coefficient DDC, and ‘stretching parameter’ α) and mono-exponential model (apparent diffusion coefficient ADC) was investigated in a cohort of 42 patients with cervical tumours. Diffusion-weighted images images were acquired using 9 b-values between 0 and 800smm-2, and fitted voxel-by-voxel using all b-values (0 to 800smm-2) and b-values n-to-800smm-2 (where n is 20,40,60,80,100, or 300smm-2). ADC estimates are highly sensitive to b-value selection, with reduction in ADC when low b-values are excluded, whereas DDC and α are more robust to differences in b-value selection.
Background
The attenuation of the diffusion-weighted MRI (DW-MRI) signal with increasing b-value is not fully described by a mono-exponential model and a variety of alternative models have been proposed. Amongst these models, the stretched exponential model has been shown to provide a better description of the DW-MRI signal attenuation than the mono-exponential model in a wide range of tumours.1-3 Fitted parameters (distributed diffusion coefficient DDC, and ‘stretching parameter’ α) exhibit comparable repeatability to the apparent diffusion coefficient (ADC).2,3 However, comparison of fitted parameters between studies is often hindered by variations in imaging protocols, notably b-value selection. Use of a model that is robust to variations in imaging protocol would facilitate comparison between results, for example in multi-centre studies, where the use of identical sequences may not be possible.Purpose
To investigate the robustness of the stretched exponential model to b-value selection by comparing the influence of b-value selection on estimates of DDC and α from the stretched exponential model with ADC from the mono-exponential modelMethods
Patients: Patients with cervical cancer were scanned after informed consent as part of a prospective single-centre study. Forty-two consecutive patients with histologically-proven cervical tumours (24 squamous cell carcinomas, 15 adenocarcinomas, 3 rarer sub-types) and tumour volume at least 50mm3 visible on DW-MRI were included in this exploratory analysis.
Imaging: Hyoscine butylbromide (20 mg) i.m. was administered before scanning to reduce image artefacts due to peristalsis. Patients were scanned on a Philips Achieva 3T MR scanner using an endovaginal coil.4 Following T2-weighted and diffusion-weighted images acquired transversely, coronally and sagitally through the cervix, a coronal DWI sequence with 9 b-values was acquired for assessment of DW-MRI models (b-values 0,20,40,60,80,100,300,500,800smm-2).
Analysis: Regions of interest (ROIs) were drawn on computed diffusion-weighted images (b=800smm-2) using in-house software, with reference to T2-weighted images.5 ROIs were drawn around the whole tumour on all slices on which the tumour appeared. Mono-exponential $$$S(b)=S_0exp(-b\textrm{ADC})$$$ and stretched exponential $$$S(b)=S_0exp(-[b\textrm{DDC}]^α)$$$ models were fitted voxel-by-voxel using least-squares fits (Matlab 2016a). The ‘stretching parameter’, α, was constrained to lie between 0 and 1. Pixels where the signal did not decay montonically with increasing b-value and pixels with fitted S0 below a background noise level in mono-exponential fits were excluded. Fitting was repeated by excluding consecutive low b-values, specifically, fitting to all points between 20 and 800smm-2, 40 to 800smm-2, 60 to 800smm-2, 80 to 800smm-2, 100 to 800smm-2, and 300 to 800smm-2.
Cohort differences were investigated using paired t-tests to assess whether there were differences in parameters estimated by fitting the reduced b-value range compared with fitting the data from all b-values; the median value was used from each tumour. In order to correct for multiple comparisons in this exploratory analysis, p-values less than 0.05 were considered statistically significant, and p-values less than 0.0028 considered highly significant (0.0028=0.05/18, including a correction factor of 3 for three fitted parameters and a factor of 6 for multiple b-value ranges).
Individual differences were assessed by taking the difference voxel-by-voxel between parameters estimated by fitting the model to data from all b-values and parameters estimated by fitting the reduced b-value range.
Results
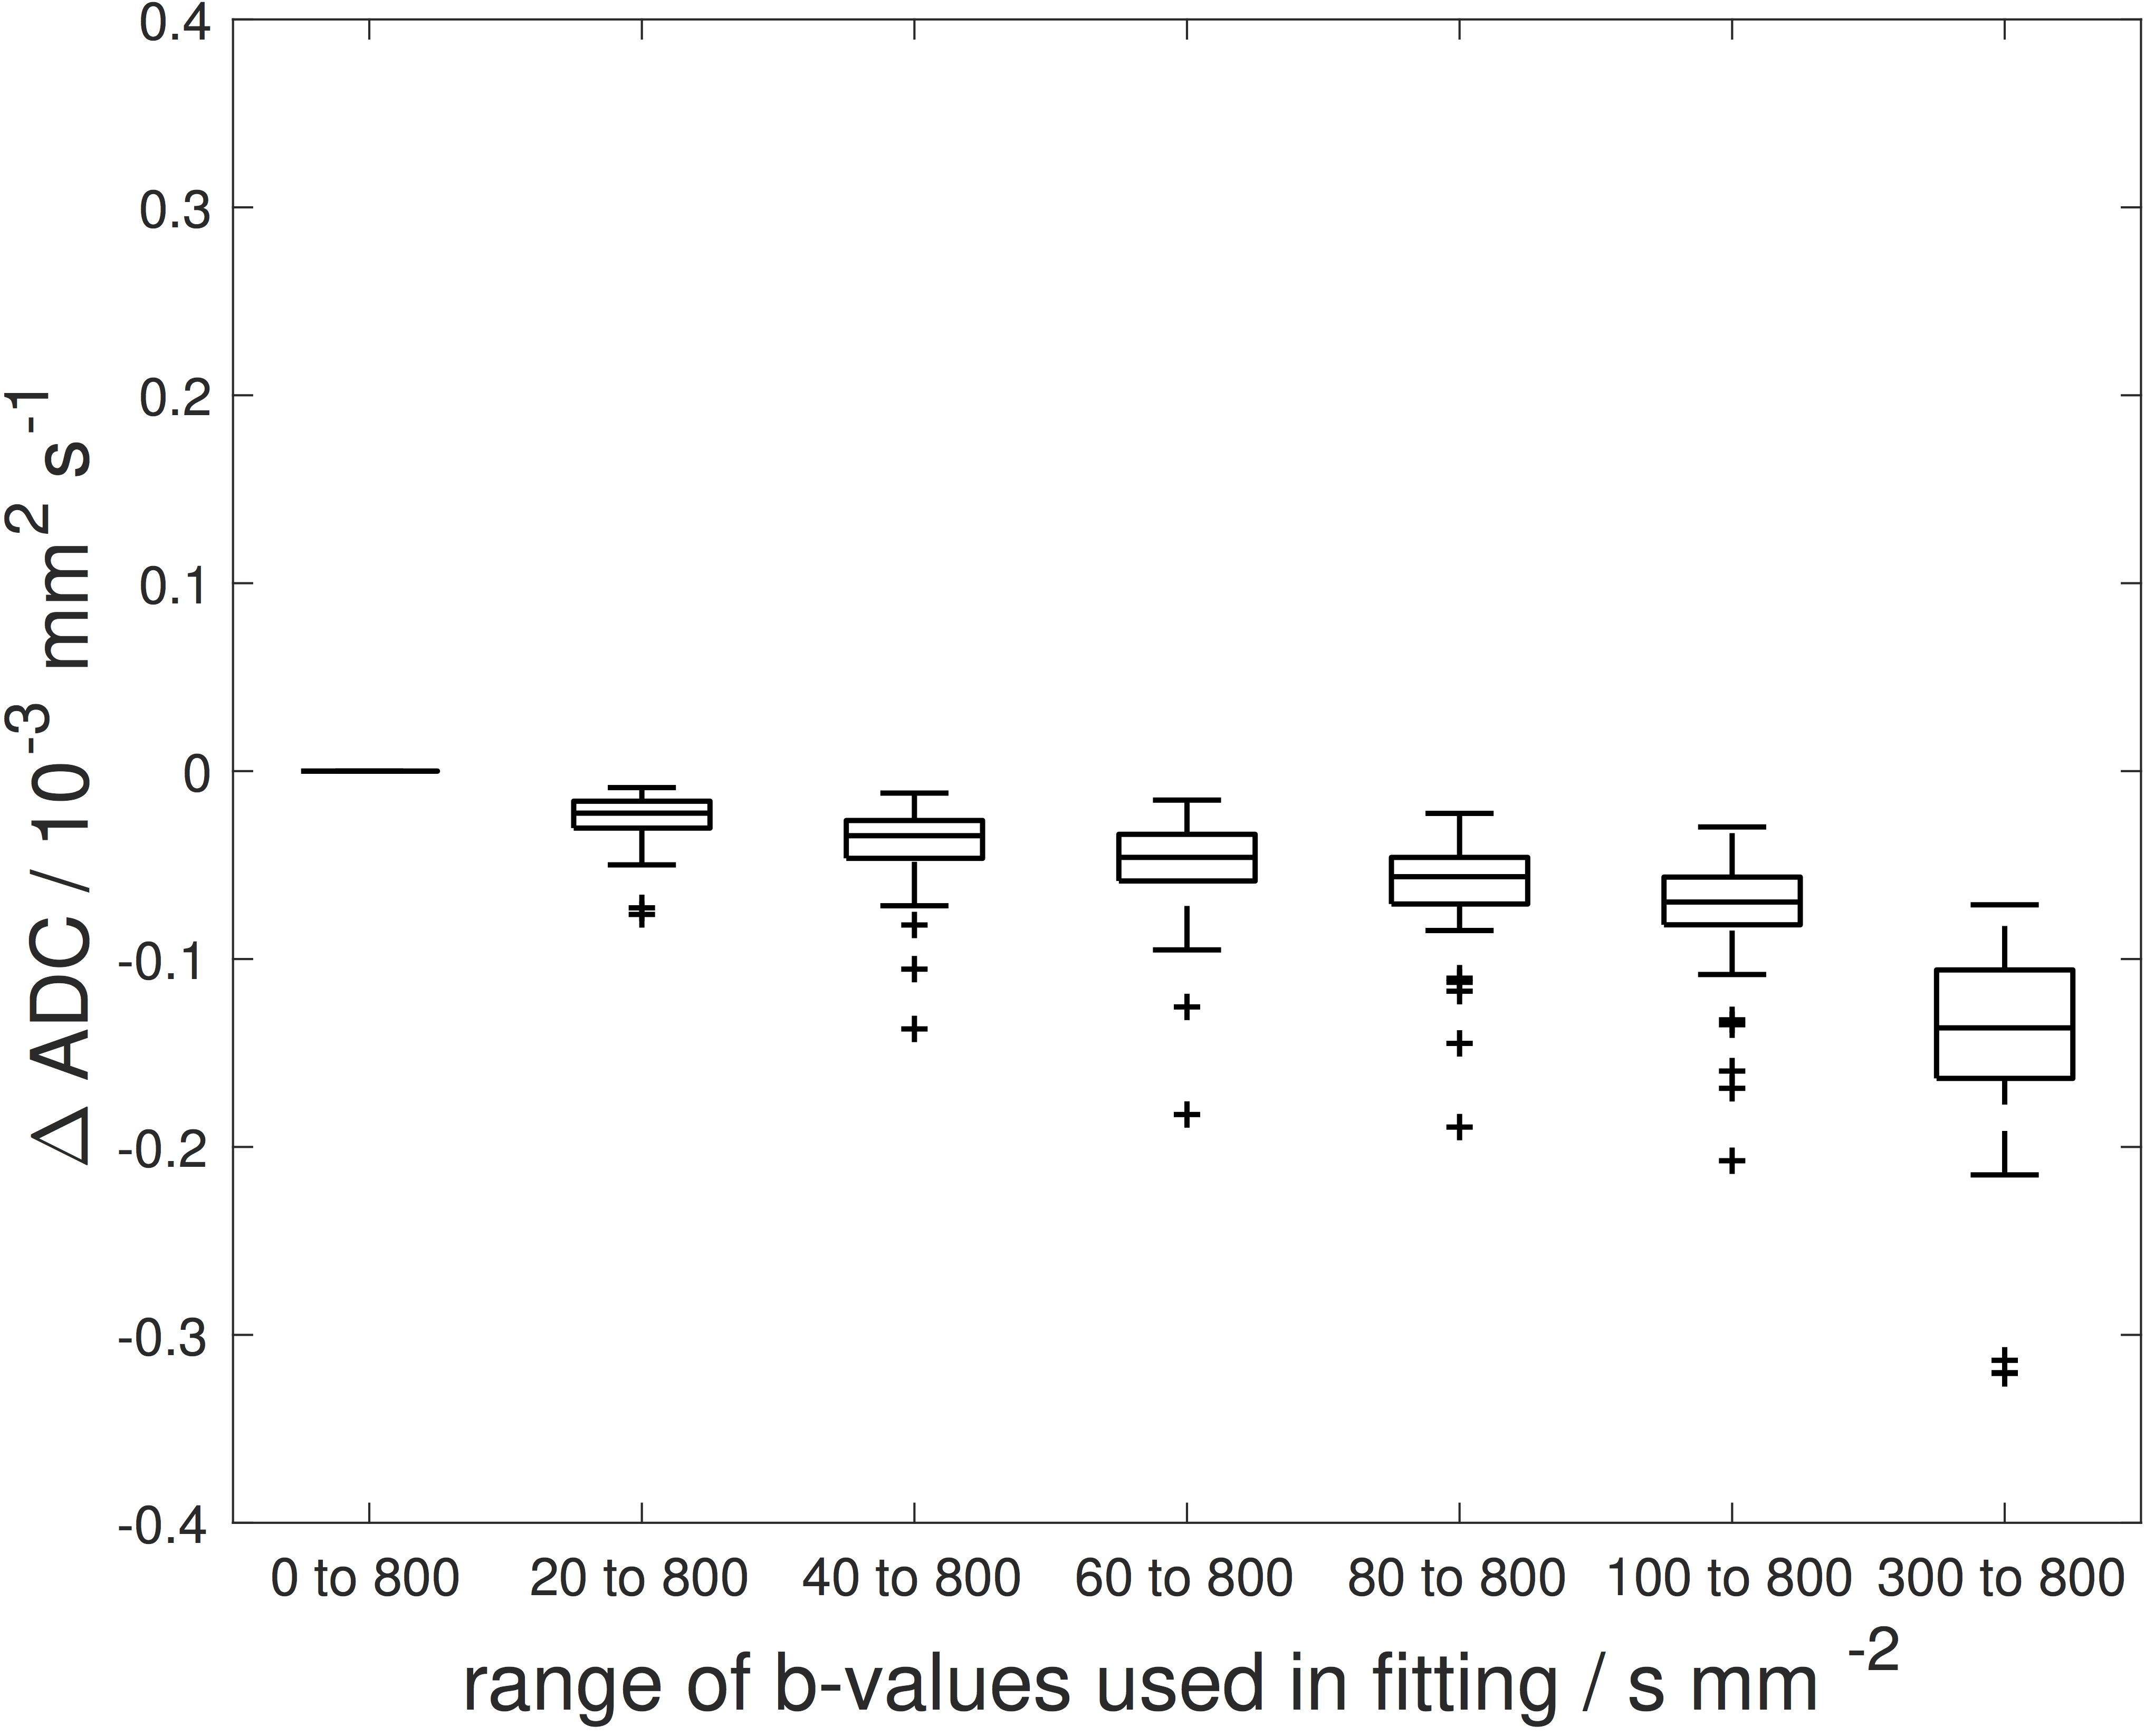
Cohort differences: Median ADC estimates for the cohort were reduced when low b-values were excluded, and were significantly different from ADCs estimated from all b-values (Figure 1). DDC and α exhibited less variation with b-value selection for their estimation. Highly significant differences were seen only when comparing results of fitting from 20 to 800smm-2 with results from all b-values, and for α when comparing results of fitting 300 to 800smm-2 with all b-values (Figure 1).
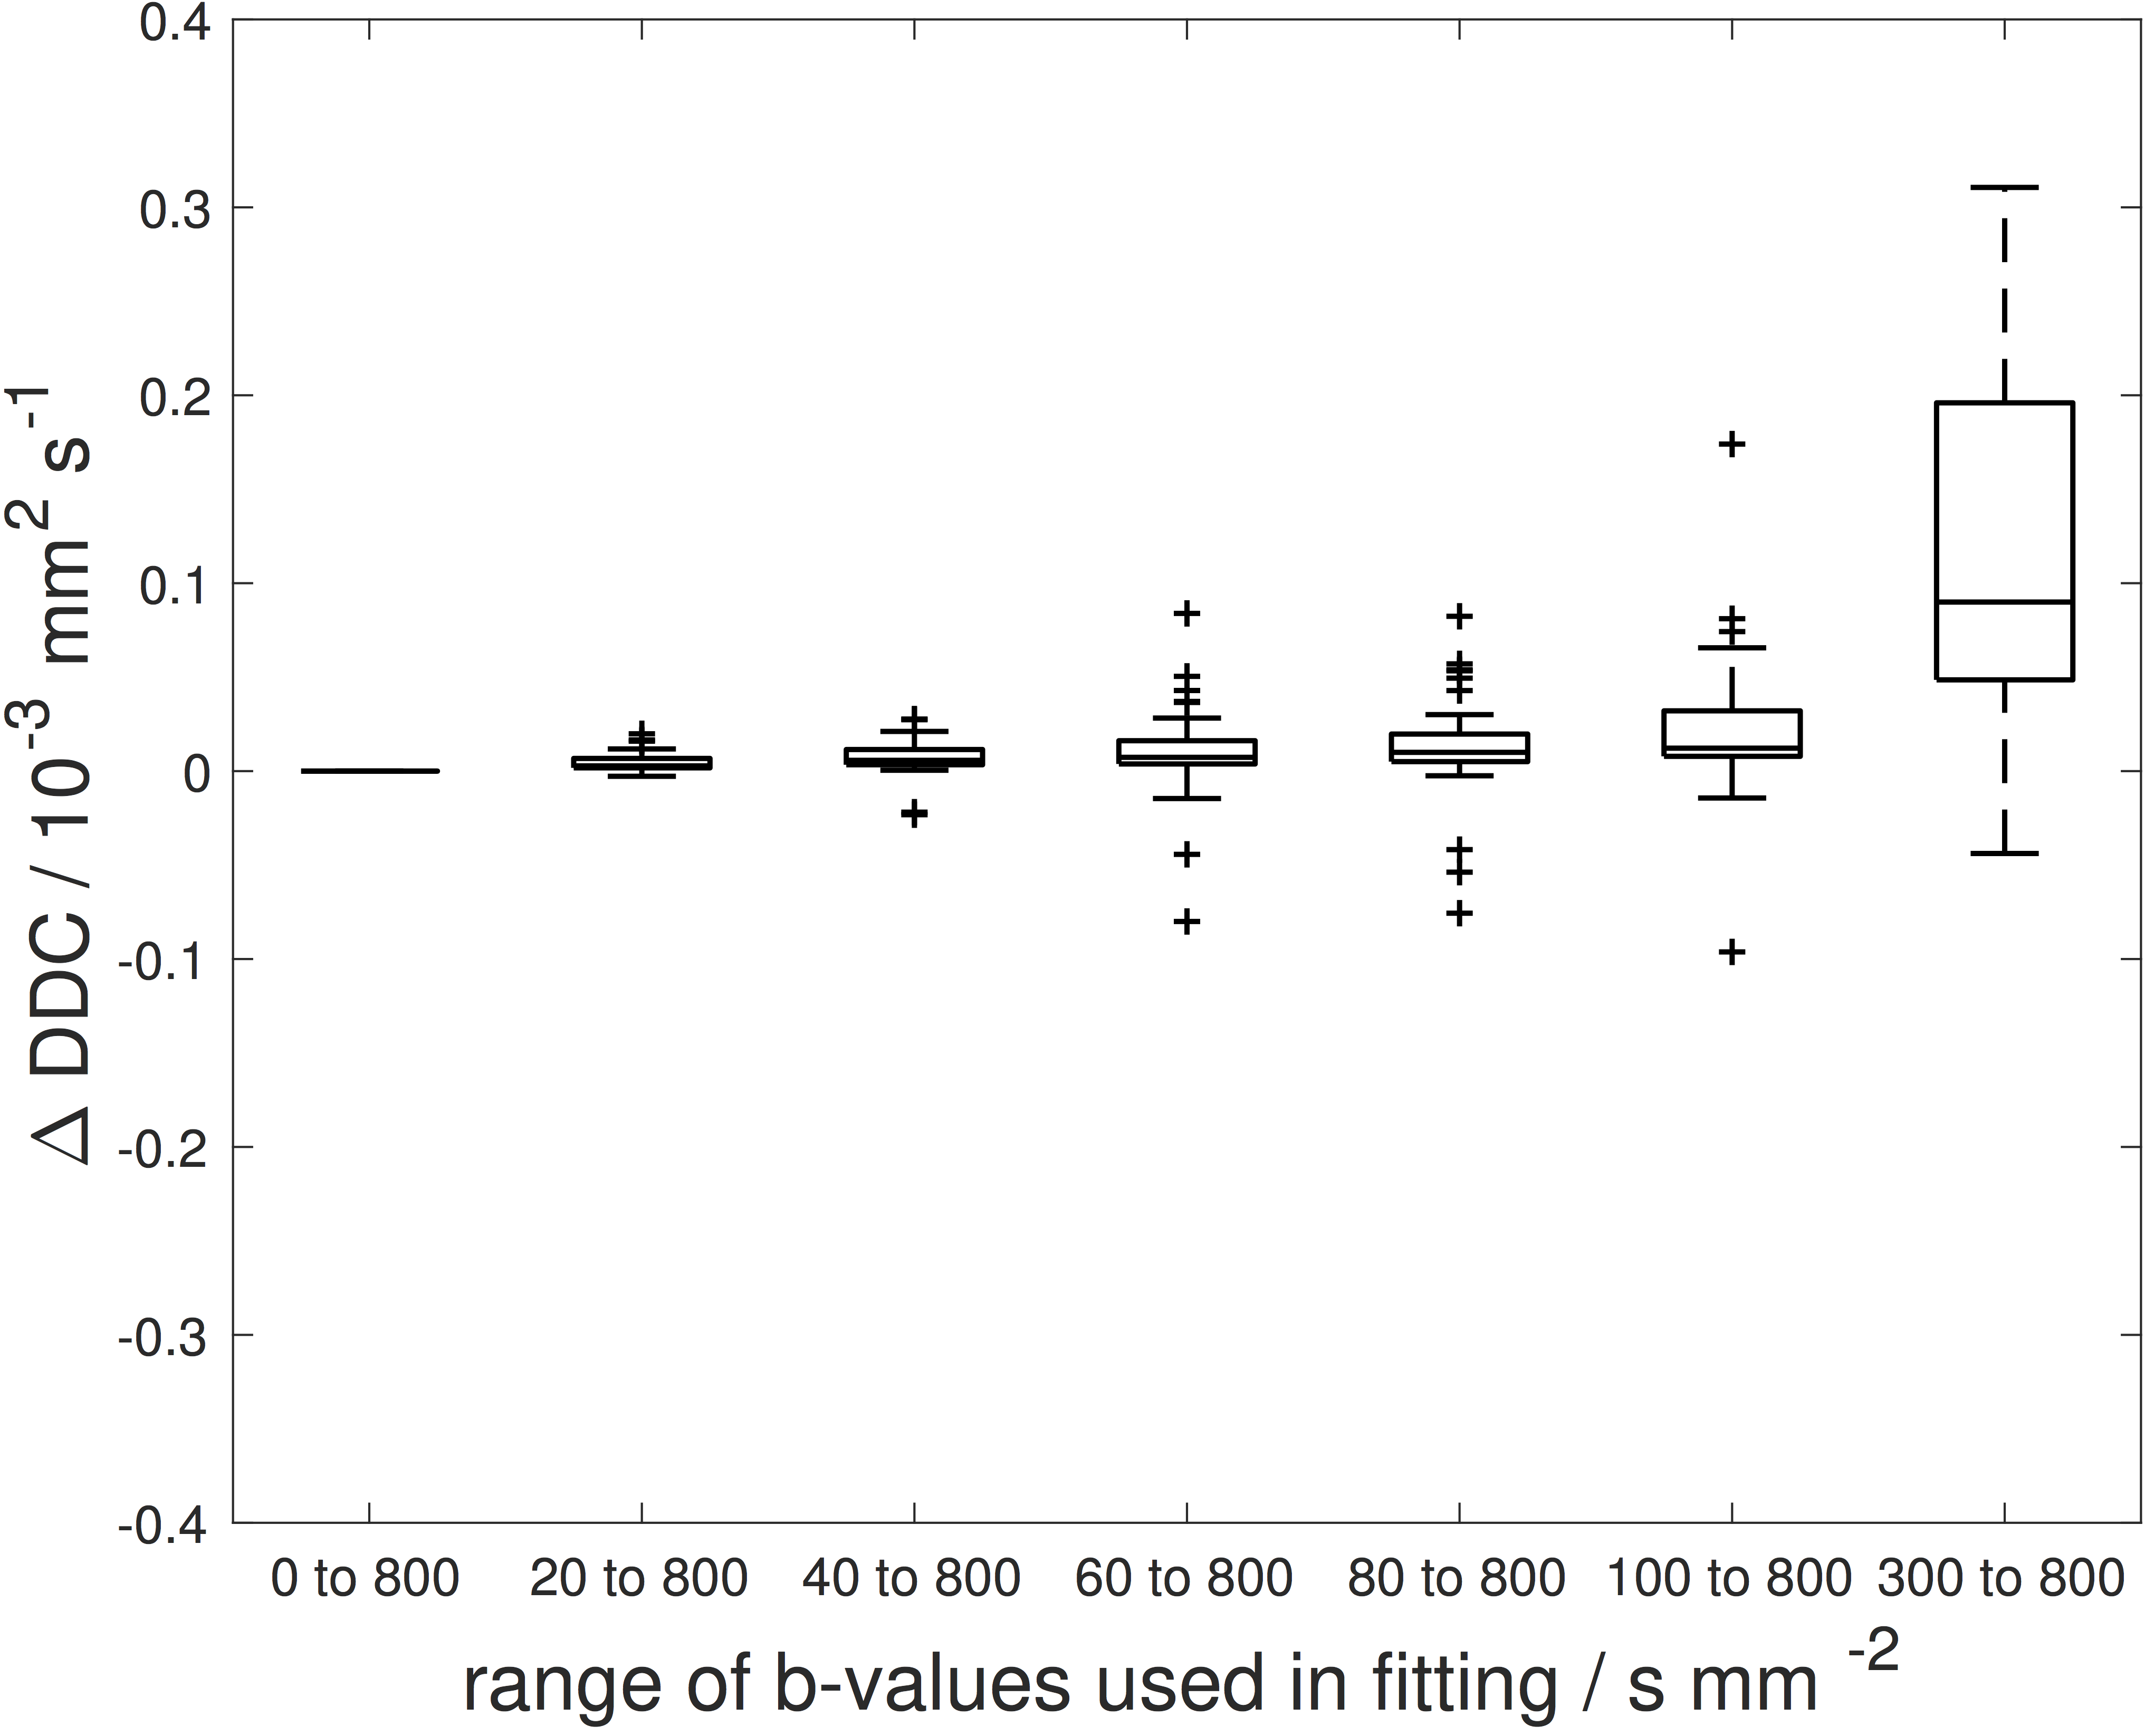
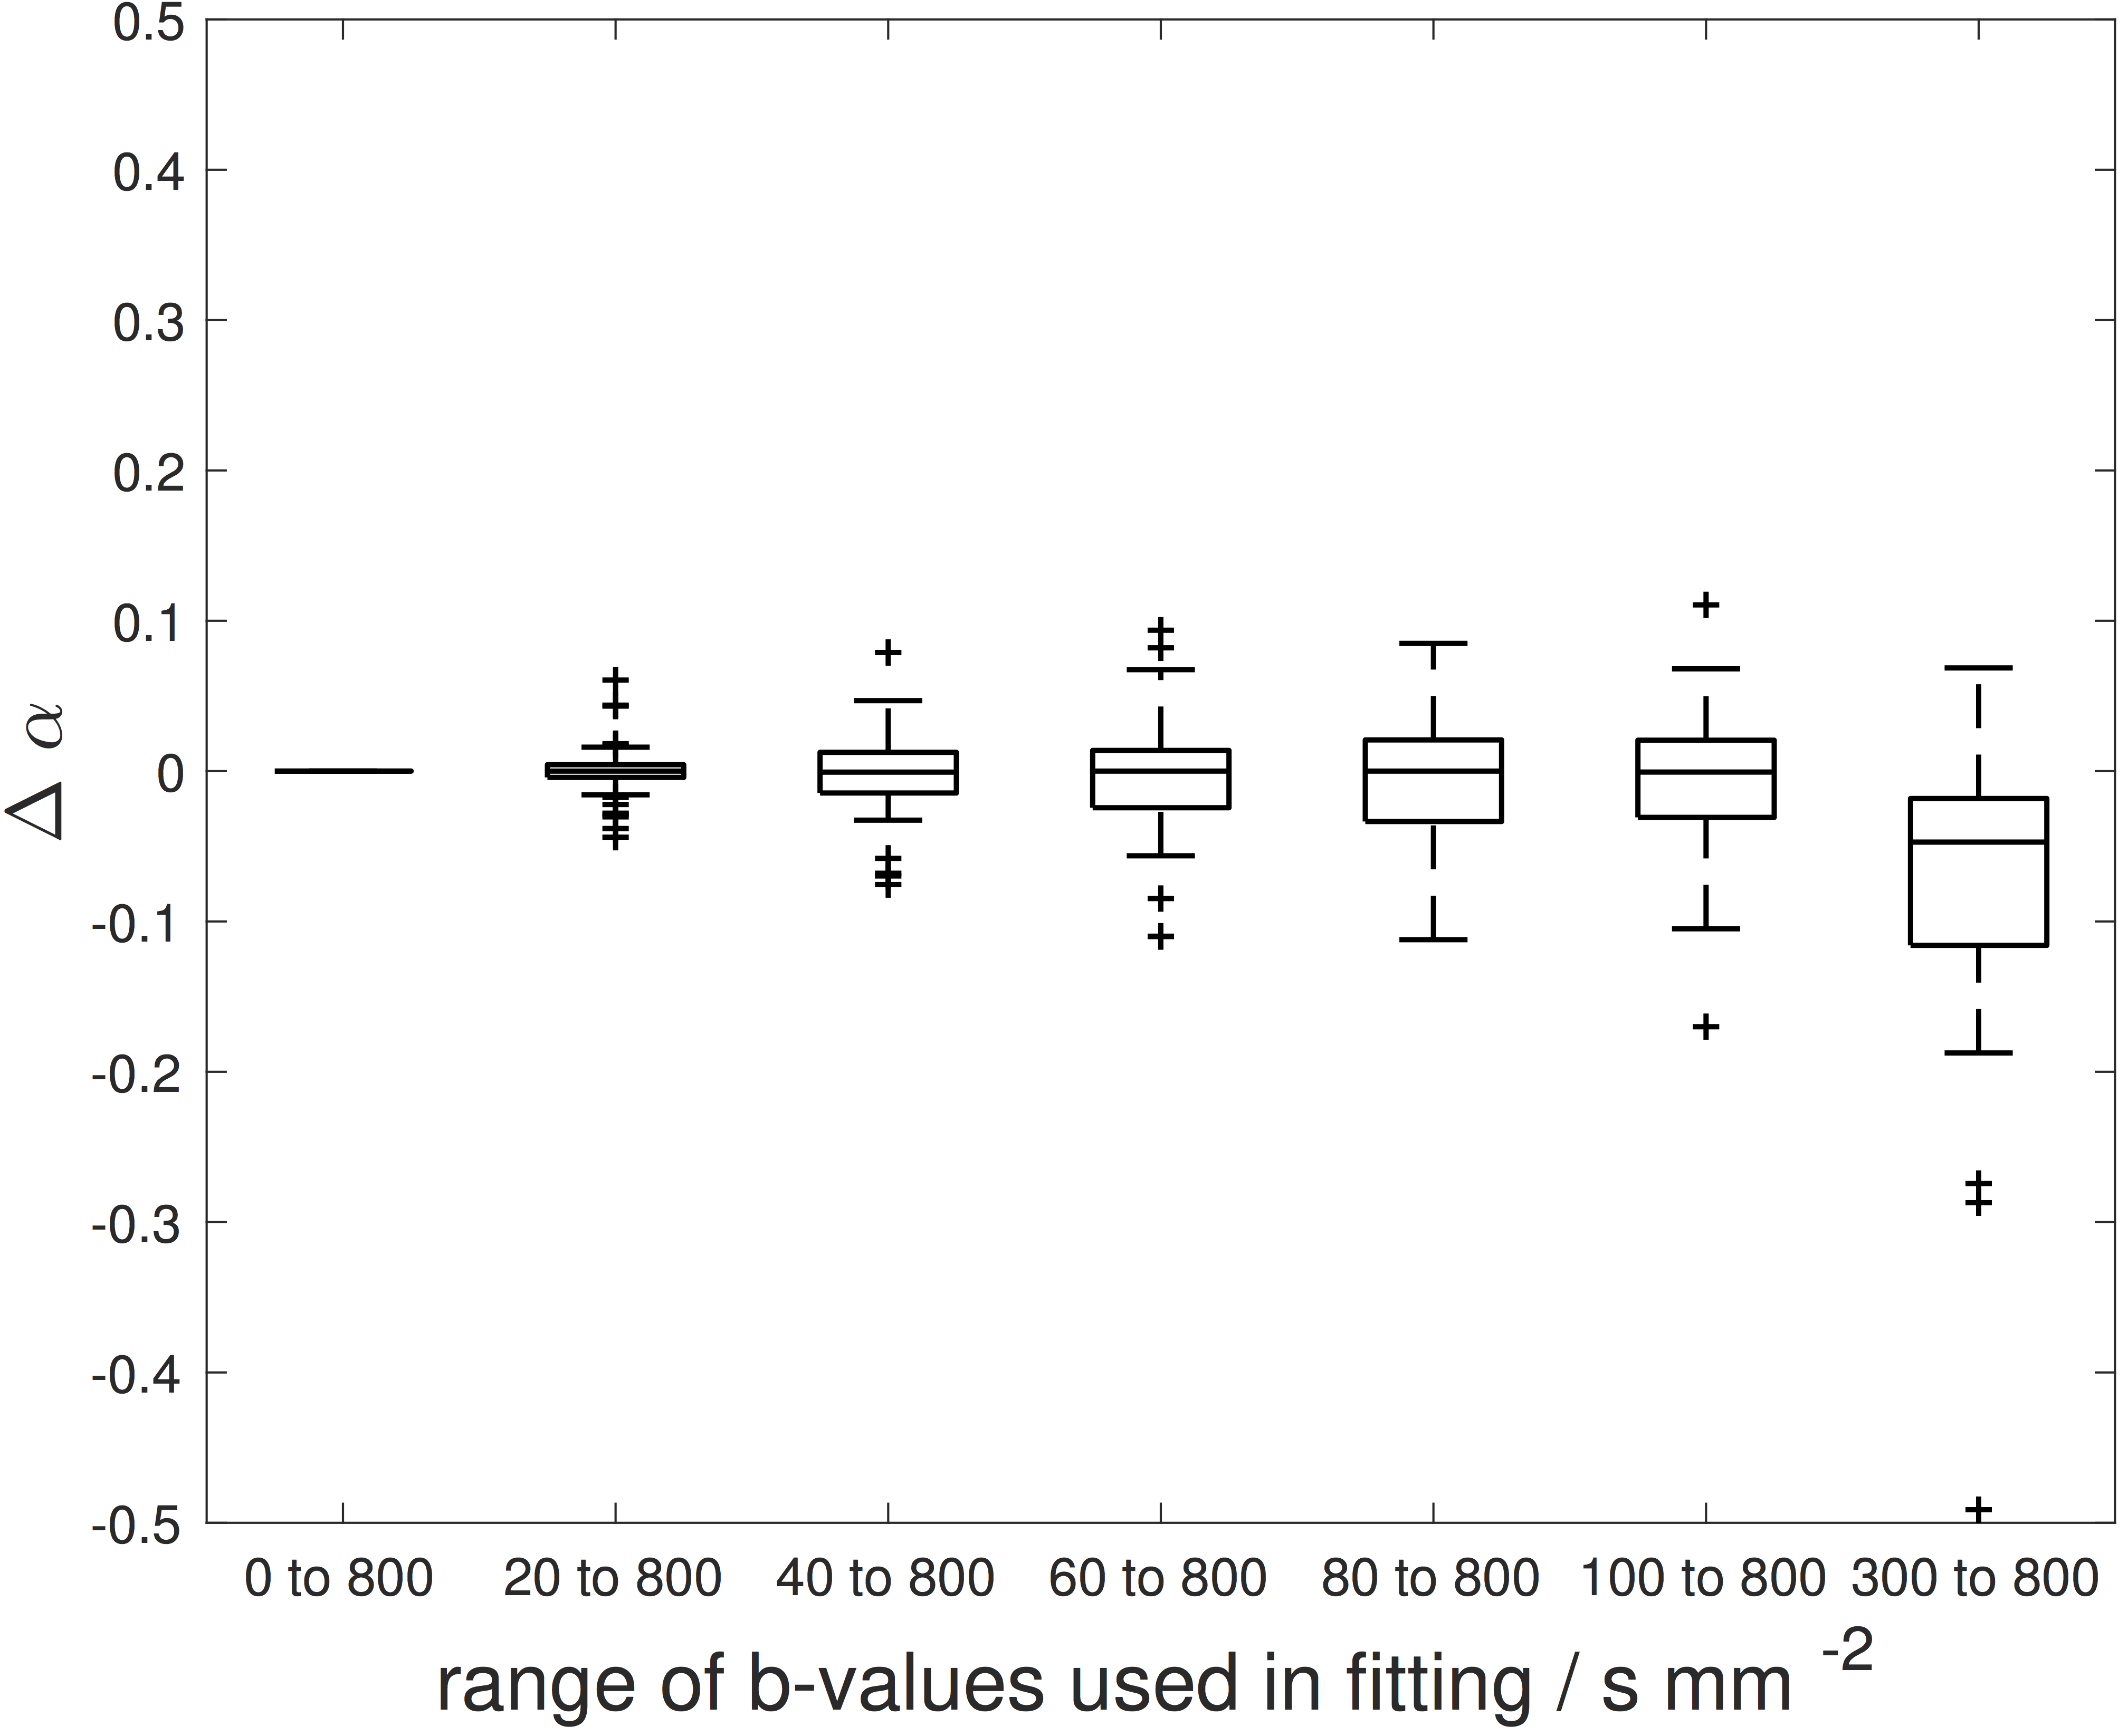
Individual differences: All tumours showed a reduction in ADC when low b-values were excluded, for all reduced b-value ranges (Figure 2). DDC and α did not exhibit marked changes with b-value range, except when fitting 300 to 800smm-2 (Figures 3 and 4).
Discussion
ADC estimates are sensitive to b-value selection, with reduction in ADC when low b-values are excluded, across all b-value ranges analysed. DDC and α exhibit minimal dependence on the range of low b-values employed, from 0 to 100 smm-2; the deviation when fitting 300 to 800smm-2 might be expected as 3 b-values provides scant data support. The reduced model dependence on b-values may be of value in combining data acquired on different scanners where protocol differences cannot be eliminated, for example some scanners/software versions allow b=0smm-2 to be excluded from the acquisition while others may not, and the lowest non-zero b-value may depend on scanner/software version.Conclusion
DDC and α estimated from the stretched exponential model are more robust to differences in b-value selection than ADC.Acknowledgements
We acknowledge CRUK and EPSRC support to the Cancer Imaging Centre at ICR and RMH in association with MRC and Department of Health C1060/A10334, C1060/A16464 and NHS funding to the NIHR Biomedical Research Centre and the Clinical Research Facility in Imaging at The Royal Marsden and ICR and the support of the NIHR Clinical Research Network.References
1. Winfield J, Orton M, Collins D, et al. Separation of type and grade in cervical tumours using non-mono-exponential models of diffusion-weighted MRI. Eur Radiol 2016; DOI 10.1007/s00330-016-4417-0.
2. Winfield J, deSouza N, Priest A, et al. Modelling DW-MRI data from primary and metastatic ovarian tumours. Eur Radiol 2015;25:2033-2040.
3. Orton M, Messiou C, Collins D, et al. Diffusion-weighted MR imaging of metastatic abdominal and pelvic tumours is sensitive to early changes induced by a VEGF inhibitor using alternative diffusion attenuation models. Eur Radiol 2016;26:1412-1419.
4. deSouza N, Scoones D, Krausz T, et al. High resolution MR imaging of stage 1 cervical neoplasia with a dedicated transvaginal coil: MR features and correlation of imaging and pathologic findings. AJR Am J Roentgenol. 1996;166:553-559.
5. Blackledge M, Leach M, Collins D, et al. Computed diffusion-weighted MR imaging may improve tumor detection. Radiology. 2011;261(2):573-581.
Figures
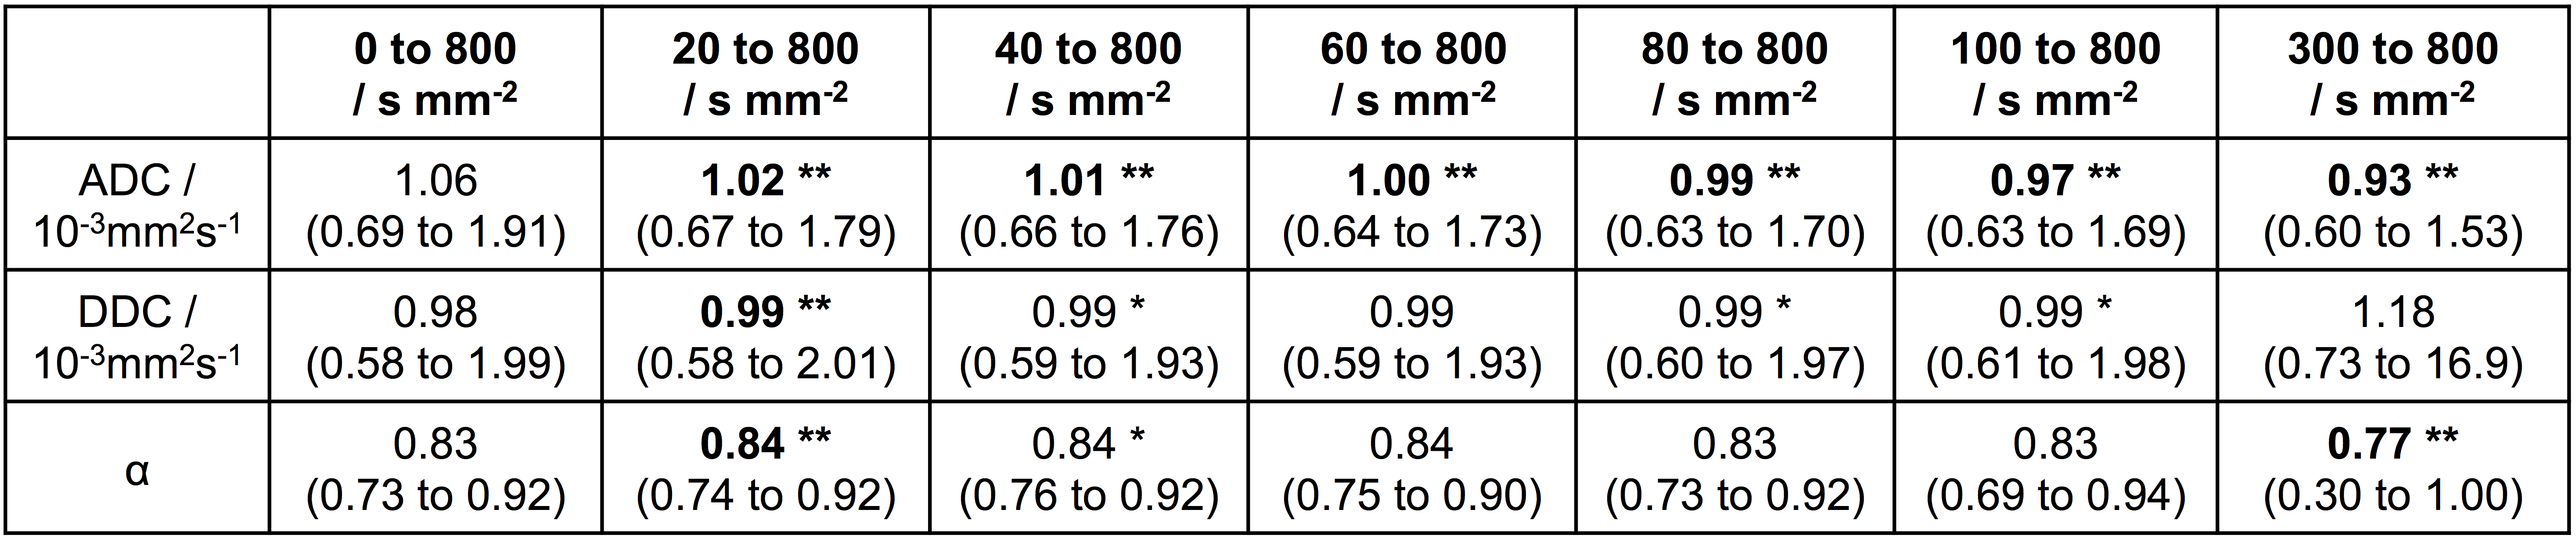
Figure 1: Median ADC, DDC and α from voxel-by-voxel
fitting of all tumor voxels in 42 patients with cervical cancer. Paired t-tests
show cohort differences between fitting over the range n-to-800smm-2 (where n
is between 20 and 300smm-2) and fitting from all b-values (0 to
800smm-2). Models were fitted voxel-by-voxel in all tumour voxels and the median parameter estimate taken for each patient.
*denotes p-values less than 0.05.
**and bold-type denotes p-values less than 0.0028 (=0.05/18).