2899
Application of Monoexponential, biexponential and stretched exponential Diffusion-weighted MR Imaging for Differentiating between Minimal Fat Angiomyolipoma (MFAML) and Papillary Renal Cell Carcinoma (PRCC).Haojie Li1, Yao Hu1, Daoyu Hu1, and Zhen Li1
1Radiology, Tongji Hospital, Tongji Medical College, Huazhong University of Science and Technology, Wu Han, People's Republic of China
Synopsis
Accurate preoperative differentiation between MFAML and PRCC is important to determine appropriate treatment strategies.In this study, the preliminary date from our study show that different models of DWI may demonstrate various aspects of tissue properties.fp and α may provide additional information and could lead to improved differentiation with better sensitivity and specificity between MFAML and PRCC compared with conventional imaging parameters.
Purpose:
To investigate the value of various diffusion parameters obtained from monoexponential, biexponential and stretched exponential diffusion model for differentiation of Minimal Fat Angiomyolipoma (MFAML) from Papillary Renal Cell Carcinoma (PRCC).Introduction:
Accurate preoperative differentiation between MFAML and PRCC is important to determine appropriate treatment strategies. Diffusion-weighted (DW) MR imaging has been shown to be useful in the functional evaluation of renal tumors [1]. However ADC values calculated by using a monoexponential model may not be able to accurately reflect water molecular diffusion in vivo. Previous studies have suggested that biexponential and stretched exponential model DWI might provide more accurate information regarding water diffusion [2]. The purpose of this study was to evaluate the potential value of various diffusion parameters obtained from monoexponential, biexponential, and stretched exponential DWI models in differentiating MFAML from PRCCMaterials and Methods:
Institutional review board approval was obtained for this HIPAA-compliant retrospective study, with waiver of informed consent. 47 patients with either pathologic analysis-confirmed MFAML (n=21) or PRCC(n=26) were assessed by using multi-b values DWI(0~1700 sec/mm2)at 3.0T MRI. The apparent diffusion coefficient (ADC), pseudo-ADC (Dp), true ADC (Dt), perfusion fraction (fp), distributed diffusion coefficient (DDC) and water molecular diffusion heterogeneity index (α) were calculated and compared between MFAML and PRCC. Student’s t test and Receiver operating characteristic was used for statistical analysis.Results:
Dt and α values were significantly lower in the MFAML group (Fig. 1) than in the PRCC group (P =0.005 and P<0.001, respectively) (Fig. 2). However, the ADC, fp, DDC value were significantly higher in the MFAML group than in the PRCC group (P=0.005, P<0.001 and P<0.001, respectively) (Fig. 3). Area under the curve (AUC) was largest for α in distinguishing MFMAL from PRCC (AUC=0.998, P<0.001) (Fig. 4). And the AUC value of α was significantly larger than those of ADC, Dt, and DDC (P<0.001, P<0.001 and P=0.0185,respectively). The AUC value of fp was also significantly larger than ADC and Dt (P<0.001).Discussion and conclusion:
In this study, our results show that different modes of DWI may demonstrate various aspects of tissue properties. Water molecular diffusion heterogeneity index (α) and fp might provide additional information and could lead to improved differentiation with better sensitivity and specificity in differentiating MFAML from PRCC compared with mean ADC, Dt, and DDC values in clinical setting.Acknowledgements
No acknowledgement found.References
[1] Yu X. et al. Eur J Radiol. 2012; [2] Lai V. et al. Eur Radiol. 2015.Figures
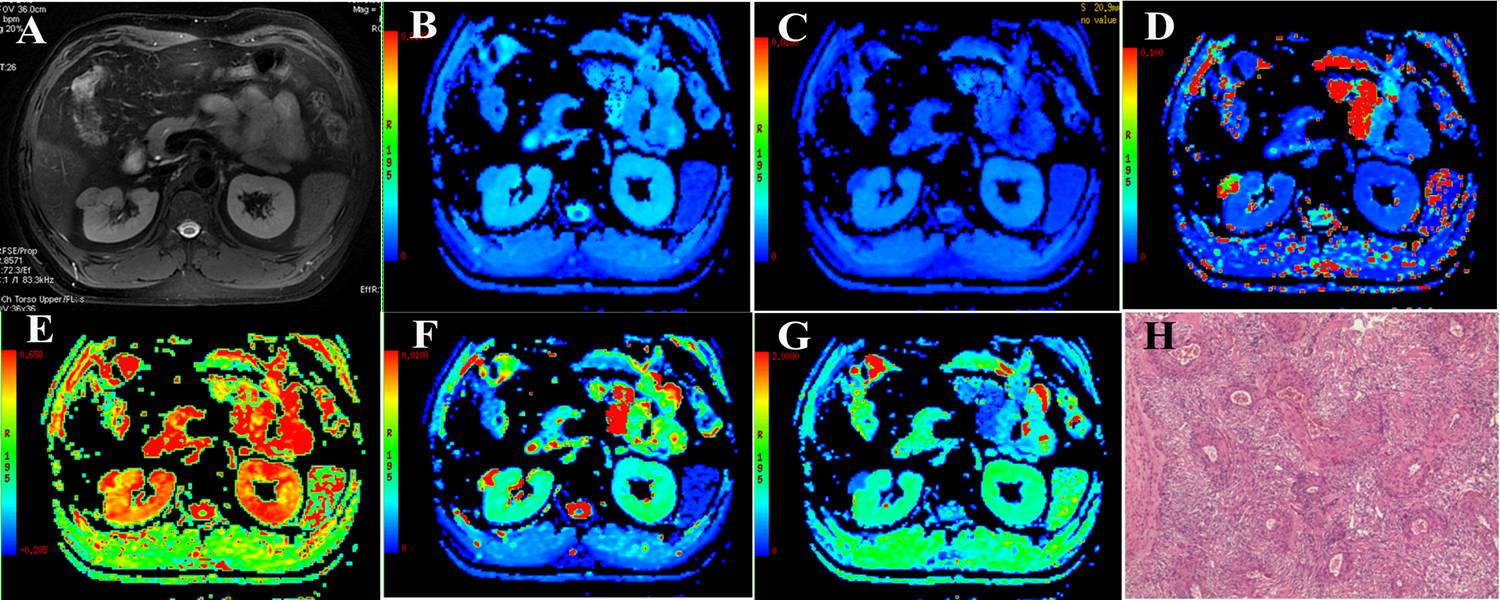
Fig. 1 Representative
images of MFAML. Images A to G are axial T2-weighted images, ADC, Dt, Dp, fp, DDC
and α maps, respectively. H:Photomicrograph shows variable
proportions of smooth muscle cells,blood vessels,
and adipose tissues.
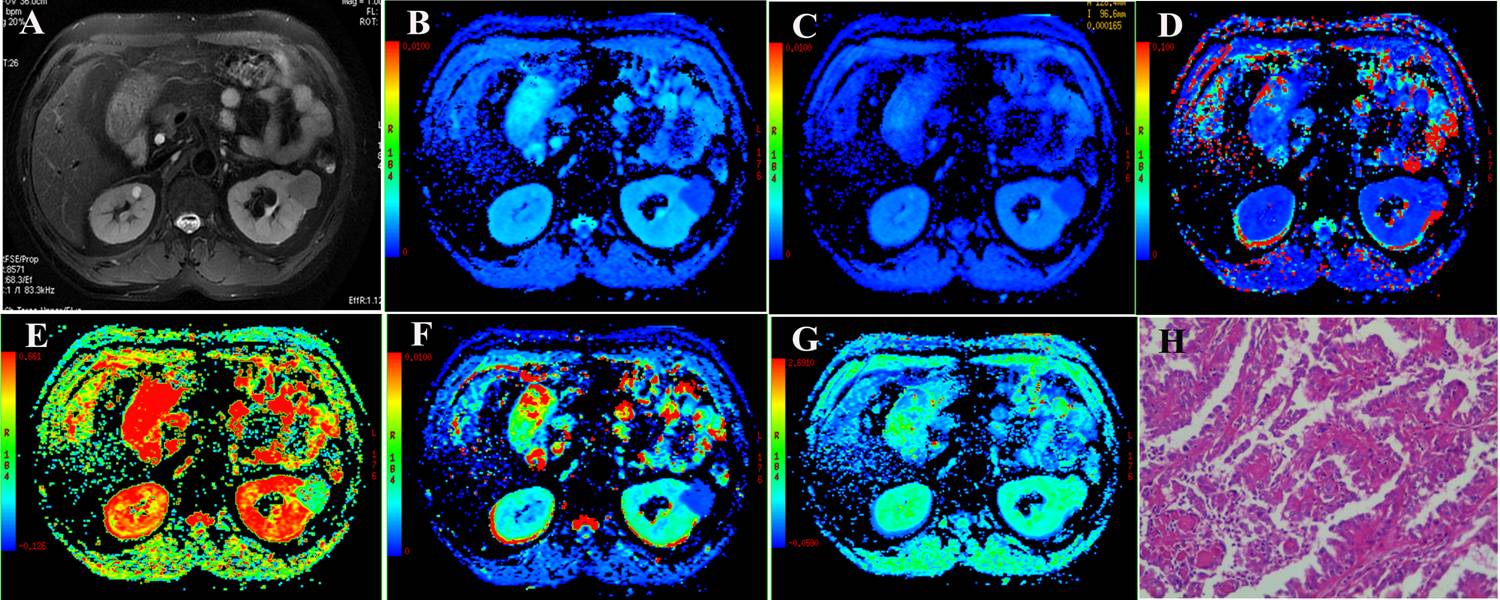
Fig. 2 Representative images of PRCC. Images A to G are axial T2-weighted images, ADC, Dt, Dt, fp, DDC and α maps, respectively.Image H:Photomicrograph shows papillae lined by cytologically low-grade cells.
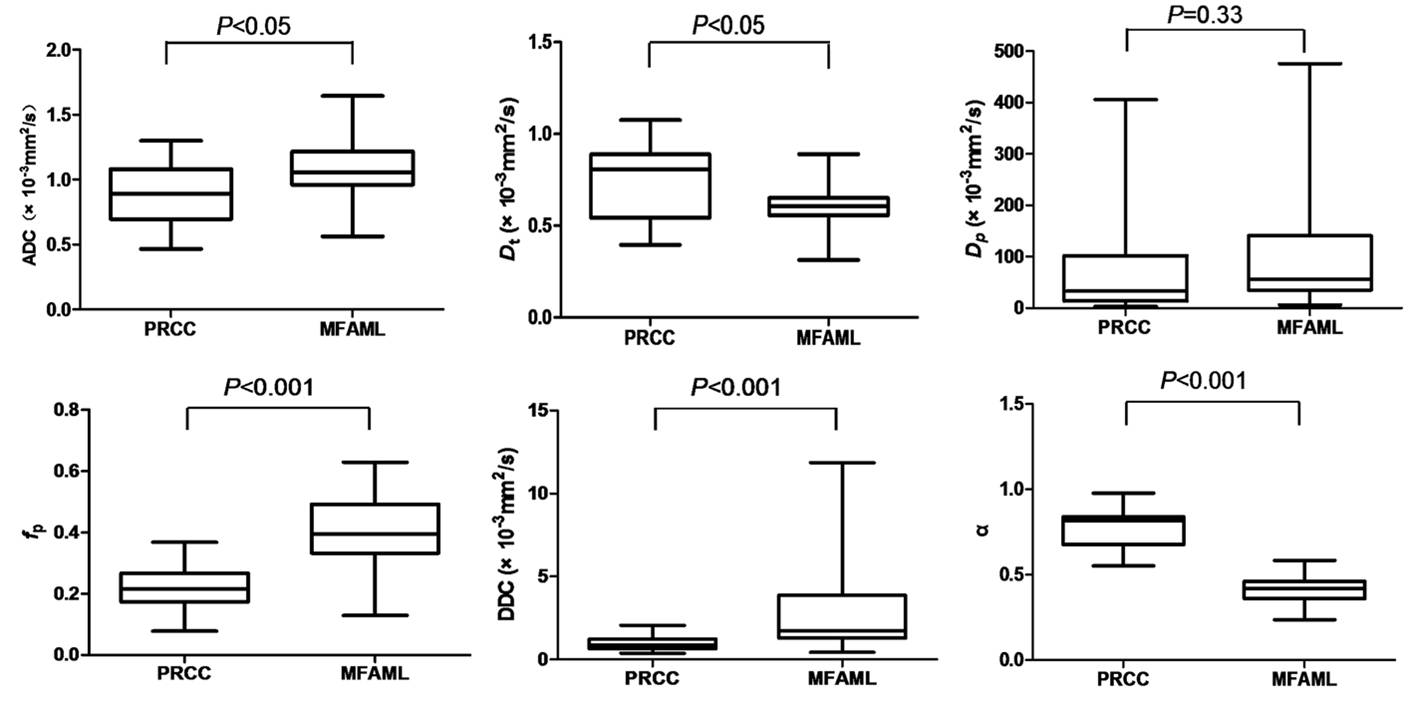
Fig. 3 Box plots showing distribution of imaging parameters
between PRCC and MFAML.
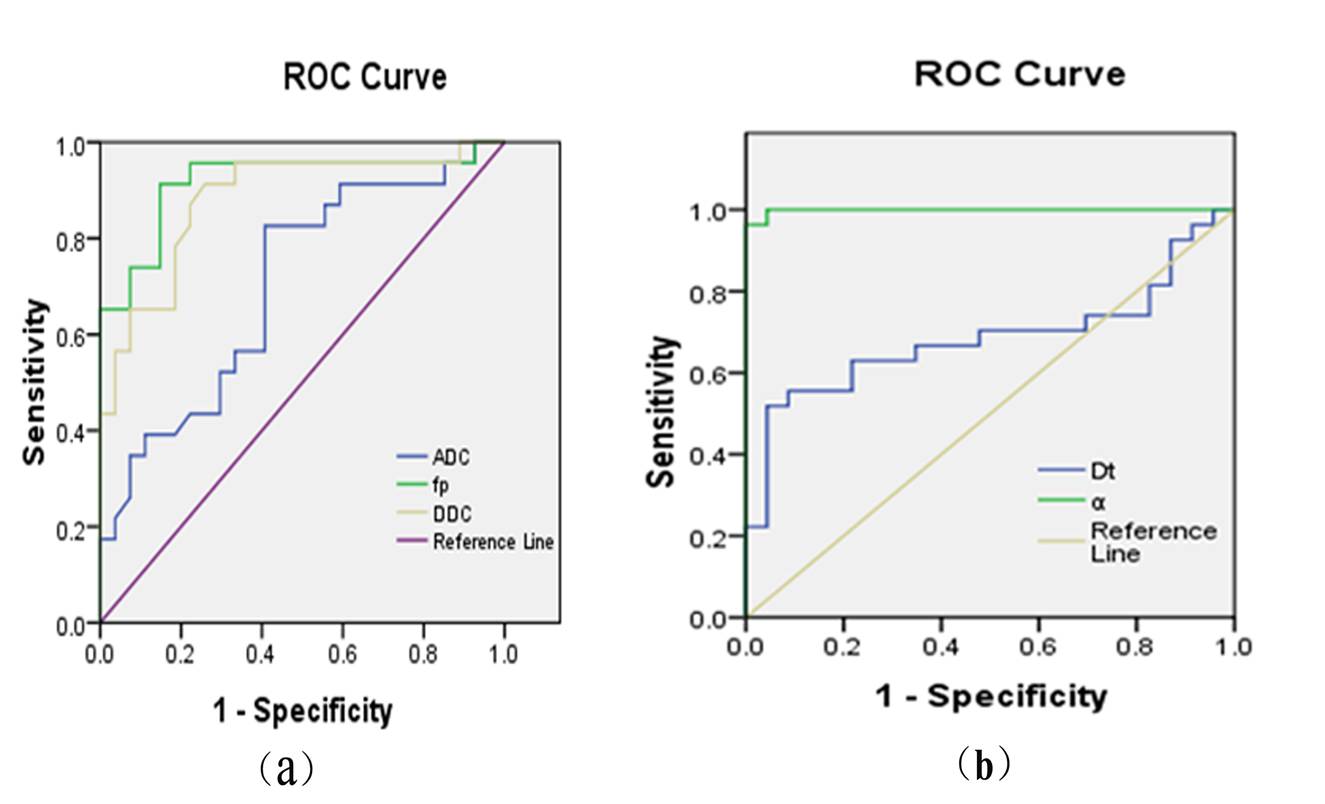
Fig. 4 (a)
Receiver operating characteristic curves for ADC, fp and DDC in differentiating MFAML and PRCC. (b)
Receiver operating characteristic curves for Dt,
α in
differentiating MFAML and PRCC.