2896
Are radiation-induced perfusion changes in normal appearing brain tissue a confounding factor in tumour response evaluation with DSC-MRI?1Surgical Sciences, Uppsala University, Uppsala, Sweden, 2Biomedical Technology, Medical Physics and IT, Uppsala University Hospital, Uppsala, Sweden
Synopsis
Radiation-induced brain perfusion changes after radiotherapy have not been studied extensively with DSC-MRI. Tumour perfusion is often normalised to contralateral normal-appearing white matter, why knowledge about radiation effects on perfusion in normal brain tissue is essential. Ten patients were examined with DSC-MRI at 1.5 T before and repeatedly after RT. Multiple volumes were drawn in normal brain tissue. Radiation dose for all volumes were available. Significant CBV and CBF decrease after radiotherapy was visible in grey matter volumes and showed tendency to recover. High radiation dose regions should be avoided when normalising DSC-MRI derived tumour perfusion values.
Introduction/Purpose
Radiotherapy (RT) is extensively used for treatment of brain tumours, with the major limitation of potential neurotoxicity as an adverse effect1. Vascular damage with blood-brain-barrier disruption and impaired autoregulation are well-known complications in healthy tissue perfusion during RT2, 3. Absolute quantification of cerebral blood volume (CBV) and cerebral blood flow (CBF) in dynamic susceptibility contrast (DSC) magnetic resonance imaging (MRI) is difficult and is often overcome by relating tumour perfusion to contralateral normal appearing white matter (NAWM)4. This problem has usually not been addressed in previous studies of radiation-induced perfusion changes in normal appearing brain tissue (NBT). The aim of this study was to examine CBF and CBV in normal-appearing grey and white matter after RT.Method
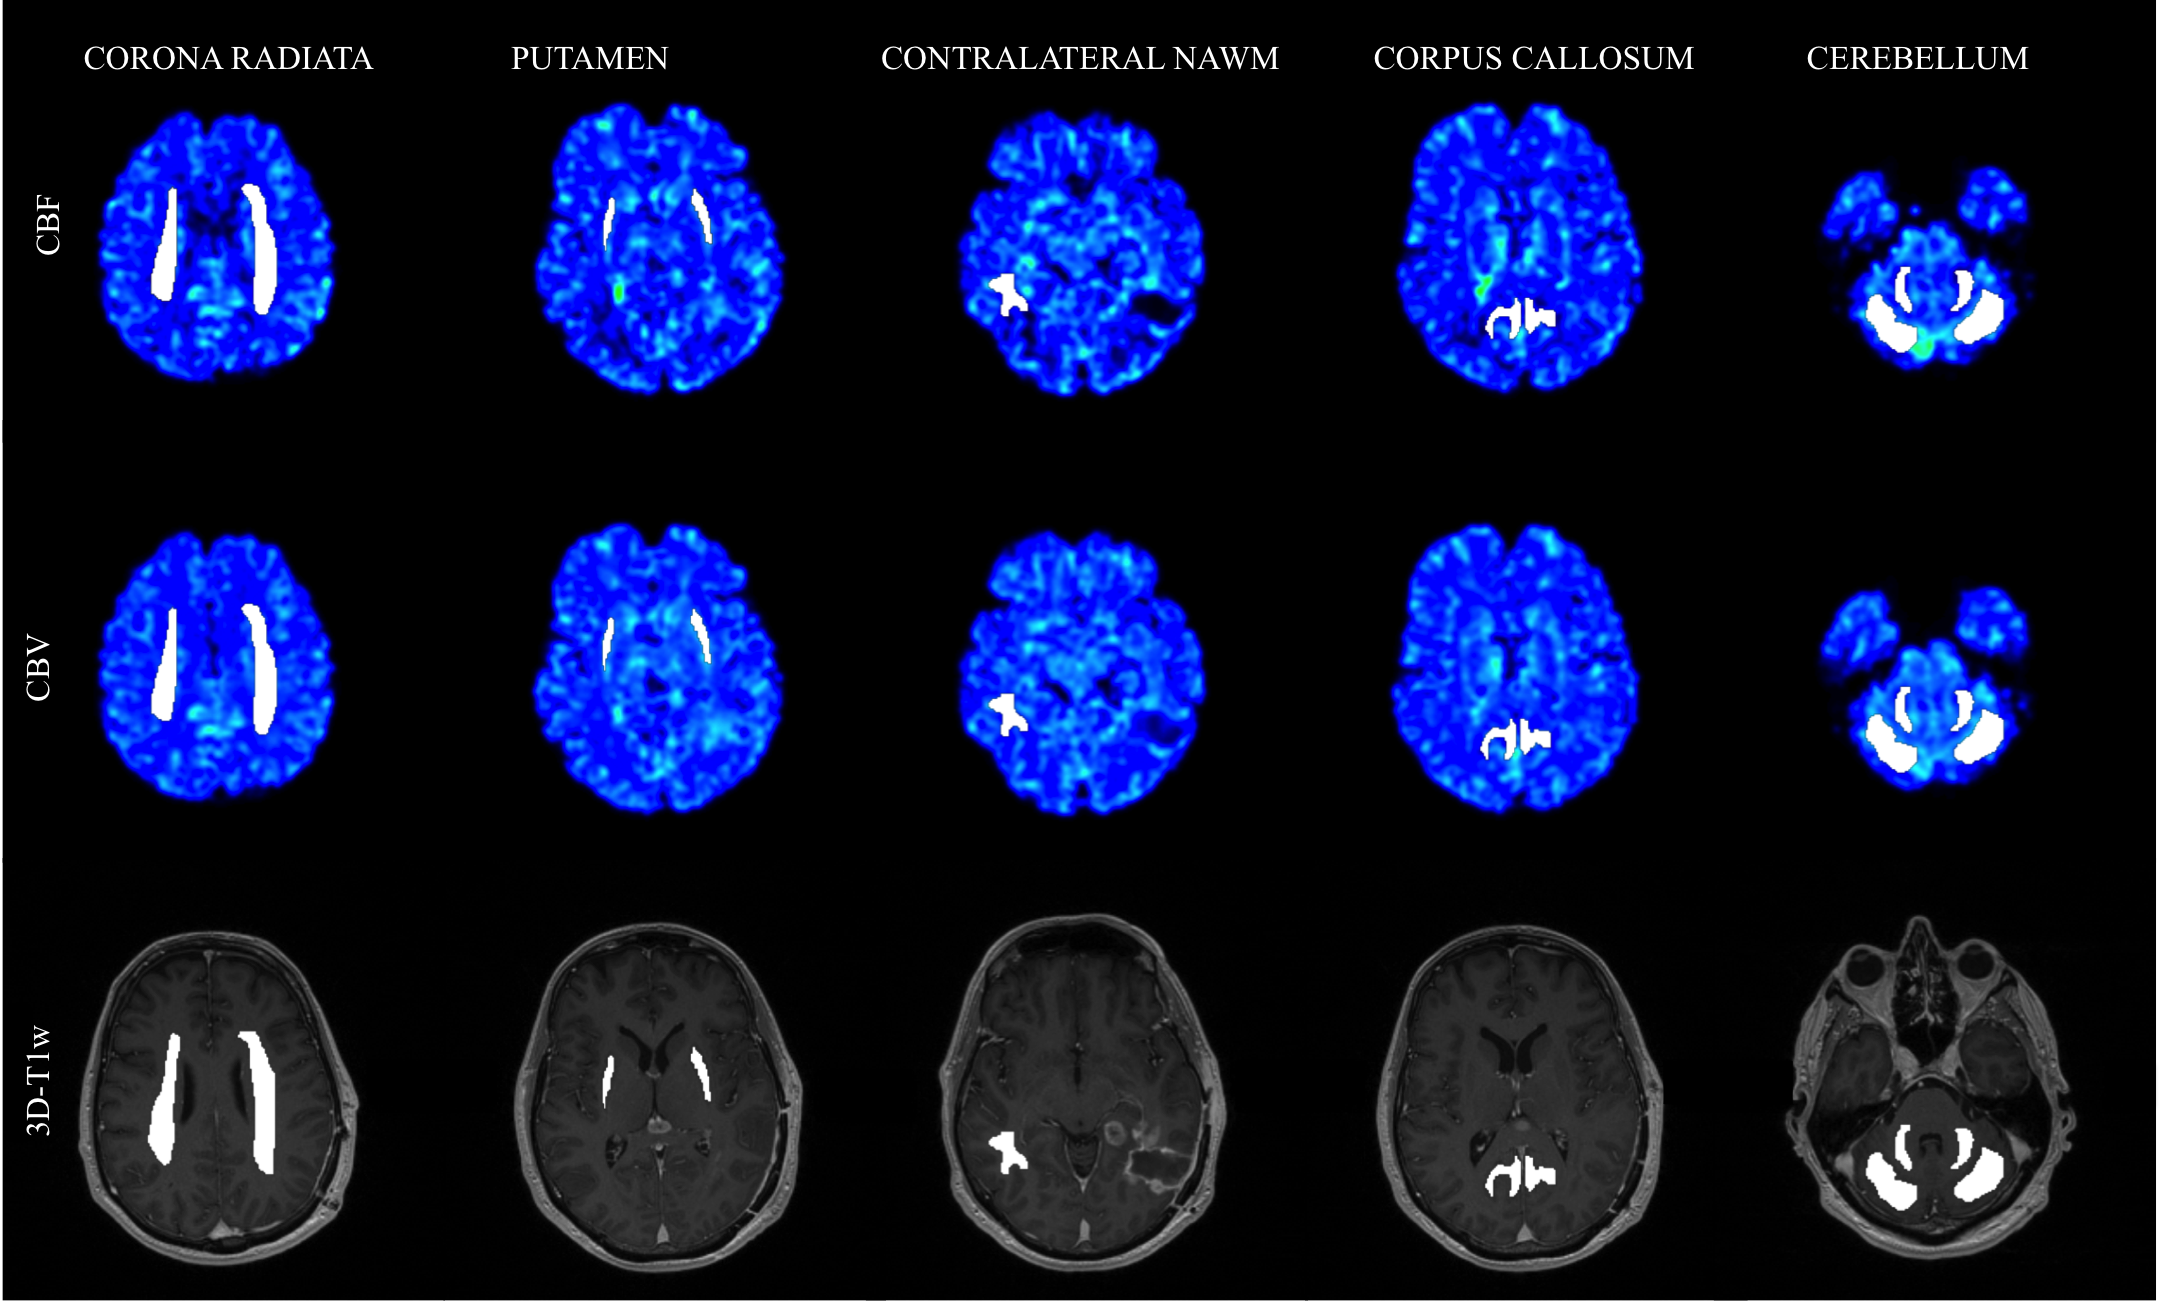
Ten patients with malignant gliomas were included, mean age 54.2 years. Patients underwent surgical resection, radio- and temozolomide therapy. MRI, including DSC perfusion and contrast-enhanced 3D-T1 weighted (3D-T1w) scans, was performed on a 1.5 T system (Siemens Avanto, Siemens Healthcare, Erlangen, Germany), pre-RT (mean 9 days before start of RT) and three times post-RT (mean 11 days, 68 days and 168 days after end of RT). All analyses were performed in nordicICE v4.0.4 (Nordic Neurolab, Bergen, Norway). Contrast agent leakage correction was applied and was allowed to assume both positive and negative values to correct for both T1- and T2*-dominant relaxation effects5-7. Vessel segmentation was performed using an iterative five-class k-means cluster analysis to exclude large arteries and veins and thus eliminating “hot-spot” contributions affecting the measurements8. Deconvolution was carried out using standard singular value decomposition (sSVD) with Tikhonov regularization with an iterative threshold6, 9-13. The use of patient specific arterial input functions in DSC measurements has been shown to increase reproducibility between examinations14. Thus, the arterial input function was defined in middle cerebral artery branches in the hemisphere contralateral to the tumour4 in the baseline examination and applied to the following examinations. Planned radiation dose levels were acquired from MICE15, by rigidly transforming the pre-RT 3D-T1w images to the dose-planning CT, applying the transformation to each VOI respectively and acquiring the radiation dose. Dose intervals were defined as 0-20, 20-40 and >40 Gy. Five bilateral and one unilateral volume of interests (VOIs) in NBT were defined on pre-RT 3D-T1w images. Care was taken to exclude blood vessels, tumour tissue and compressed tissue. An experienced neuroradiologist reviewed all drawn regions. The VOIs were drawn in the bilateral corona radiata, putamen, cerebellar cortex and white matter, respectively, and in the corpus callosum. In addition, a VOI was placed in contralateral NAWM avoiding high dose regions. Representative CBV, CBV and 3D-T1w images with volumes are shown in figure 1. All CBV and CBF values were normalised to corresponding values for contralateral NAWM hereafter denoted nCBV and nCBF.Results
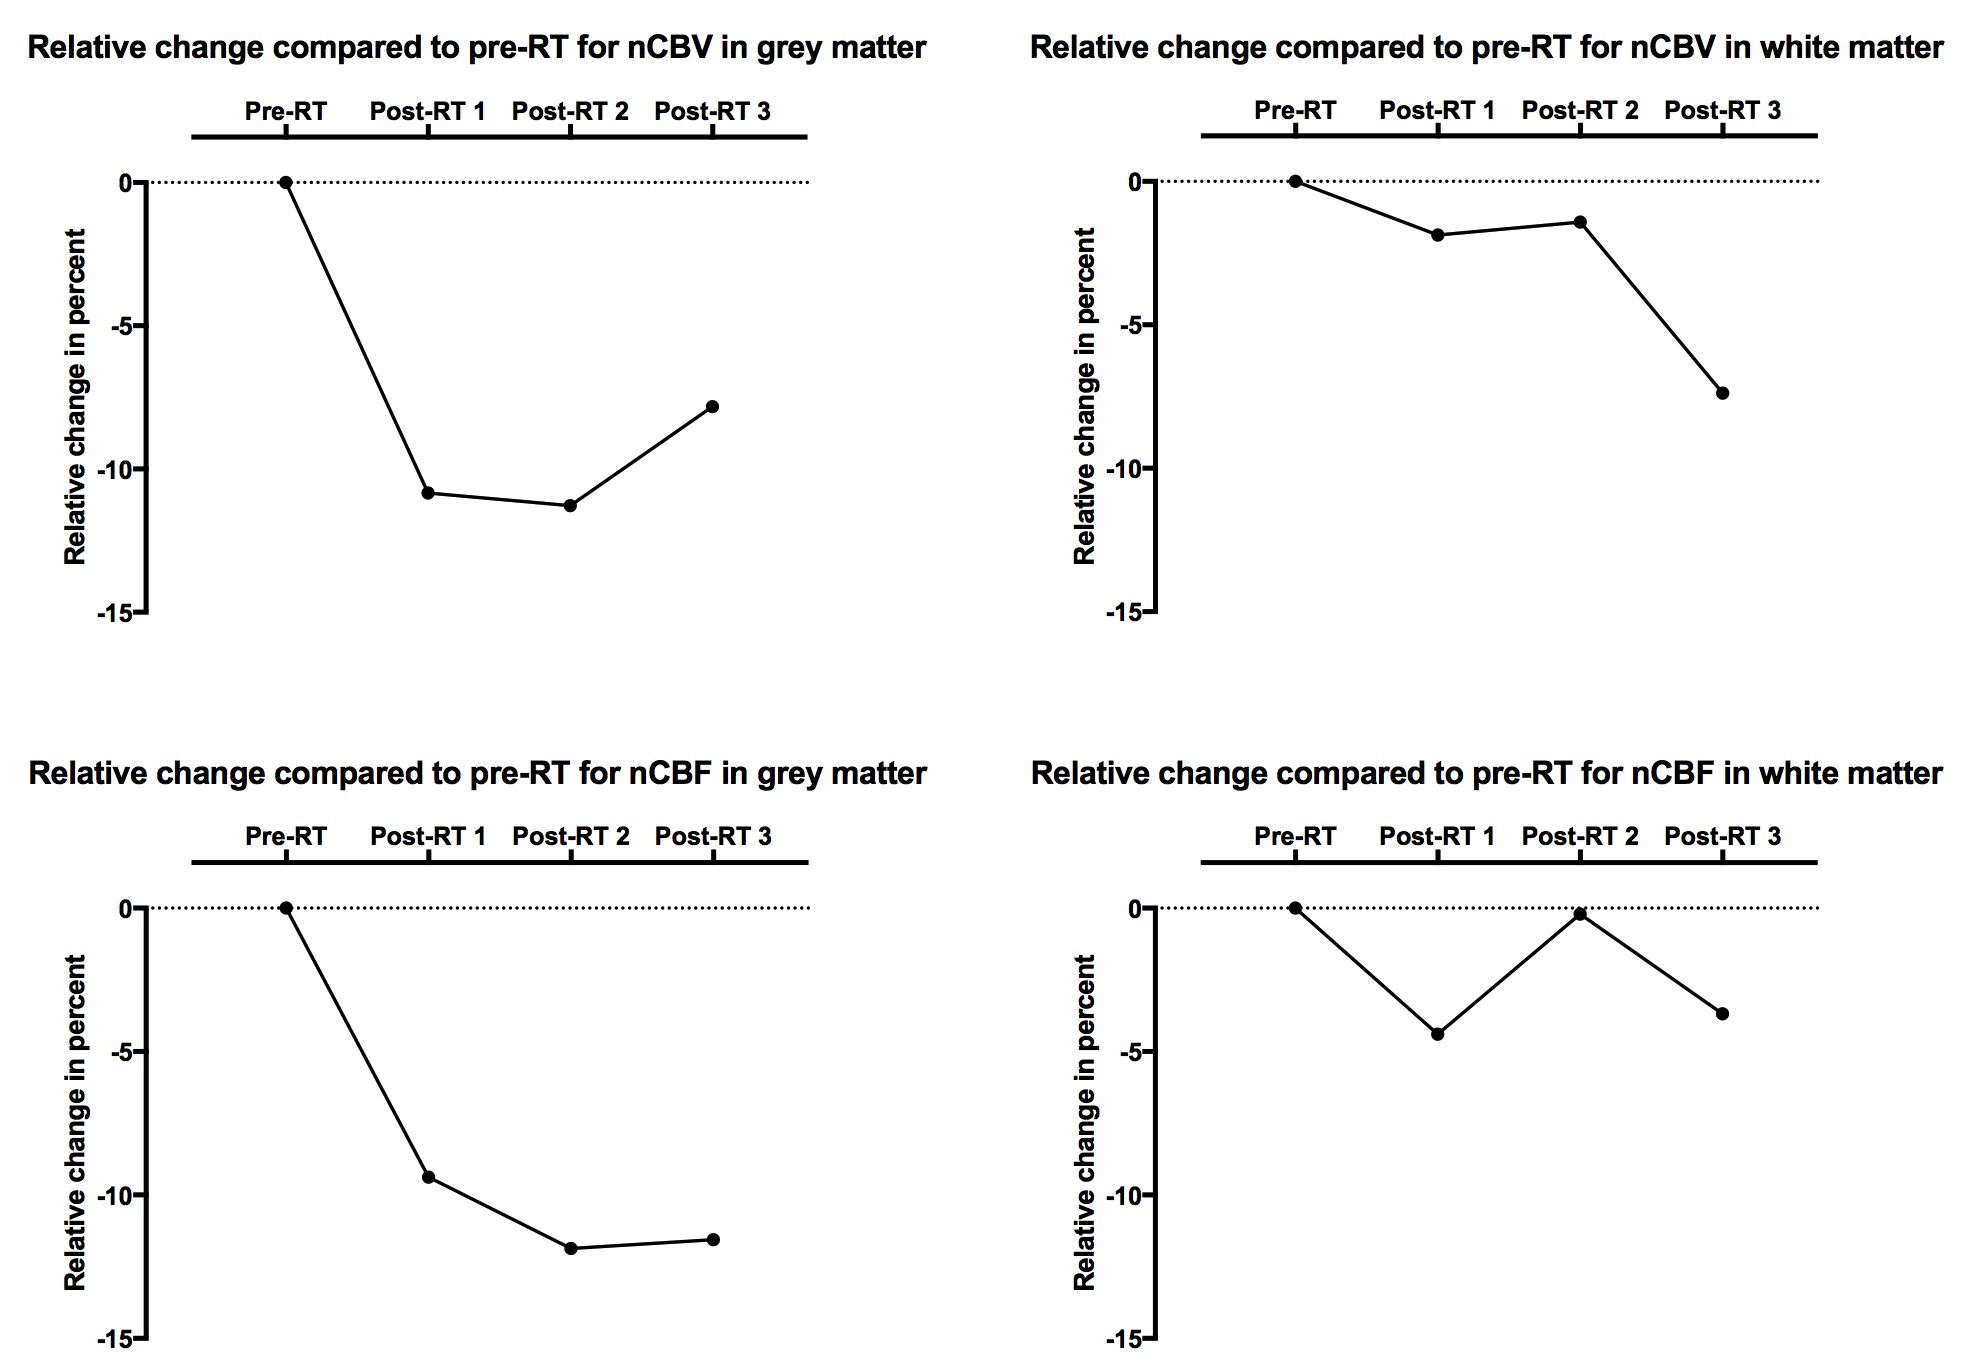
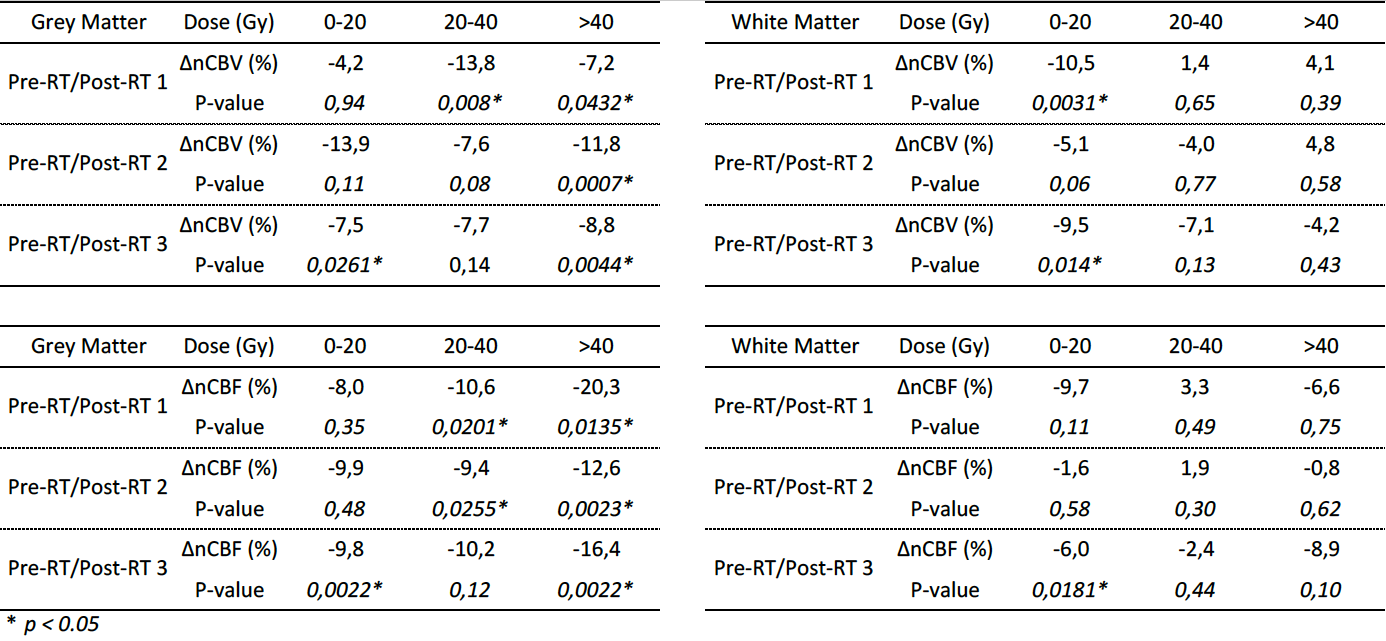
All white and grey matter VOIs showed an initial decrease in nCBV and nCBF post-RT. Grey matter VOIs show a tendency towards recovery in the last examination for both nCBV and nCBF (figure 2). For all grey matter volumes, all post-RT examinations with a radiation exposure of >40 Gy were significantly different compared to pre-RT (p<0.05) for both nCBV and nCBF (table 1). nCBF shows a dose-relationship decrease in the first post-RT examination. The same tendency of a dose-response relationship can be distinguished for latter post-RT examinations and nCBV but confined to grey matter.Discussion
In this study we present evidence of decrease ofnCBV and nCBF after radiation therapy with larger decrease in grey matter than in white matter, in accordance with previous publications3, 16-19. A tendency to dose-response relationship can be found in grey matter.Conclusion
Defining normal appearing white matter contralateral to tumour in high dose regions have the potential to cause an overestimation of tumour response, use of other volumes with the aid of RT dose distribution maps might be warranted.Acknowledgements
No acknowledgement found.References
1. Cao Y, Tsien CI, Sundgren PC, Nagesh V, Normolle D, Buchtel H, et al. Dynamic contrast-enhanced magnetic resonance imaging as a biomarker for prediction of radiation-induced neurocognitive dysfunction. Clinical cancer research : an official journal of the American Association for Cancer Research. 2009;15(5):1747-54.
2. O'Connor MM, Mayberg MR. Effects of radiation on cerebral vasculature: a review. Neurosurgery. 2000;46(1):138-49; discussion 50-1.
3. Petr J, Platzek I, Seidlitz A, Mutsaerts HJ, Hofheinz F, Schramm G, et al. Early and late effects of radiochemotherapy on cerebral blood flow in glioblastoma patients measured with non-invasive perfusion MRI. Radiother Oncol. 2015.
4. Jarnum H, Steffensen EG, Knutsson L, Frund ET, Simonsen CW, Lundbye-Christensen S, et al. Perfusion MRI of brain tumours: a comparative study of pseudo-continuous arterial spin labelling and dynamic susceptibility contrast imaging. Neuroradiology. 2010;52(4):307-17.
5. Bjornerud A, Sorensen AG, Mouridsen K, Emblem KE. T1- and T2*-dominant extravasation correction in DSC-MRI: part I--theoretical considerations and implications for assessment of tumor hemodynamic properties. Journal of cerebral blood flow and metabolism : official journal of the International Society of Cerebral Blood Flow and Metabolism. 2011;31(10):2041-53.
6. Emblem KE, Bjornerud A, Mouridsen K, Borra RJ, Batchelor TT, Jain RK, et al. T(1)- and T(2)(*)-dominant extravasation correction in DSC-MRI: part II-predicting patient outcome after a single dose of cediranib in recurrent glioblastoma patients. Journal of cerebral blood flow and metabolism : official journal of the International Society of Cerebral Blood Flow and Metabolism. 2011;31(10):2054-64.
7. Boxerman JL, Schmainda KM, Weisskoff RM. Relative cerebral blood volume maps corrected for contrast agent extravasation significantly correlate with glioma tumor grade, whereas uncorrected maps do not. AJNR American journal of neuroradiology. 2006;27(4):859-67.
8. Emblem KE, Due-Tonnessen P, Hald JK, Bjornerud A. Automatic vessel removal in gliomas from dynamic susceptibility contrast imaging. Magnetic resonance in medicine : official journal of the Society of Magnetic Resonance in Medicine / Society of Magnetic Resonance in Medicine. 2009;61(5):1210-7.
9. Wu O, Ostergaard L, Sorensen AG. Technical aspects of perfusion-weighted imaging. Neuroimaging clinics of North America. 2005;15(3):623-37, xi.
10. Ostergaard L, Weisskoff RM, Chesler DA, Gyldensted C, Rosen BR. High resolution measurement of cerebral blood flow using intravascular tracer bolus passages. Part I: Mathematical approach and statistical analysis. Magnetic resonance in medicine : official journal of the Society of Magnetic Resonance in Medicine / Society of Magnetic Resonance in Medicine. 1996;36(5):715-25.
11. Ostergaard L, Sorensen AG, Kwong KK, Weisskoff RM, Gyldensted C, Rosen BR. High resolution measurement of cerebral blood flow using intravascular tracer bolus passages. Part II: Experimental comparison and preliminary results. Magnetic resonance in medicine : official journal of the Society of Magnetic Resonance in Medicine / Society of Magnetic Resonance in Medicine. 1996;36(5):726-36.
12. Ostergaard L. Principles of cerebral perfusion imaging by bolus tracking. Journal of magnetic resonance imaging : JMRI. 2005;22(6):710-7.
13. Calamante F, Gadian DG, Connelly A. Quantification of bolus-tracking MRI: Improved characterization of the tissue residue function using Tikhonov regularization. Magnetic resonance in medicine : official journal of the Society of Magnetic Resonance in Medicine / Society of Magnetic Resonance in Medicine. 2003;50(6):1237-47.
14. Mouridsen K, Emblem K, Bjørnerud A, Jennings D, Sorensen AG. Subject-specific AIF optimizes reproducibility of perfusion parameters in longitudinal DSC-MRI. 2011.
15. Nyholm T, Berglund M, Brynolfsson P, Jonsson J. EP-1533: ICE-Studio-An Interactive visual research tool for image analysis. Radiotherapy and Oncology. 2015;115:S837.
16. Fuss M, Wenz F, Scholdei R, Essig M, Debus J, Knopp MV, et al. Radiation-induced regional cerebral blood volume (rCBV) changes in normal brain and low-grade astrocytomas: quantification and time and dose-dependent occurrence. International journal of radiation oncology, biology, physics. 2000;48(1):53-8.
17. Lee MC, Cha S, Chang SM, Nelson SJ. Dynamic susceptibility contrast perfusion imaging of radiation effects in normal-appearing brain tissue: changes in the first-pass and recirculation phases. Journal of magnetic resonance imaging : JMRI. 2005;21(6):683-93.
18. Price SJ, Jena R, Green HA, Kirkby NF, Lynch AG, Coles CE, et al. Early radiotherapy dose response and lack of hypersensitivity effect in normal brain tissue: a sequential dynamic susceptibility imaging study of cerebral perfusion. Clin Oncol (R Coll Radiol). 2007;19(8):577-87.
19. Wenz F, Rempp K, Hess T, Debus J, Brix G, Engenhart R, et al. Effect of radiation on blood volume in low-grade astrocytomas and normal brain tissue: quantification with dynamic susceptibility contrast MR imaging. AJR American journal of roentgenology. 1996;166(1):187-93.
Figures