2895
Dynamic Contrast-Enhanced MRI Using Spatial Prior Knowledge1Institute of Scientific Instruments of the CAS, Brno, Czech Republic, 2Institute of Information Theory and Automation of the CAS, Praha, Czech Republic, 3Department of Cytokinetics, Institute of Biophysics of the CAS, Brno, Czech Republic, 4Center of Biomolecular and Cellular Engineering, International Clinical Research Center, Brno, St. Anne’s University Hospital Brno, Brno, Czech Republic, 5Department of Experimental Biology, Faculty of Science, Masaryk University, Brno, Czech Republic, 6Department of Biomedicine, University of Bergen, Bergen, Norway
Synopsis
A method to improve reliability of DCE-MRI is presented. It is based on the assumption that neighboring voxels have similar physiological properties. It is formulated as a total variation regularization of the perfusion parameter maps. The method is applied to the adiabatic approximation of the tissue homogeneity model (ATH). Evaluation was done on data of five tumor bearing mice recorded using two contrast agents with different molecular weights. The resulting perfusion parameter maps were more spatially consistent with preserved edges.
PURPOSE
Dynamic Contrast-Enhanced (DCE) MRI is used for assessment of microvascular tissue parameters by approximating the tissue contrast agent (CA) concentration curves with a pharmacokinetic model. Compared to standard pharmacokinetic models (Tofts, extended Tofts), use of advanced pharmacokinetic models provides also estimates of blood plasma flow (Fp) and permeability surface area product (PS)1. However, it leads to bad conditioning of the approximation problem due to higher number of perfusion parameters to be estimated and the nonlinear character of the pharmacokinetic model. To improve reliability of the approximation process, additional prior information needs to be used.
Here, the assumption that neighboring voxels have similar physiological properties is applied. Such spatial prior has been rarely published2-4. It has been formulated using the Gaussian Markov random field2,3 or L2 regularization of the perfusion parameter maps4. It has been applied to the Tofts model2,3 and its multicompartment variation4. These models do not provide separate estimates of Fp and PS. Here, the spatial prior is formulated as a total variation (TV) regularization and applied to the adiabatic approximation of the tissue homogeneity model (ATH)5, providing separate estimates of Fp and PS. Use of a spatial prior requires a simultaneous approximation of all tissue concentration curves in the image3 or in a block2 which leads to high computational demands and slow convergence. Here, this problem is avoided by relating the spatial constraints to the result of the previous perfusion analysis iteration.
METHODS
The tissue concentration curves are modeled as a convolution of the arterial input function (AIF) and the impulse residue function (IRF). The AIF is estimated using blind multichannel deconvolution6. The IRF is modeled using the ATH model, based on the comparison of the advanced pharmacokinetic models ATH and 2CXM evaluated on the same tumor tissue type as used here7. The perfusion parameters (parameters of the IRF) are estimated in an iterative algorithm (5 iterations used). In the first iteration, the standard approximation of the voxel-specific tissue concentration curves by the convolutional model is performed as minimization of the sum of squared differences (SSD) between the tissue concentration curve and the convolutional model. In the subsequent iterations, the SSD criterion of the approximation task is extended by adding five TV regularization terms, each for one parameter of the IRF: Fp, extraction fraction, interstitial volume, capillary mean transit time and the bolus arrival time. Each TV term is a sum of absolute value differences between the sought perfusion parameter of the processed voxel and the perfusion parameters estimated in the neighboring voxels in the previous iteration. The TV regularization is known to impose partial smoothness while preserving edges. The weight of all TV terms is the same (set experimentally) as the perfusion parameters are scaled to approximately the same range.
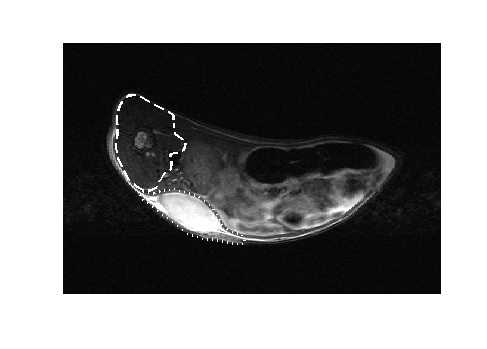
The method was evaluated with five BALB/C mice after subcutaneous implantation of tumor cells (CT26), approved by the National Animal Research Authority. Two CA boluses were administered within one examination (delay of 30 min. in between): high-MW CA (GadoSpin P, Miltenyi Biotec, Germany) and low-MW CA (Magnevist, Bayer HealthCare Pharmaceuticals, Germany).
A 9.4T BioSpin (Bruker Biospin MRI, Germany) scanner was used; dynamic recording: 2D FLASH, TR/TE 14/2.5ms, flip angle 25deg., matrix 128x96, axial slice, thickness 1mm, sampling interval 1.05s, acquisition time 13min; 15 calibration images before bolus administrations: TR=14,30,50,100,250,500ms. The dynamic recordings were converted to CA concentration using calibration images8 (multiple-TR modification used here instead of the multiple-flip-angle method8 as more reliable).
RESULTS
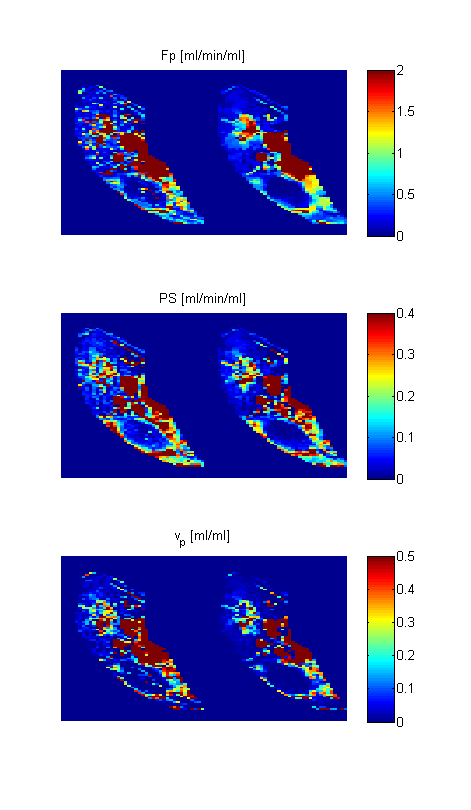
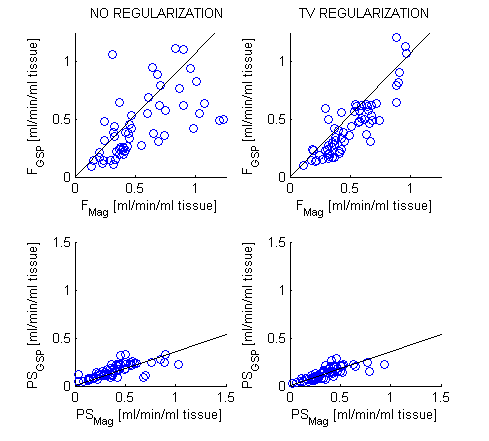
Compared to the common approach with no spatial priors, the TV regularization led to better spatial consistency, suppressed outlier values and preserved edges (Figs. 1,2). The scatter plots relating the results for the low-MW and high-MW recordings (Fig. 3) were more compact. The correlation coefficients (Table I) were clearly improved by the TV regularization. The regression coefficients of the scatter plots (Table I) were improved for Fp and impaired for vp (blood plasma volume). They were consistent with the known effects of contrast agent MW: Fp and vp independent of MW (regression coefficient 1) and PS lower for higher MW (regression coefficient <1).DISCUSSION AND CONCLUSION
A new approach to improve reliability of DCE-MRI has been presented. It is based on TV regularization implemented in an iterative manner. This provides reasonable computational demands and convergence properties of the algorithm as single voxel signals are analyzed with the spatial regularization formulated with respect to the results of the previous iteration. The evaluation showed an improved spatial consistency and agreement with the known effects of the contrast agent molecular weight when compared to the standard approach with no spatial regularization.Acknowledgements
This work was supported by GACR (1613830S) and MEYS (LO1212) projects.
References
1. Sourbron SP, Buckley DL. Tracer kinetic modelling in MRI:Estimating perfusion and capillary permeability. Phys Med Biol. 2012;57(2):R1–33.
2. Kelm BM, Menze BH, Nix O et al. Estimating Kinetic Parameter Maps From Dynamic Contrast-Enhanced MRI Using Spatial Prior Knowledge. IEEE T Med Imag. 2009;28(10):1534–1547.
3. Schmid VJ, Whitcher B, Padhani AR et al. Bayesian Methods for Pharmacokinetic Models in Dynamic Contrast-Enhanced Magnetic Resonance Imaging,” IEEE T Med Imag. 2006;25(12):1627–1636.
4. Sommer JC, Gertheiss J, Schmid VJ. Spatially regularized estimation for the analysis of dynamic contrast-enhanced magnetic resonance imaging data. Stat Med. 2014;33(6):1029–1041.
5. St. Lawrence KS, Lee T-Y. An Adiabatic Approximation to the Tissue Homogeneity Model for Water Exchange in the Brain: I. Theoretical Derivation. J Cerebr Blood F Met. 1998;18(12):1365–1377.
6. Jirík R, Soucek K, Mézl M et al. Blind Deconvolution in Dynamic Contrast-Enhanced MRI and Ultrasound. Conf. Proc. IEEE Eng Med Biol Soc. 2014:4276–9.
7. Jirík R, Taxt T, Soucek K et al. Comparison of the ATH and 2CXM Models UsingLow- and High-Molecular-Weight Contrast Agents in DCE-MRI. Abstracts of ESMRMB Conf. 2016;S447-448.
8. Li KL, Zhu XP, Waterton J, Jackson A. Improved 3D Quantitative Mapping of Blood Volume and Endothelial Permeability in Brain Tumors. J Magn Reson Imag. JMRI. 2000;12(2):347–57.
Figures