2892
Enhancement of Lesion Detection through Feature Projection and Classification of Perfusion Parameters1Cornell University, Ithaca, NY, United States, 2Weill Cornell Medicine, New York, NY, United States
Synopsis
Perfusion analysis is a powerful tool to quantitatively characterize lesions. This can further be extended to differentiate lesions through comparison perfusion parameters. Typically there is overlap in perfusion parameters which makes it difficult to distinguish lesions. We demonstrate perfusion analysis combined with feature projection and classification enhances lesion detection by increasing separability and extracting features of the lesions simultaneously which can be used in automation of lesion detection.
Introduction
Dynamic contrast-enhanced magnetic resonance imaging (DCE-MRI) is a non-invasive technique to quantitatively characterize tissue and an emerging tool in liver disease diagnosis and treatment assessment. Often a region of interest (ROI) is selected on time-resolved dynamic images and averaged over the area to produce a single enhancement curve. This curve is fitted to the solution of pharmacokinetic model to generate one set of perfusion parameters.
One way to distinguish hepatic lesions from each other is by comparing perfusion parameters. Since lesions, in particular disease ones, tend to be heterogeneous estimated parameters can have similar values with large standard deviations and typically overlap with each other. Feature projection techniques such as, discriminant analysis combines multi-dimensional (several features) data and through projection transforms it into a lower dimensional vector space. It also allows extracting and combining unique features in each dimension. DCE-MRI combined with discriminant analysis increases separability of liver lesions hence enhancing lesion detection. Furthermore, this technique can be used as a classifier which provides a framework to train a model with known classes along with their features and predict which class a new unknown member belongs to. In this study we implement discriminant analysis method in both feature projection and classification and assess performance of classifier by k-fold cross validation.
Methods
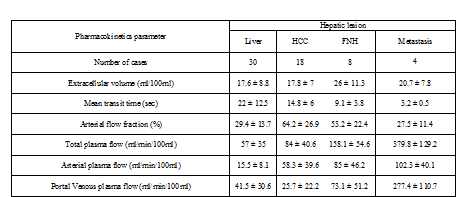
30 disease subjects including hepatocellular carcinoma (18), focal nodular hyperplasia (8), metastasis (4) , and their surrounding liver (30) were included in this study. Datasets were post processed using Patch Based Reconstruction of Undersampled Data (PROUD) algorithm for enhanced signal-to-noise ratio and high temporal frame rate (1) and output DICOM images were anonymized. Time-resolved images for each lesion were loaded into Platform for Research in Medical Imaging (PMI 0.4) package (2). This package has several pharmacokinetic models including the dual input compartment model which was selected for this study. This ROI-based model estimates perfusion parameters through non-linear (Levenberg-Marquardt algorithm) curve fitting to the solution of the compartmental model equation to calculate mean transit time (MTT), Extravascular Extracellular Space (EES), Arterial Fraction (AF), Total Plasma Flow (TPF), Arterial Plasma Flow (APF) and Portal Venous Plasma Flow (PPF). Once perfusion parameters are estimated discriminant analysis is implemented on classes (HCC, FNH, MET, liver) and features (MTT, EES, AF, TPF, APF, PPF) to perform feature projection and classification.
Linear discriminant analysis solves the following equation (3):
$$S_w^{-1}S_{B}w=\lambda{w}$$ (1)
where $$$S_{B},S_{W}$$$denote between class and within classes scattering matrix and $$$w$$$ is the transformation matrix. By minimizing the cost function, we find optimum projection vector which maximize the distance between classes and minimizing within class distance simultaneously. This becomes an eigenvalue ($$$\lambda$$$) problem and the largest eigenvalue indicates the projection vector that minimizes the cost function (4).
Results
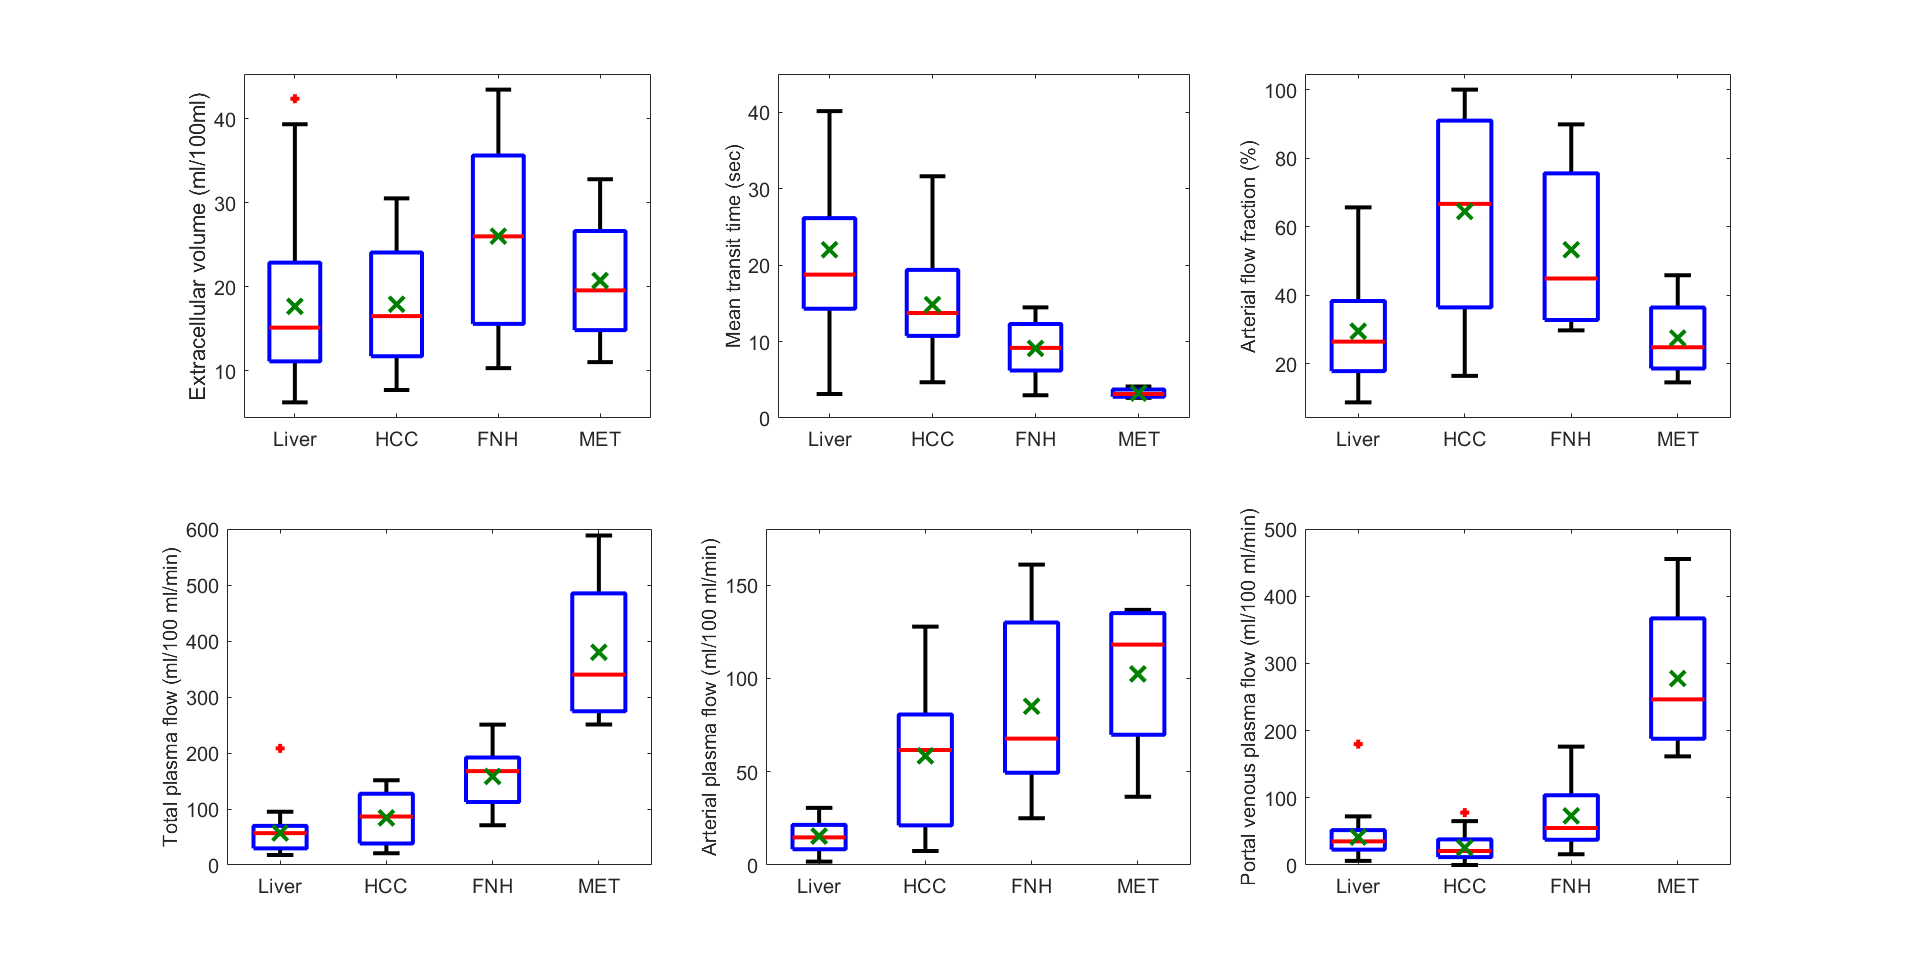
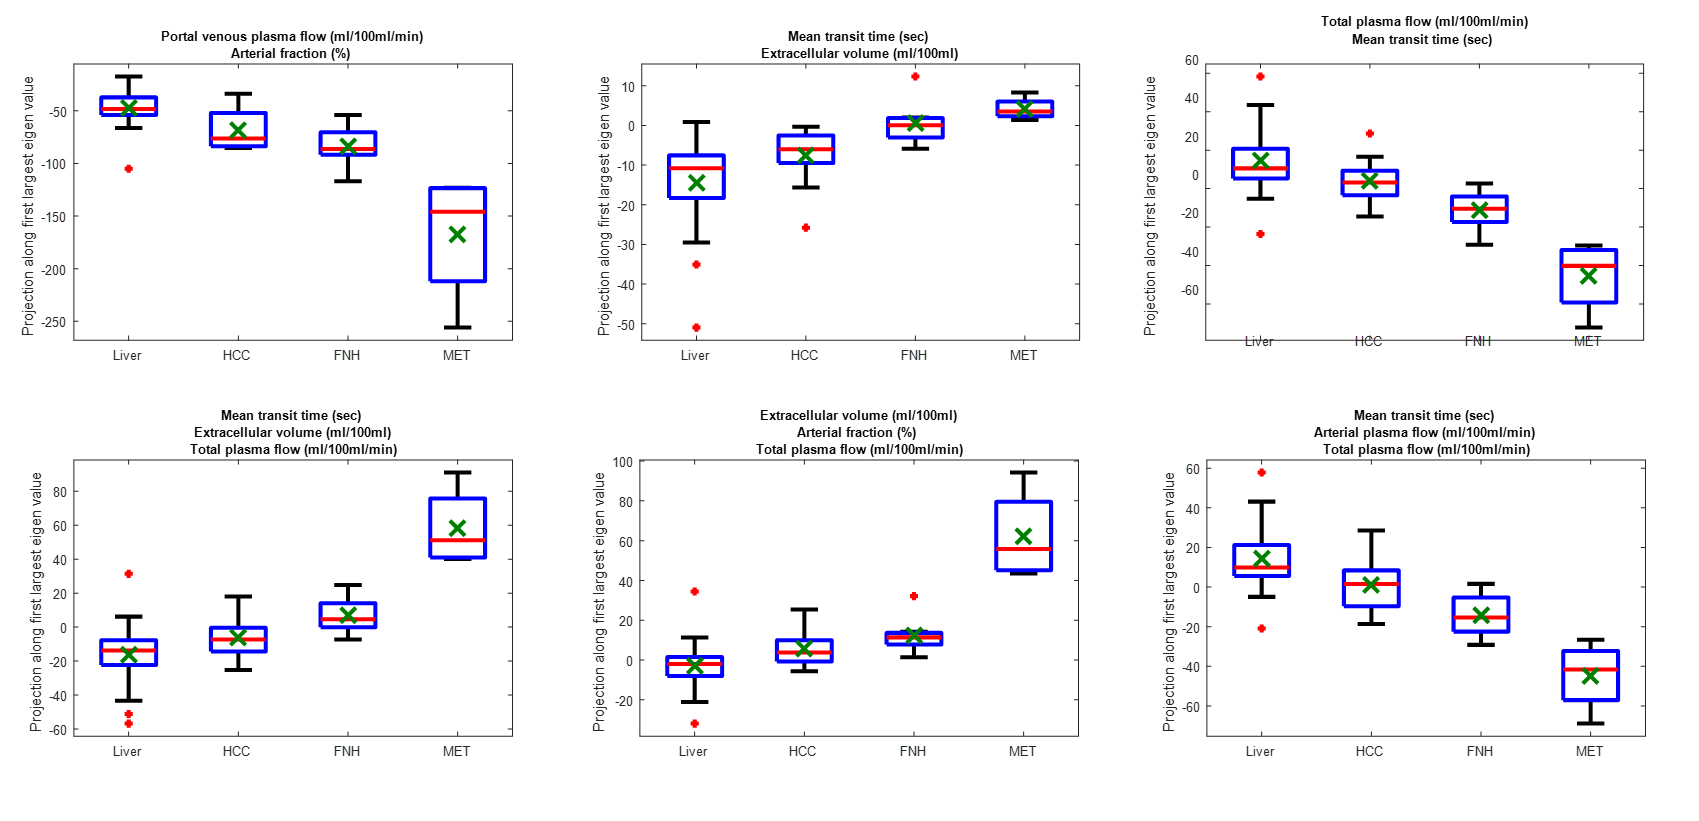
Table 1 reports values of features (mean+-standard deviation) in each class. Some classes are distinguishable from the rest including metastasis by inspecting features such as MTT, PPF, and TPF. However, mean value of features are similar in most classes with large standard deviations suggesting significant overlap. This is further visualized in Figure 1 along with median, minimum, maximum, and quantile of data sets. In contrast, Figure 2, representing feature projection results, shows increased separability (decrease in overlap) among each class with smaller variation inside in each class suggesting effectiveness of feature projection in differentiating lesions.
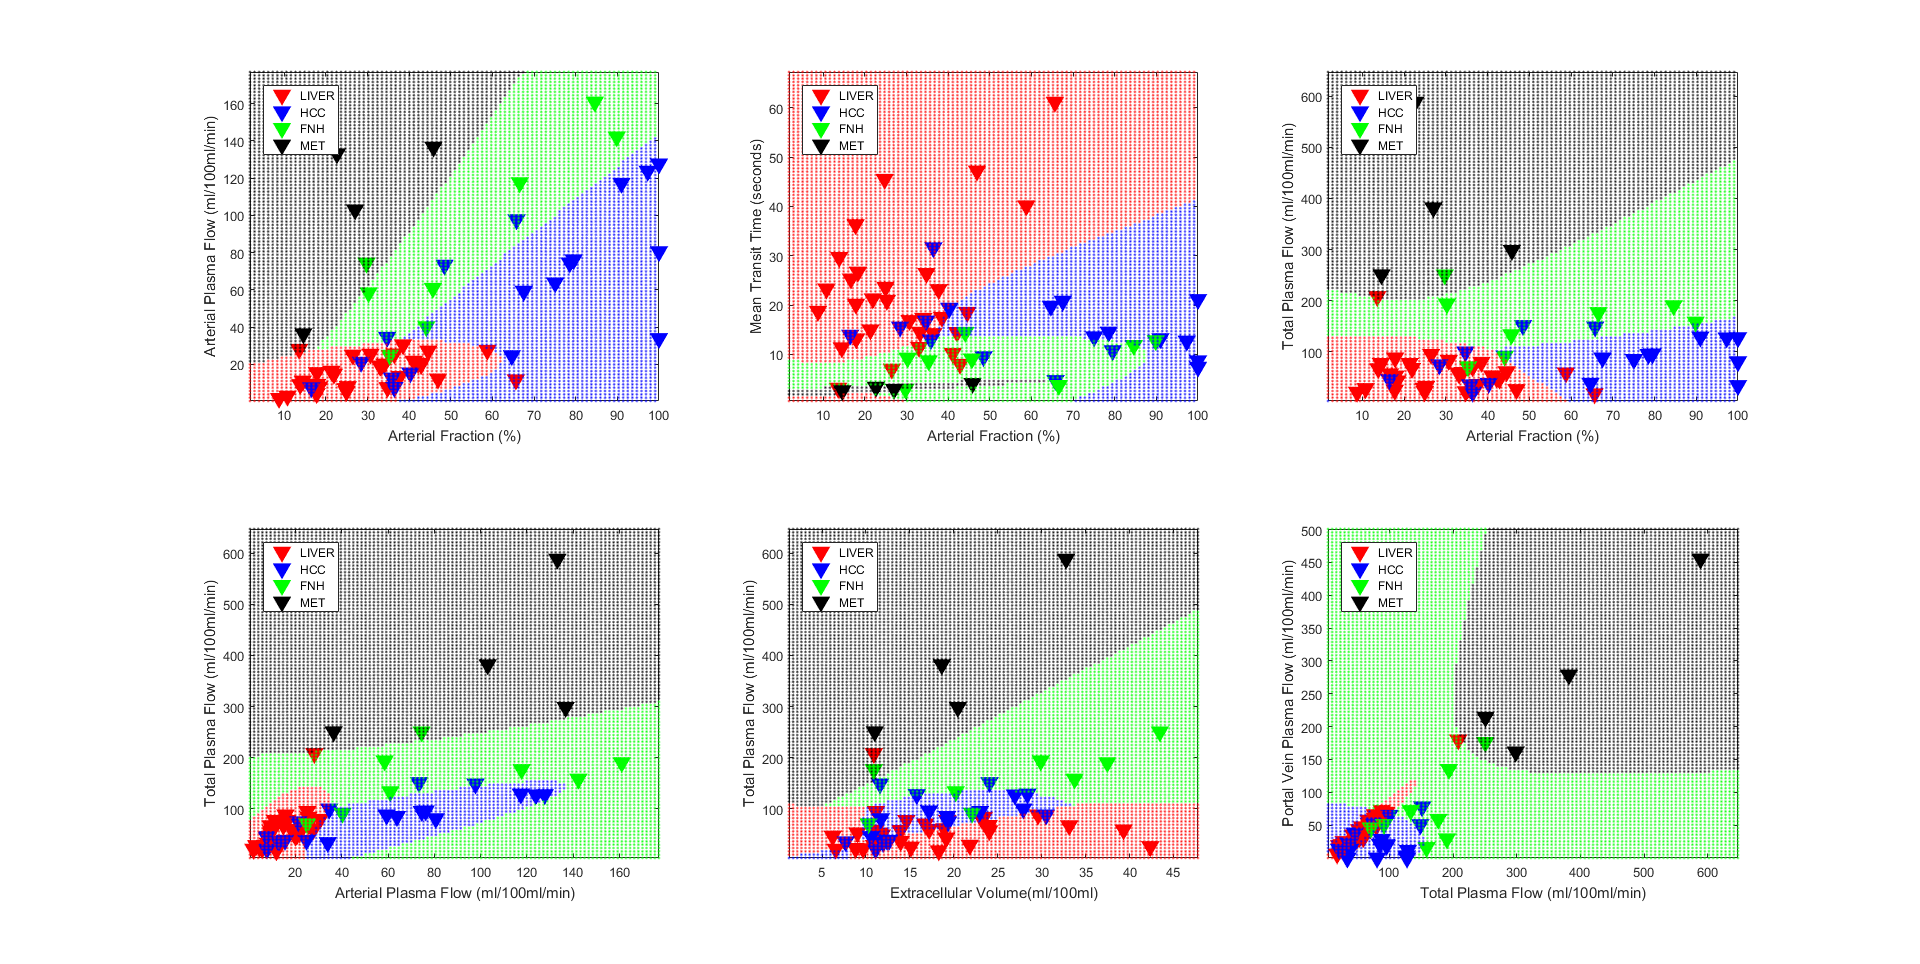
Figure 3 shows results of classification for combination of 2 features. In each plot known class members denoted by colored triangles, are used to train the model employing quadratic discriminant analysis. Then we generate a test grid that fills the map and each point on this grid is classified with the trained model from previous step. Classification results are highlighted with the same color as classes indicating margins where predictive members belong to. We can find misclassification in plots where a known class member (red triangle) doesn’t belong to predicted members of the classes (green grid region) specifically in borders between grid regions. K-fold cross validation for k=1 returned error of 34% which is expected since there are not many subjects in each class to train the model.
Discussion and Conclusion
We demonstrated feature projection of perfusion parameters enhances lesion detection, increases separability and decreases dimensionality. Dimensionality reduction along with feature extraction can be used to analyze large data sets and analyze features of perfusion parameters simultaneously. This study also indicates the potential of perfusion parameter projection and classification for automation of lesion detection in clinical practice as an alternative to current qualitative methods.Acknowledgements
This research was supported by NIH grants R01CA181566, R01NS072370, R01NS090464, and R01NS095562.References
1. Cooper M a, Nguyen TD, Xu B, Prince MR, Elad M, Wang Y, Spincemaille P. Patch based reconstruction of undersampled data (PROUD) for high signal-to-noise ratio and high frame rate contrast enhanced liver imaging. Magn. Reson. Med. [Internet] 2014;0:1587–1597. doi: 10.1002/mrm.25551.
2. Sourbron S, Biffar A, Ingrisch M, Fierens Y LR. PMI: platform for research in medical imaging. Magn Reson Mater Phy. 2009;22:539.
3. Welling M. Fisher Linear Discriminant Analysis. Science (80-. ). [Internet] 2009;1:1–3. doi: 10.1109/NNSP.1999.788121.
4. Roth V, Steinhage V. Nonlinear Discriminant Analysis Using Kernel Functions. Adv. Neural Inf. Process. Syst. 1999;12:568–574.
Figures