2891
Improved sensitivity for rectal cancer differentiation by T2*-correction in DCE-MRI1Oslo University Hospital, Oslo, Norway, 2Akershus University Hospital, Norway, 3Akershus University Hospital, Lørenskog, Norway, 4Sunnmøre MR-klinikk, Ålesund, Norway
Synopsis
Quantitative pharmacokinetic analysis from DCE-MRI often neglects CA-induced T2*-effect when converting signal intensity (SI) changes in tissue to CA concentration. The acquired signal may thus be significantly affected by T2* signal attenuation, which in turn results in errors in the DCE-derived parameters. This work utilized a dynamic multi-echo acquisition for extrapolation back to TE=0, thus providing both T2*-corrected and uncorrected measurements of DR1, and investigates the how the correction for T2*-attenuation effects may affect the sensitivity for rectal cancer differentiation by DCE-MRI. The T2*-corrected data showed improved differentiation of rectal cancer.
Introduction
Dynamic contrast-enhanced (DCE) MRI is increasingly used as to assess physiological properties in oncology1. Conventional DCE-MRI utilizes heavily T1-weighted sequences to minimize T2*-relaxation effects. However, given the presence of a contrast agent (CA), T2*-relaxation is significantly accelerated. Quantitative pharmacokinetic analysis often neglects this CA-induced T2*-effect when converting signal intensity (SI) changes in tissue to CA concentration. Depending on the applied echo time (TE), the acquired signal may be significantly affected by T2* signal attenuation, especially for high CA concentrations in blood, which in turn results in errors in the DCE-derived parameters. By using a dynamic multi-echo acquisition, T2* signal attenuation in the DCE-data may be corrected for by extrapolating the signal back to TE = 0, yielding the initial SI amplitude in the absence of T2*-effects. This approach has recently been shown to reduce errors in DCE-derived parameters2. The purpose of this work was to investigate the impact of CA-induced T2*-attenuation effects on kinetic parameter estimations following multi-echo DCE-MRI of rectal cancer.Materials and methods
This work reports results from 17 patients with resectable rectal cancer. Multi-echo DCE-MRI (1.5T) was acquired using a 3D multi-shot EPI sequence with three echoes, and with TR = 39ms, TE1 = 4.6ms, echo spacing = 9.3ms, flip angle = 28°, EPI factor = 9, SENSE factor = 1.7, temporal resolution » 2s/image volume with 60 dynamic series acquired, number of slices = 12, slice thickness = 10mm. The acquired matrix size was 92×90 over a 180×180mm field-of-view. The dynamic multi-echo sequence was run as part of a split-dynamic framework detailed in a recent study3. T2*-effects were eliminated by estimating the initial SI amplitude at each time-point by least-squares fitting of the multi-echo data, assuming a mono-exponential TE-dependence, thus extrapolating the signal back to TE = 0. The dynamic change in R1, ΔR1, was estimated from the first echo (TE = 4.6ms) and the initial signal amplitude (TE = 0) using the spoiled gradient echo signal equation, thus providing both T2*-corrected and uncorrected measurements of ΔR1. The ΔR1-time curves were then analyzed on a voxel-by-voxel basis using the extended Tofts pharmacokinetic model4, providing estimates of Ktrans, kep, ve and vp. Whole-tumor volumes of interest were delineated in a T2-weighted image series by an experienced radiologist and transferred to the parametric maps. All post-processing work was performed using the nordicICE software package (NordicNeuroLab, Bergen, Norway). The impact of CA-induced T2*-attenuation effects on kinetic parameter estimations was assessed by investigating the associations between histopathologic TN staging and the T2*-corrected and uncorrected DCE-parameters using Mann-Whitney U test. Statistical analysis was performed using MATLAB R2015a version 8.5.0 (Mathworks, Inc., Natick, Massachusetts, USA).Results
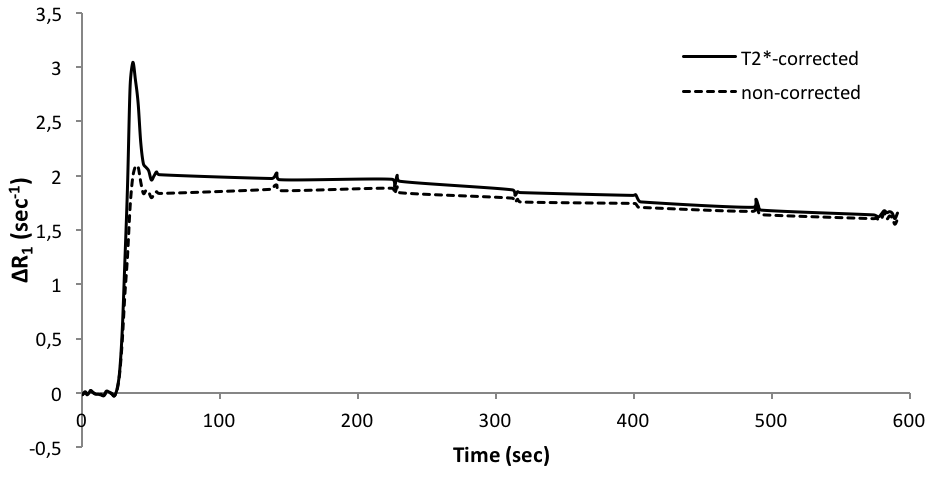
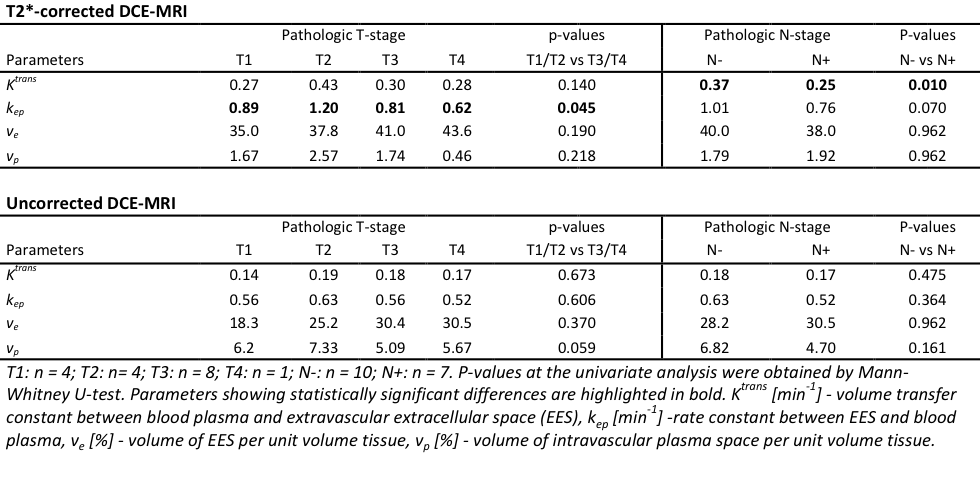
Figure 1 shows T2*-corrected and uncorrected ΔR1-time curves from a selected rectal cancer case. Note the difference in ΔR1 during the CA first pass. The T2*-corrected curve shows a strong transient increase in ΔR1, while the uncorrected signal clearly is attenuated by T2*-effects. Table 1 summarizes the associations between T2*-corrected and uncorrected kinetic parameters and histopathologic evaluation of the surgically resected specimens. For the T2*-corrected data, patients with histologically confirmed nodal metastasis showed a significantly lower tumor Ktrans (p = 0.010) than patients without nodal metastasis. In addition, T1- and T2 stage tumors showed a significantly higher kep (p = 0.045) compared to T3- and T4 stage tumors. For the uncorrected data, no significant associations were found between the DCE parameters and the histopathologic TN staging.Discussion
Uncorrected T2*-effects results in signal attenuation of the first-pass peak, which in turn results in unreliable estimation of kinetic parameters. In the current study, a relatively long TE of 4.6ms was used for the uncorrected data, and it is expected that the impact of T2*-effects is reduced by using shorter TE. However, for correct quantification of kinetic parameters and improved sensitivity for rectal cancer differentiation, correction for T2*-attenuation effects should be made.Acknowledgements
No acknowledgement found.References
1. Türkbey B, Thomasson D, Pang Y, Bernardo M, Choyke PL. The role of dynamic contrast-enhanced MRI in cancer diagnosis and treatment. Diagn Interv Radiol. 2010;16(3):186-192
2. Kleppestø M, Larsson C, Groote I, et al. T2*-correction in dynamic contrast-enhanced MRI from double-echo acquisitions. J Magn Reson Imaging. 2014;39(5):1314-1319
3. Grøvik E, Bjørnerud A, Storås TH, Gjesdal KI. Split dynamic MRI: Single bolus high spatial–temporal resolution and multi contrast evaluation of breast lesions. J Magn Reson Imaging. 2014;39(3):673-682
4. Tofts PS. Modeling tracer kinetics in dynamic Gd-DTPA MR imaging. J Magn Reson Imaging. 1997;7(1):91-101
5. Tofts PS, Brix G, Buckley DL, et al. Estimating kinetic parameters from dynamic contrast-enhanced T(1)-weighted MRI of a diffusable tracer: standardized quantities and symbols. J Magn Reson Imaging. 1999;10(3):223-232
Figures