2890
Quantitative evaluation of the effect of temporal resolution and acquisition duration on the accuracy of DCE-MRI measurements in a prostate phantom1School of Medicine / National Centre for Advanced Medical Imaging (CAMI), Trinity College University of Dublin / St James's Hospital, Dublin 8, Ireland, 2School of Physics & Medical Ultrasound Physics and Technology Group, Centre of Industrial Engineering Optics, FOCAS, Dublin Institute of Technology, Dublin 8, Ireland
Synopsis
A novel anthropomorphic prostate phantom test device was used to investigate the effects of temporal resolution (Tres) and acquisition duration (AD) on the accuracy of contrast time-intensity curves measured using dynamic contrast-enhanced MRI. When quantitatively compared to ground truth values, large errors in derived pharmacokinetic (PK) parameters (up to 230%) were found for Tres values > 8.1 s and AD values < 360 s. The data demonstrate the critical and sensitive dependence of the accuracy of measured PK output parameter values on the acquisition protocol used, while such phantom studies can help identify optimal acquisition parameters for DCE-MRI scans
Introduction
The temporal resolution (Tres) at which dynamic contrast enhanced (DCE) MRI data are acquired, as well as the overall acquisition duration (AD), influence the accuracy of measured physiological contrast time-intensity curves (CTCs) and consequently pharmacokinetic (PK) parameters deriving from these 1. However, to date there is no consensus as to the optimum Tres and AD values to use for prostate DCE-MRI, with previous studies reporting a wide range of values (Tres ≈ 2-30 s; AD ≈ 90-760 s) 2-5. In the present work a novel anthropomorphic phantom device was used which allowed for two precisely known ground truth CTCs to be produced simultaneous in an anthropomorphic environment and presented to the scanner for measurement 6. The phantom device provided a platform which facilitated a quantitative investigation of the effect of Tres and AD on the accuracy of MR-measured CTCs and derived PK parameter values.Methods
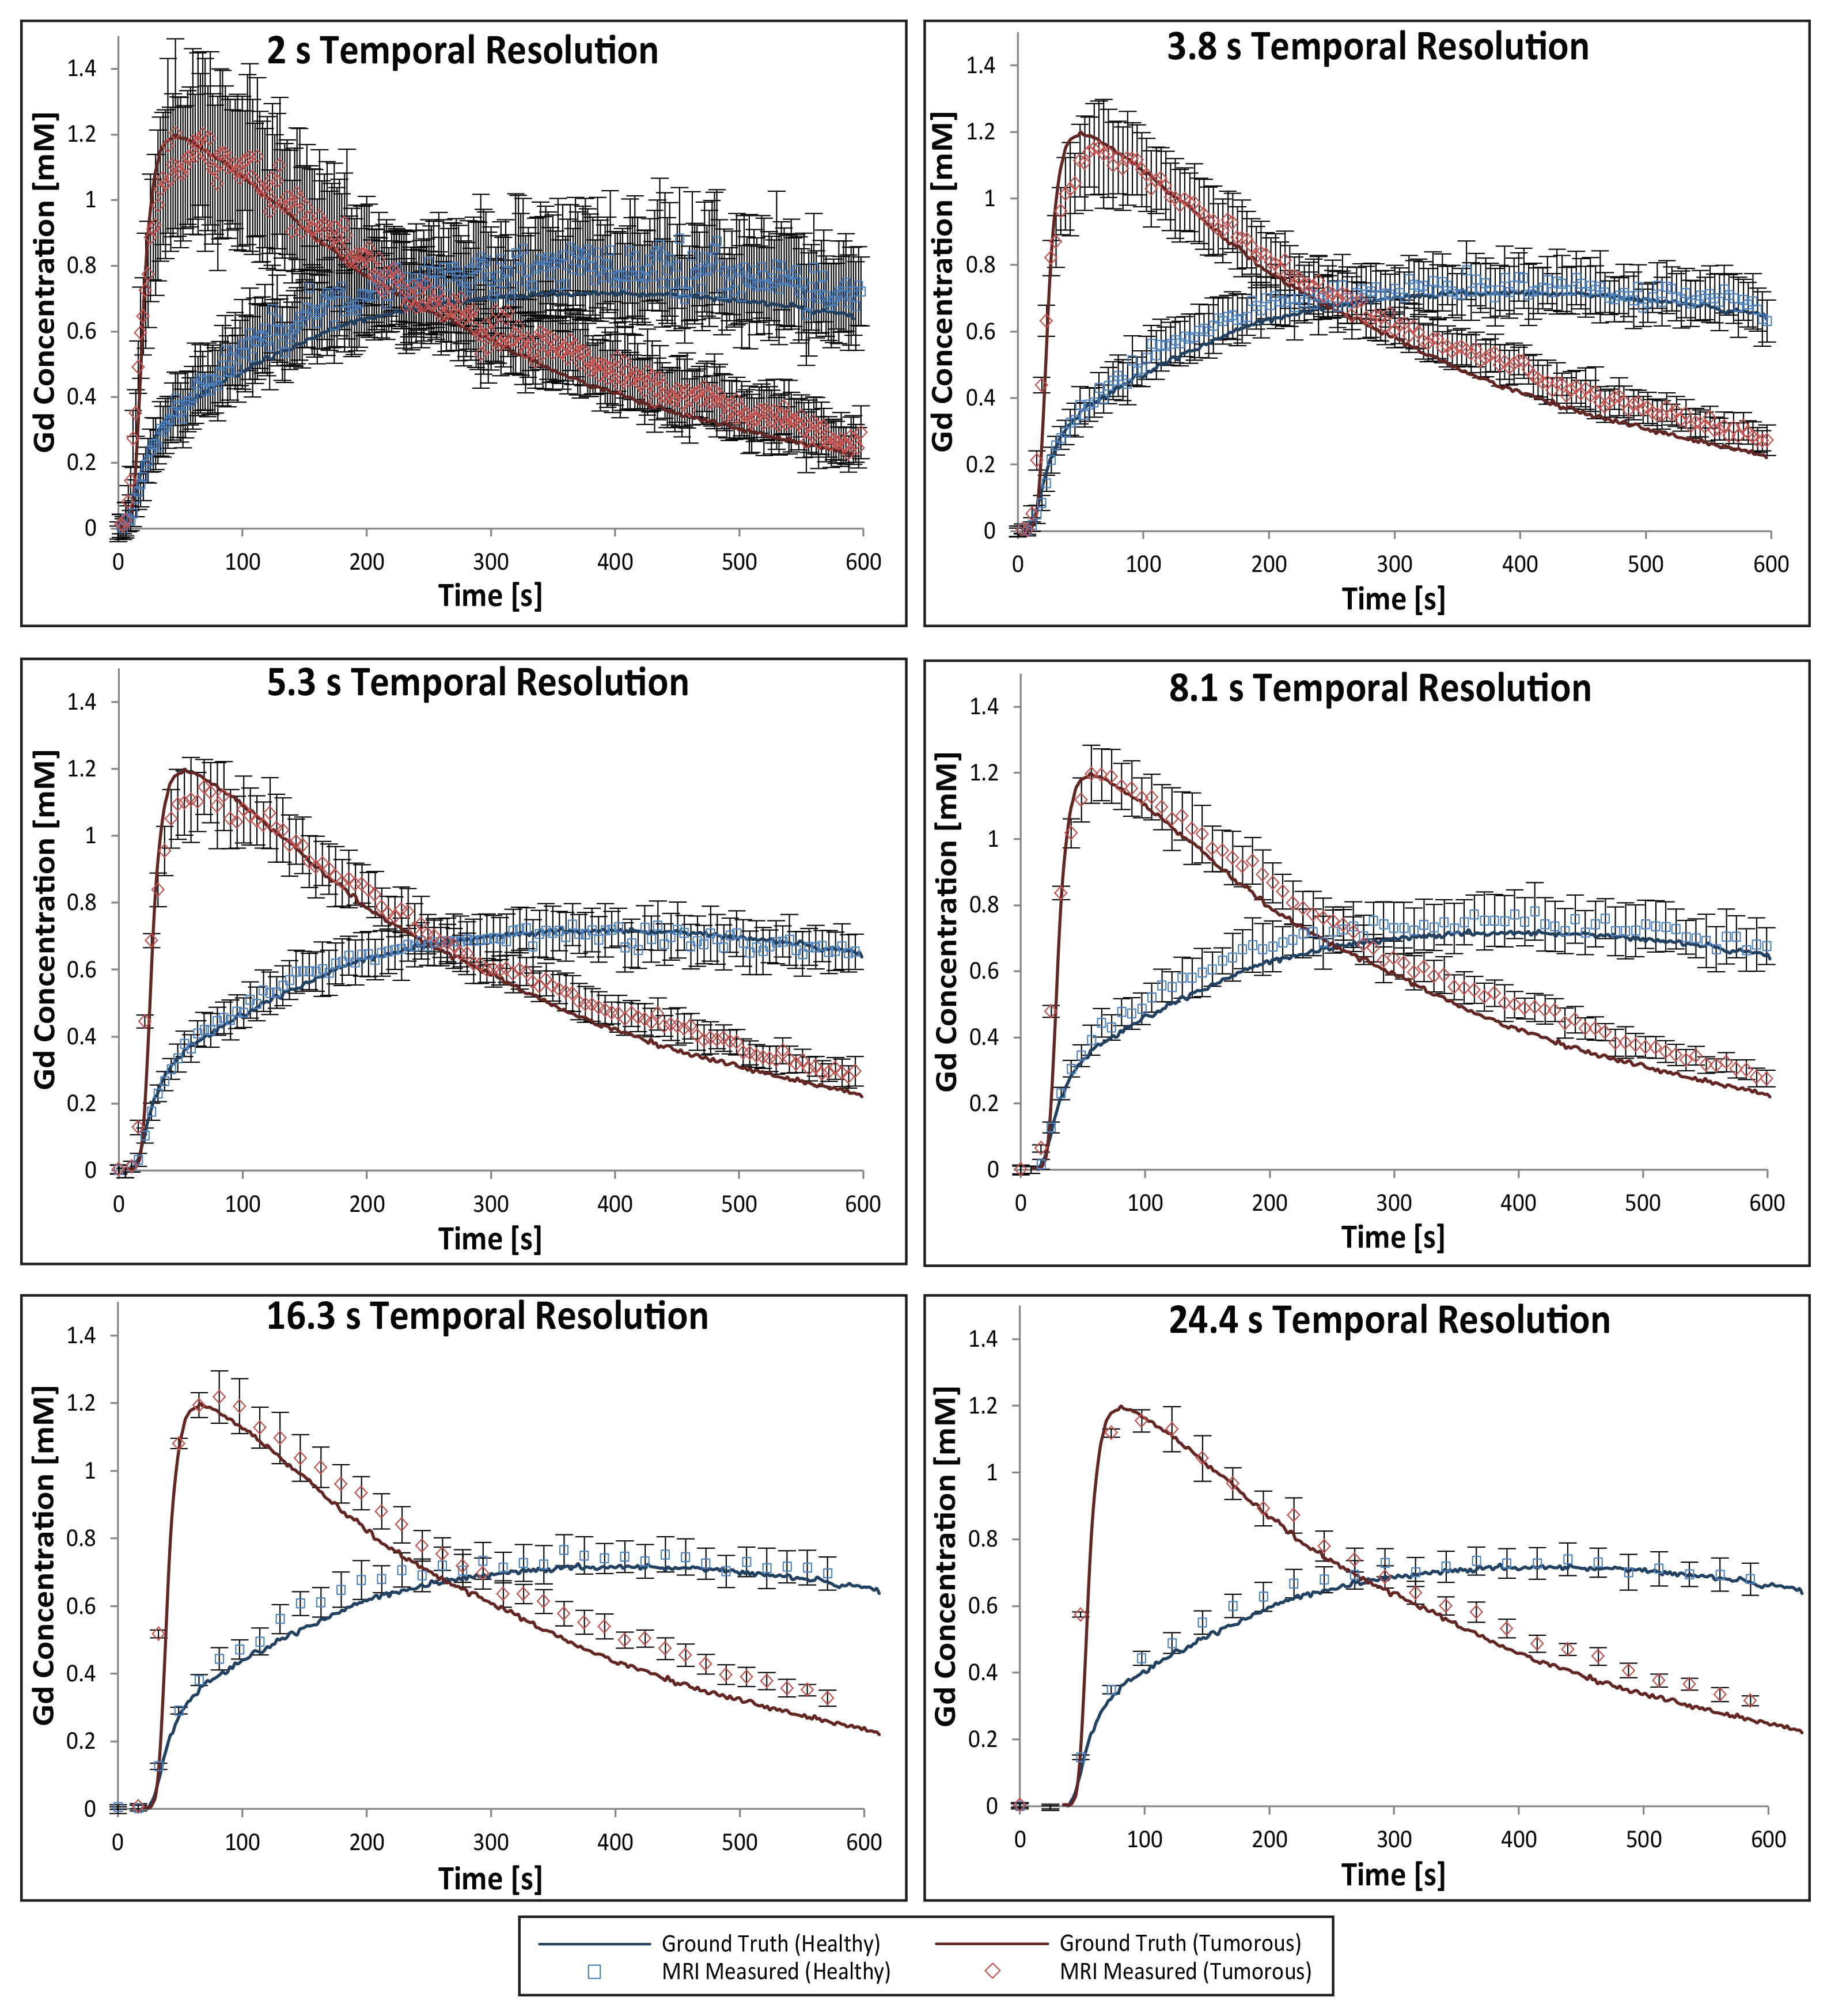
‘Healthy’ and ‘tumorous’ tissue-mimicking CTCs were generated using the standard Tofts model 7, a model AIF 8, and input PK parameters taken from representative published patient data. Ground truth CTCs were established from repeated measurements made using a highly precise, high spatiotemporal-resolution custom-built optical imaging system (4 x 4 µm2 pixels resolution, Tres = 1 s, repeat optical measurements concordance correlation coefficient (CCC) = 0.992, 95% C.I. = [0.990, 0.993]) 6. DCE-MRI data were acquired using a 3T scanner (Achieva, Philips, Netherlands) and 32-channel phased array detector coil (3D-SPGR, TR/TE = 4.3/1.4 ms, α = 10°, FOV = 224 x 224 x 80 mm3, spatial resolution = 1 x 1 x 4 mm3). With no parallel imaging (PI) and a single signal average, this resulted in a Tres of 8.1 s. This protocol was then modified by applying PI to produce protocols with Tres values of 2, 3.8, and 5.3 s. Additionally, the number of signal averages were increased to produce protocols with Tres = 16.3 and 24.4 s. The fully-sampled MR data thus acquired (CTC AD = 600 s) was then retrospectively truncated to produce sub-sets of data at AD = 480, 360, 240, 180, 120, 60, and 30 s.
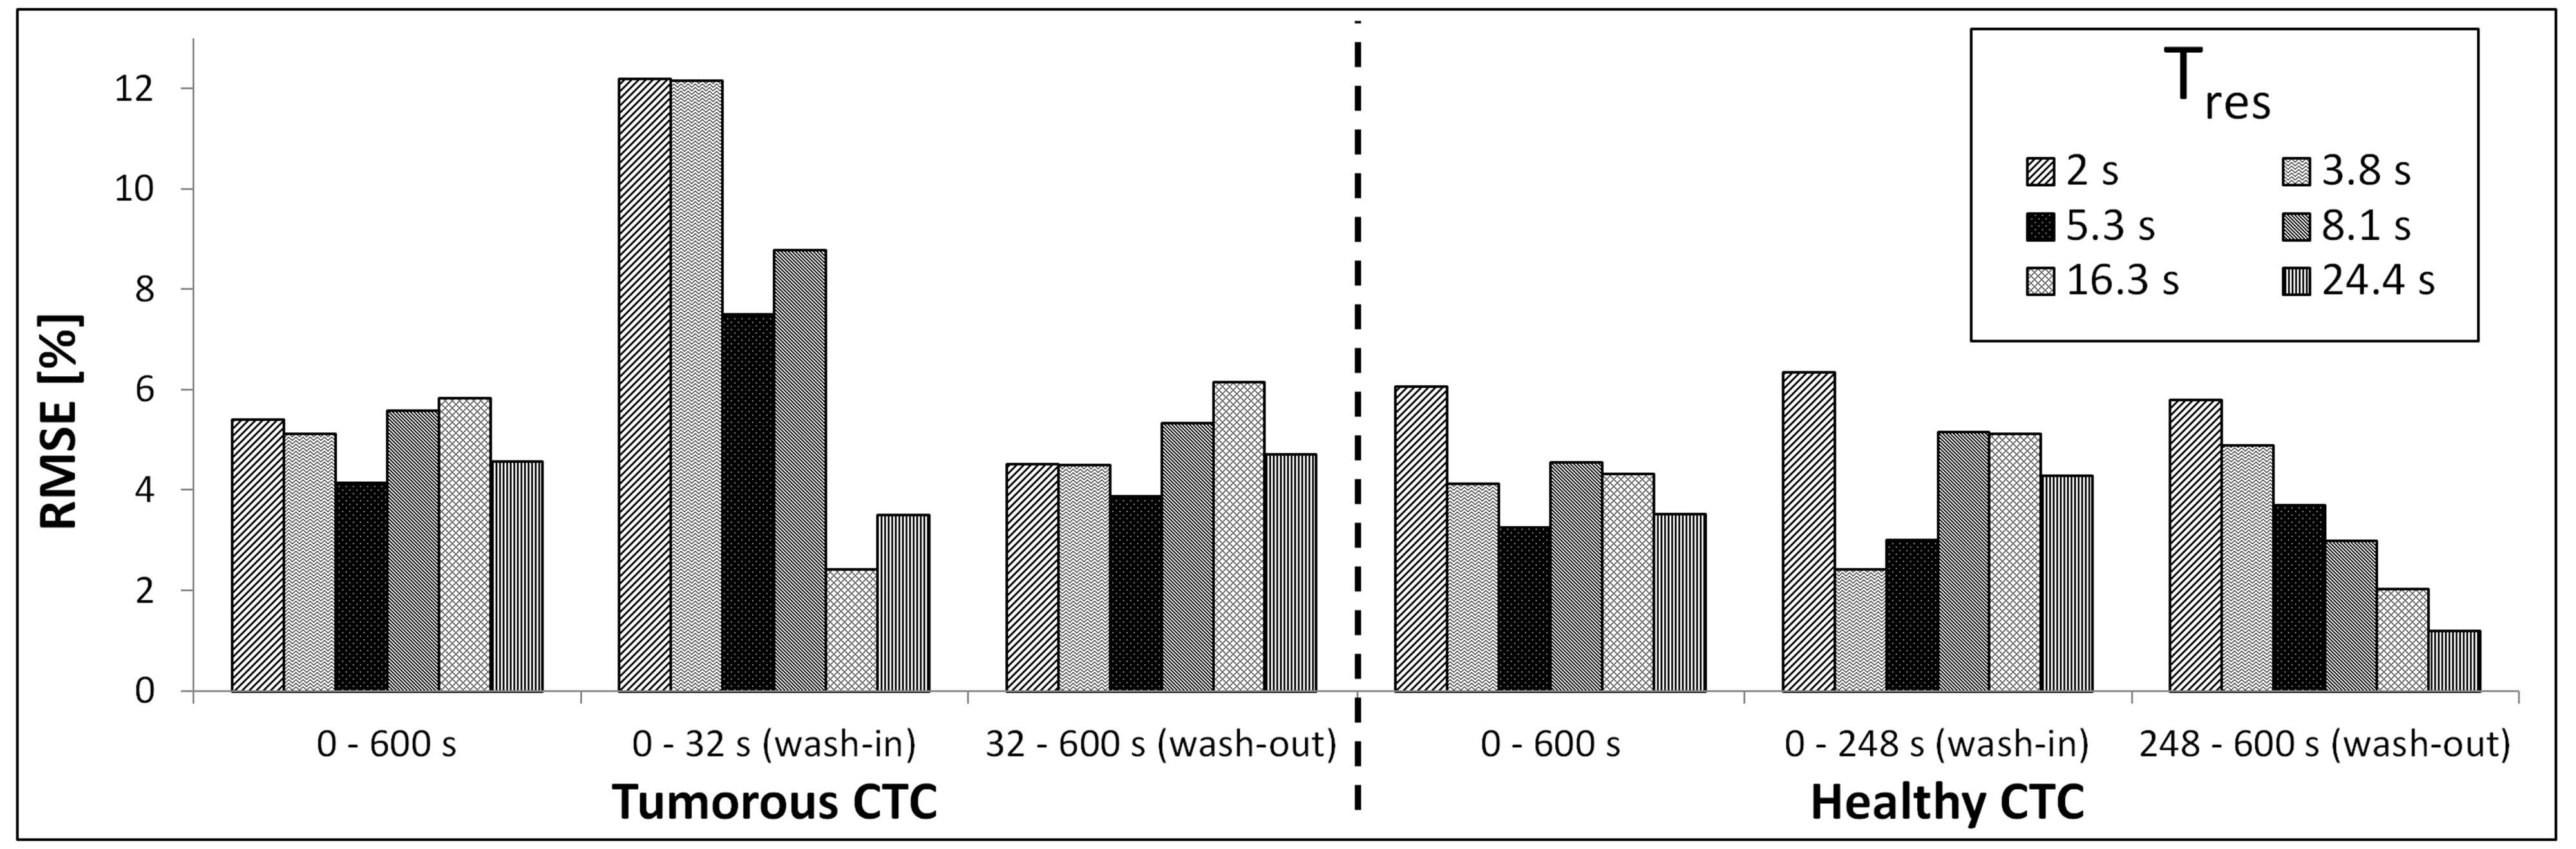
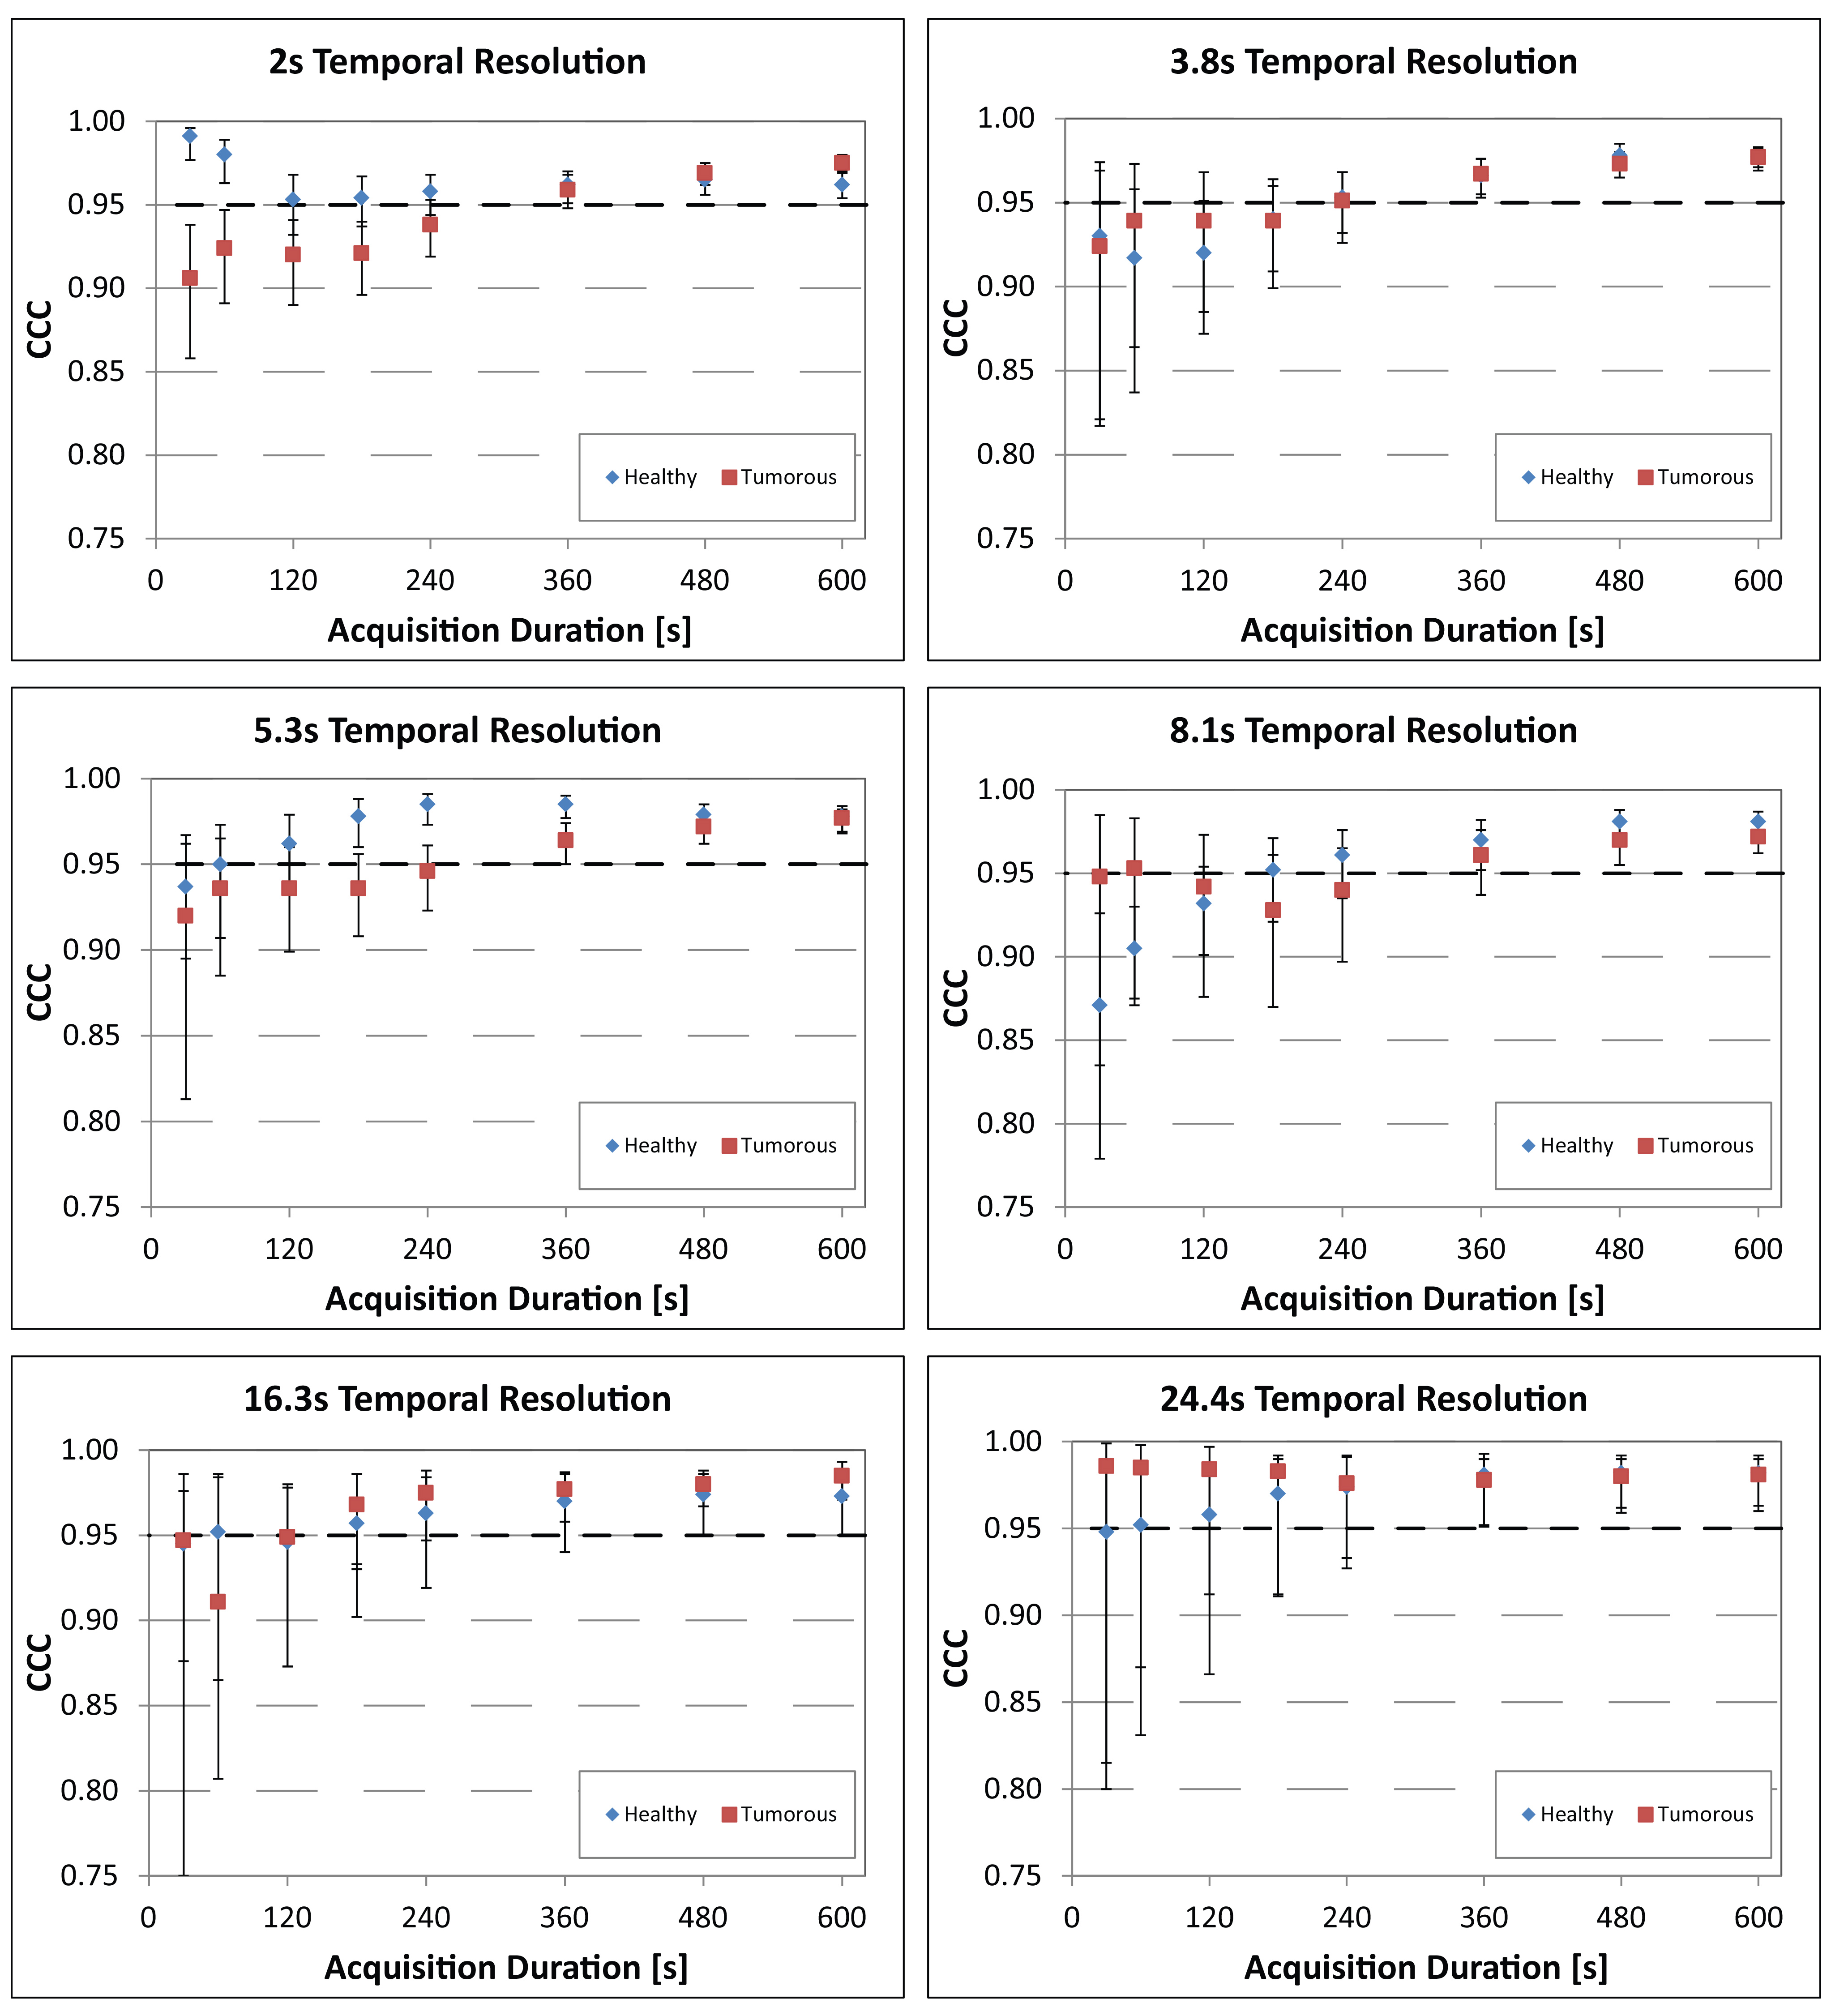
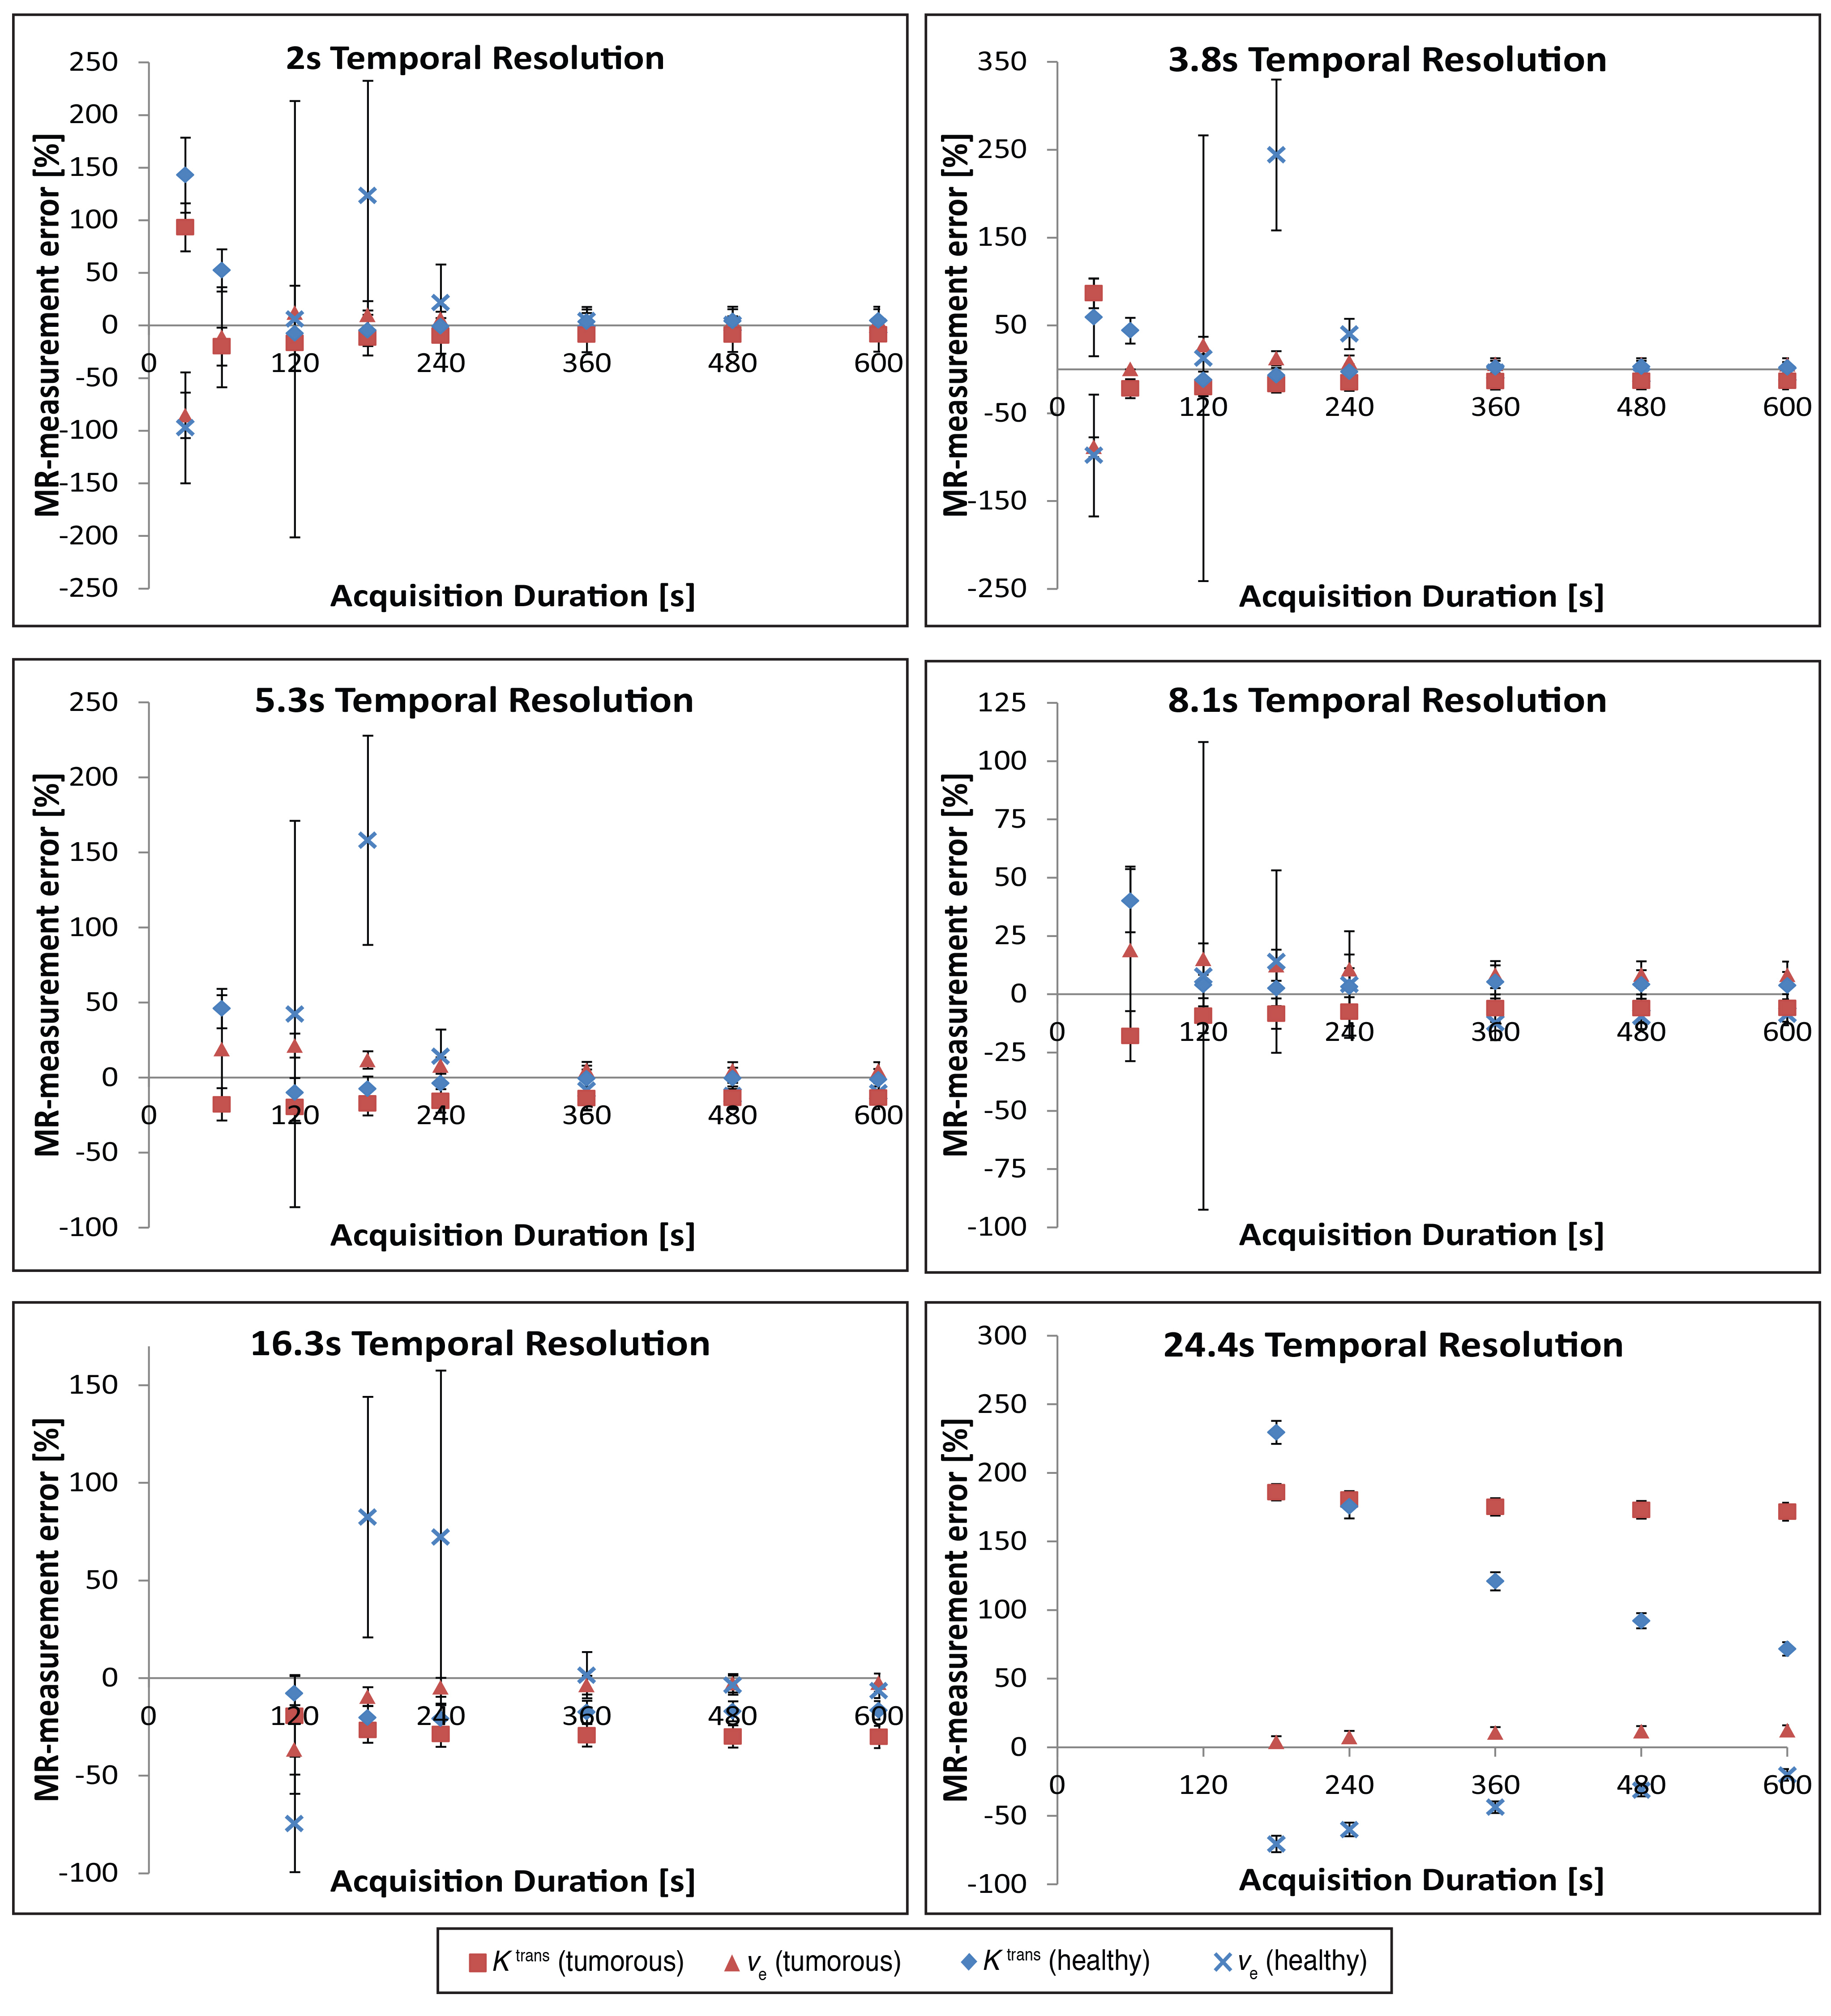
Root mean square errors (RMSE) and CCC values were calculated between the MR-measured and ground truth CTCs. RMSE values were calculated for the entire CTC, as well as the wash-in and wash-out portions of the curve, and are reported as a percentage of the maximum contrast agent concentration change (%RMSE). CCC values were calculated for the MR-data verses ground truth values at Tres = 2 – 24 s and AD = 30 – 600 s. Voxel-wise PK modelling using the standard Tofts model was performed using the DCEMRI.jl toolkit 9 on two manually-selected regions of interest, each containing 26 voxels, and Ktrans and ve values derived from the MR-measured CTCs were compared with the ground truth values.
Results
The MR-measured CTCs, acquired at different Tres values, are presented in figure 1 (along with the ground truth CTCs). RMSE analyses, empirically comparing MR-measured to ground truth CTCs, revealed the highest %RMSE in the rapidly-changing wash-in phase of the tumorous CTC (up to 12%) using Tres ≤ 3.8 s (see figure 2). As shown in figure 3, for AD values ≥ 360 s, the CCC values were consistently > 0.95 for all Tres values tested, with lower CCC values generally calculated for shorter AD values. Overall CCC values were higher for the data measured using the slowest protocols tested (Tres = 16.3 and 24.4 s). Errors in Ktrans and ve values were below 14% and 12%, for acquisitions with Tres ≤ 8.1 s, AD ≥ 120 s and Tres ≤ 16.3 s, AD ≥ 360 s respectively, but increased dramatically outside these ranges (up to 230%), as shown in figure 4. There was no major gain in PK parameter measurement accuracy using AD > 360 s, at Tres ≤ 8.1 s. The data measured at Tres = 24.4 s gave the greatest errors in the measurement of both Ktrans and ve.Discussion / Conclusion
The present phantom study quantitatively compared MR-measured to known ground truth CTCs, finding large errors in PK parameters derived from the data when acquired with certain Tres and AD values. This type of quantitative phantom approach can be used to optimise and validate new and existing DCE acquisition protocols, ensuring consistent measurement accuracy, and offers the prospect of increasing the sensitivity and specificity of DCE-MRI for prostate cancer detection, possibly leading to a standardisation in the way DCE-MRI is performed in the prostate, and a wider acceptance of the technique for use in routine clinical examinations.Acknowledgements
Supported by Irish Cancer Society Research Scholarship CRS13KNIReferences
1. Aerts HJ, Jaspers K, Backes WH. The precision of pharmacokinetic parameters in dynamic contrast-enhanced magnetic resonance imaging: the effect of sampling frequency and duration. Phys Med Biol. 2011;56:5665-78.
2. Rosenkrantz AB, Geppert C, Grimm R, et al. Dynamic contrast-enhanced MRI of the prostate with high spatiotemporal resolution using compressed sensing, parallel imaging, and continuous golden-angle radial sampling: Preliminary experience. J Magn Reson Imaging. 2015;41:1365-73.
3. Barrett T, Gill AB, Kataoka MY, et al. DCE and DW MRI in monitoring response to androgen deprivation therapy in patients with prostate cancer: a feasibility study. Magn Reson Med. 2012;67:778-85.
4. Haq NF, Kozlowski P, Jones EC, et al. A data-driven approach to prostate cancer detection from dynamic contrast enhanced MRI. Comput Med Imaging Graph. 2015;41:37-45.
5. Villers A, Puech P, Mouton D, et al. Dynamic contrast enhanced, pelvic phased array magnetic resonance imaging of localized prostate cancer for predicting tumor volume: correlation with radical prostatectomy findings. J Urol. 2006;176:2432-7.
6. Knight SP, Browne JE, Meaney JF, et al. A novel anthropomorphic flow phantom for the quantitative evaluation of prostate DCE-MRI acquisition techniques. Phys Med Biol. 2016;61:7466-83.
7. Tofts PS, Brix G, Buckley DL, Evelhoch JL. Estimating Kinetic Parameters From Dynamic Contrast-Enhanced T1-Weighted MRI of a Diffusable Tracer: Standardized Quantities and Symbols. Magn Reson Med. 1999;10:223–32.
8. Parker GJ, Roberts C, Macdonald A, et al. Experimentally-derived functional form for a population-averaged high-temporal-resolution arterial input function for dynamic contrast-enhanced MRI. Magn Reson Med. 2006;56:993-1000.
9. Smith DS, Li X, Arlinghaus LR, Yankeelov TE, Welch EB. DCEMRI.jl: a fast, validated, open source toolkit for dynamic contrast enhanced MRI analysis. PeerJ. 2015;3:e909.
Figures