2889
Repeatability of perfusion parameters in free-breathing dynamic contrast-enhanced MRI of malignant hepatic tumors1Ajou University Hospital, Ajou University School of Medicine, Suwon, Korea, Republic of, 2Asan Medical Center, Ulsan University College of Medicine, Seoul, Korea, Republic of, 3Bioimaging Center, Asan Institute for Life Sciences, Asan Medical Center, Seoul, Korea, Republic of, 4Severance Hospital, Yonsei University College of Medicine, Seoul, Korea, Republic of
Synopsis
In dynamic contrast-enhanced (DCE)-MRI, establishing a high level of repeatability is essential to ensure reliability of changes in perfusion parameters over longitudinal studies in an individual subject. To assess the repeatabilities of perfusion parameters and identify the effect of T1 map on them, we performed two sequential free-breathing DCE-MRI studies in patients with solid hepatic malignancies. Our results showed that Kep had the highest repeatability, and the repeatabilities of all perfusion parameters were boosted when fixed T1 value (800 ms) was used instead of values obtained from T1 mapping.
Introduction
Dynamic contrast-enhanced MRI (DCE-MRI) enables to assess therapeutic responses in tumors by quantifying the changes of perfusion parameters1. In order to guarantee the significance of such changes in an individual subject, achieving a high level of repeatability between each study is absolutely critical2. T1 value is one of many factors that can lead to high variability in calculated perfusion parameters3. The purpose of our study is to assess the repeatability of perfusion parameters and to identify the effect of T1 maps on repeatability in free-breathing DCE-MRI of malignant hepatic tumors (ClinicalTrials.gov Identifier, NCT02201797).Methods
Twelve prospectively-enrolled patients with solid hepatic tumors underwent two sequential free-breathing DCE-MRI examinations in a 3.0T machine (Skyra; Siemens) two to 14 days apart. Free-breathing dynamic scans were conducted using CAIPIRINHA-VIBE sequence (TR/TE, 3.8/1.6 ms; flip angle, 25°; matrix size, 256x256) for 306 seconds with temporal resolution of five seconds after 0.1 mmol/kg bolus administration of Dotarem at an injection rate of 2 mL/s. For T1 mapping, unenhanced T1-weighted CAIPIRINHA images with seven flip angles (2°, 5°, 10°, 15°, 20°, 25°, 30°) were acquired. The volume transfer constant (Ktrans), blood-normalized initial area under the enhancement curve over the first 60 seconds after injection (iAUC60), the volume of extracellular extravascular space (EES) per volume unit of tissue (Ve), and the flux rate constant between EES and plasma (Kep) of the tumor and liver parenchyma with and without T1 mapping were calculated by a single-input dual-compartment model using a dedicated postprocessing software (Tissue 4D, Siemens). For the non-T1 map based perfusion parameter analysis, T1 value of 800 ms was used4. The repeatability of each parameter was assessed by within-subject coefficient of variation (WSCV).Results
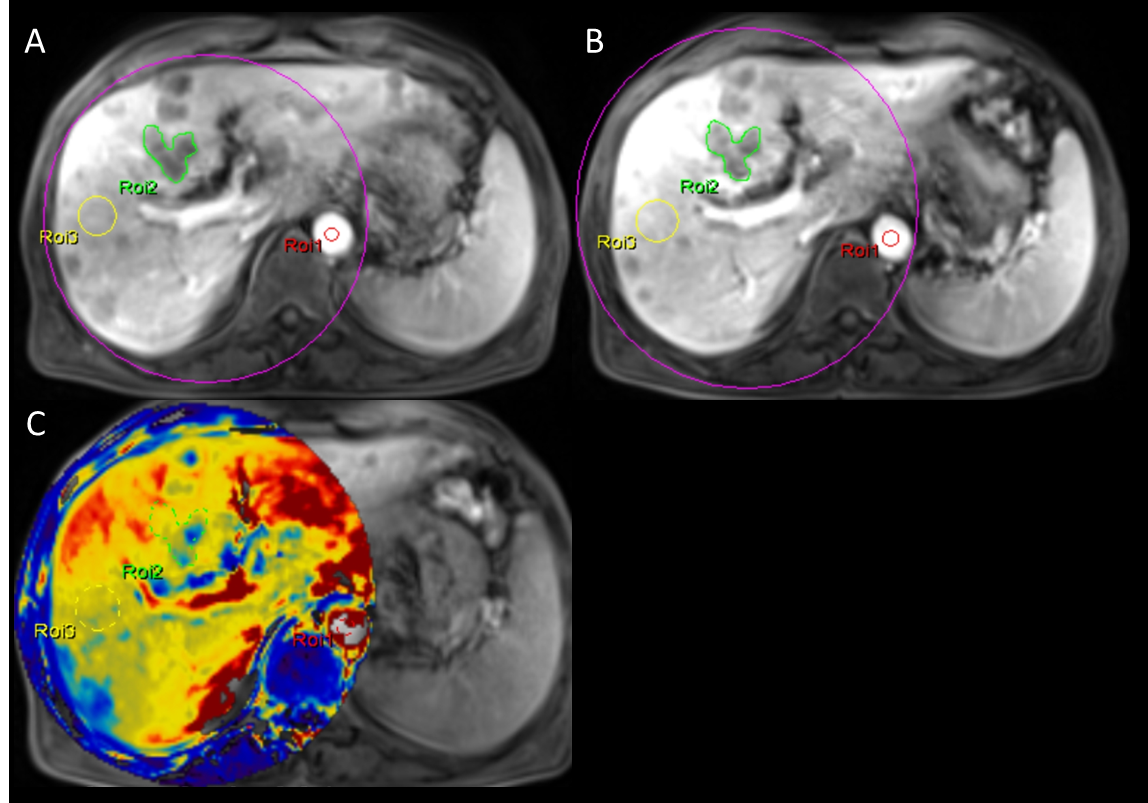
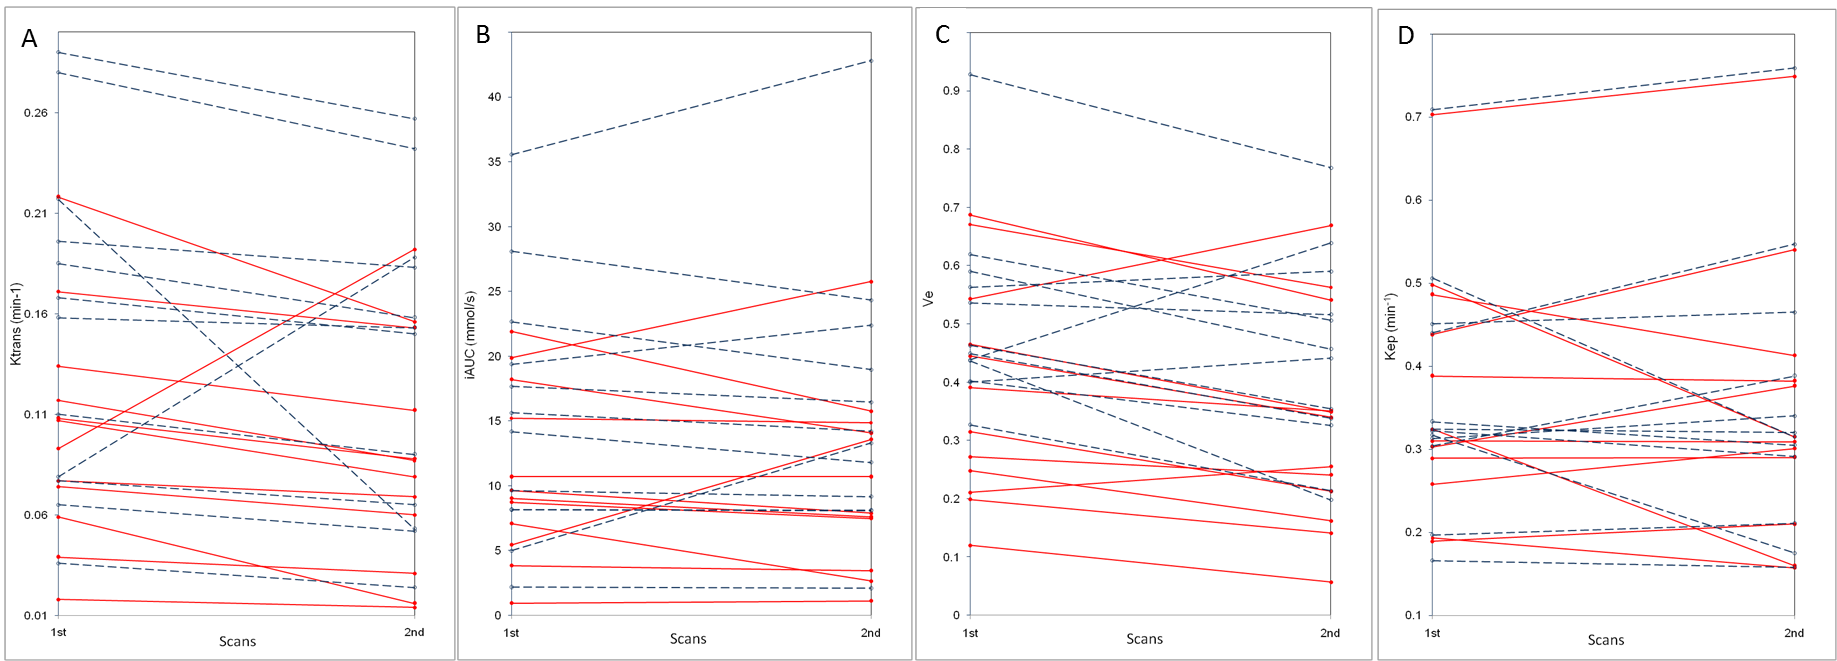
In all patients, DCE-MRIs with high temporal resolution (five seconds) and spatial resolution (1.48 x 1.48 mm) along with voxel-wise perfusion maps were successfully obtained. In two sets of sequential examinations, region-of-interests could be confidently drawn at the identical locations over the target tumors and the liver parenchyma (Fig. 1). The tumors’ WSCVs for Ktrans, iAUC60, Ve, and Kep with and without T1 mapping were 29.5%, 25.8%, 18.6%, 16.9% and 19%, 16.8%, 19%, 16.1%, respectively (Fig. 2). In liver parenchyma, WSCVs for Ktrans, iAUC60, Ve, and Kep with and without T1 mapping were 16.7%, 20.4%, 20.5%, 13.2%, and 12.7%, 14.9%, 18.4%, 13%, respectively. The median and the range of tumors’ Ktrans, iAUC60, Ve, and Kep with and without T1 map were 0.079 (0.014-0.22), 9.03 (0.95-25.7), 0.34 (0.057-0.687), 0.31 (0.16-0.75) and 0.15 (0.024-0.29), 14.2 (2.08-42.8), 0.45 (0.20-0.93), 0.32 (0.16-0.76), respectively. In liver parenchyma, the values were 0.181 (0.086-0.31), 14.4 (6.9-35), 0.23 (0.13-0.53), 0.71 (0.31-1.1) and 0.2 (0.085-0.32), 17.3 (8.5-25.6), 0.27 (0.14-0.65), 0.71 (0.31-1.1), respectively.Discussion and Conclusion
Our results demonstrated that Kep had the highest repeatability among four perfusion parameters (Ktrans, iAUC60, Ve, Kep) obtained with free-breathing CAIPIRINHA DCE-MRI both in hepatic tumors and liver parenchyma. In addition, repeatability of all parameters was enhanced when tissue T1 map was disregarded; WSCVs of hepatic tumors ranged from 17-30% with T1 map and 16-20% without T1 map. On liver parenchyma, the WSCVs ranged from 13-20% with T1 map and 13-18% without T1 map. In a setting of longitudinal within-subject study, a reliable measurement of the amount of change between each scan is essential. In conclusion, Kep demonstrated the best repeatability in free-breathing CAIPIRINHA DCE-MRI. The repeatability of perfusion parameters were boosted when fixed T1 value was used instead of values from T1 mapping.Acknowledgements
No acknowledgement found.References
[1] O’connor JP, Jackson A, Parker GJ, et al. Dynamic contrast-enhanced MRI in clinical trials of antivascular therapies. Nat.Rev.Clin.Oncol. 2012;9:167-177
[2] Galbraith SM, Lodge MA, Taylor NJ, et al. Reproducibility of dynamic contrast-enhanced MRI in human muscle and tumours: comparison of quantitative and semi-quantitative analysis. NMR Biomed. 2002;15(2):132-142.
[3] Wang CH, Yin FF, Horton J, et al. Review of treatment assessment using DCE-MRI in breast cancer radiation therapy. World Journal of Methodology. 2014;4(2):46-58
[4] de Bazelaire CM, Duhamel GD, Rofsky NM, et al. MR imaging relaxation times of abdominal and pelvic tissues measured in vivo at 3.0 T: preliminary results. Radiology. 2004;230(3):652-659.
Figures