2886
Quantification of Left Ventricular Dyssynchrony and Action Time in Patients with Fabry Disease by Magnetic Resonance Tissue Phase Mapping1Department of Biomedical Engineering and Environmental Sciences, National Tsing Hua University, Hsinchu, Taiwan, 2Department of Radiology, Kaohsiung Veterans General Hospital, Kaohsiung, Taiwan, 3Medical Physics, University Hospital Freiburg, Freiburg, Germany, 4Department of Medical Imaging, National Taiwan University Hospital, Taipei, Taiwan
Synopsis
Recent studies showed that LV dyssynchrony and deceleration time can be recognized as an important predictor of poor outcome in patients. However, the regional myocardial function investigated by MRI is less discussed. In this study, we applied MR tissue phase mapping (TPM) and aim to investigate the myocardial dyssynchrony and action time in LV for Fabry disease (FD). We observed increased longitudinal dyssynchrony and lower systolic action time in FD group. In conclusion, the quantification of LV myocardial dyssynchrony and action time may provide useful information to comprehend the impaired cardiac manifestation and diastolic dysfunction in patients with FD.
Introduction
Fabry disease (FD) is an X-linked disorder of glycosphingolipid metabolism due to deficiency of α-galactosidase A activity, resulting in accumulation of glycosphingolipids. FD patients may exhibit left ventricular (LV) hypertrophy, myocardial fibrosis, and heart failure.1,2 Recent studies showed that LV dyssynchrony can be recognized as an important predictor of poor outcome in patients with heart failure.3,4 Other studies presented that FD patients have longer deceleration time in echocardiographic studies.5 However, the regional myocardial function investigated by MRI is less discussed. In this study, we applied MR tissue phase mapping (TPM) to investigate the myocardial dyssynchrony and action time in LV. We aim to observe the impaired myocardium of FD patients.Methods
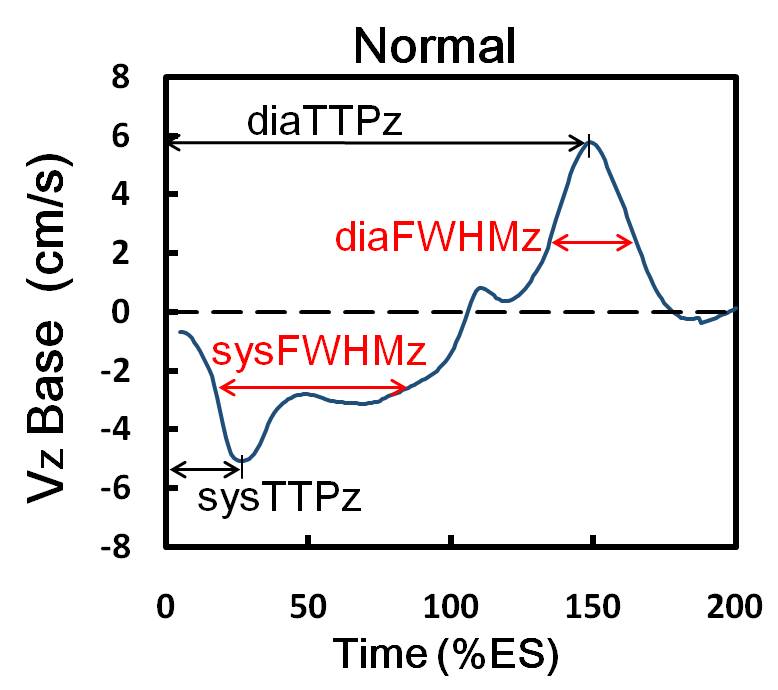
We recruited 14 FD patients (49.9 ± 12.4 years, 5 males) and 20 age-matched normal volunteers (48.4 ± 4.5 years, 10 males). Images were acquired on a 3.0 Tesla MR scanners (Tim Trio or Skyra, Siemens, Erlangen, Germany). Three-directional myocardial motion velocities in short-axis view at the level of base, mid, and apex was acquired with a black blood gradient echo sequence. Prospective ECG-triggering, sampling 90% of the R-R interval, and navigator-echo were used to synchronize with cardiac and respiratory motion, respectively. Acquisition parameters were as follows: TR/TE=26/4.2 ms, pixel size=1.17 x 1.17 mm2, slice thickness=6 mm, flip angle=7°, Venc in-plane=15 cm/s and through-plane=25 cm/s. We evaluated three-directional myocardial velocities in radial (Vr), circumferential (Vphi), and longitudinal (Vz) motion components. The myocardium of the three slices was divided into 16 segments according the the regulation of AHA. The standard deviations (SD) of systolic time-to-peak (TTP) and diastolic TTP in radial (TTPr) or longitudinal (TTPz) directions in 16 segments were assessed. An index of dyssynchrony index (DI) denoted the standard deviation of TTP. The global DI and intra-slice DI represented the SD of TTP among 16 segments and among segments of each slice, respectively. In Figure 1, we calculated the acceleration time (AT), as defined in echocardiography (5), by assessing the full width at half maximum (FWHM) of the time course of velocity. The LV global AT and intra-slice AT was evaluated in both of radial (ATr) and longitudinal (ATz) directions.Results
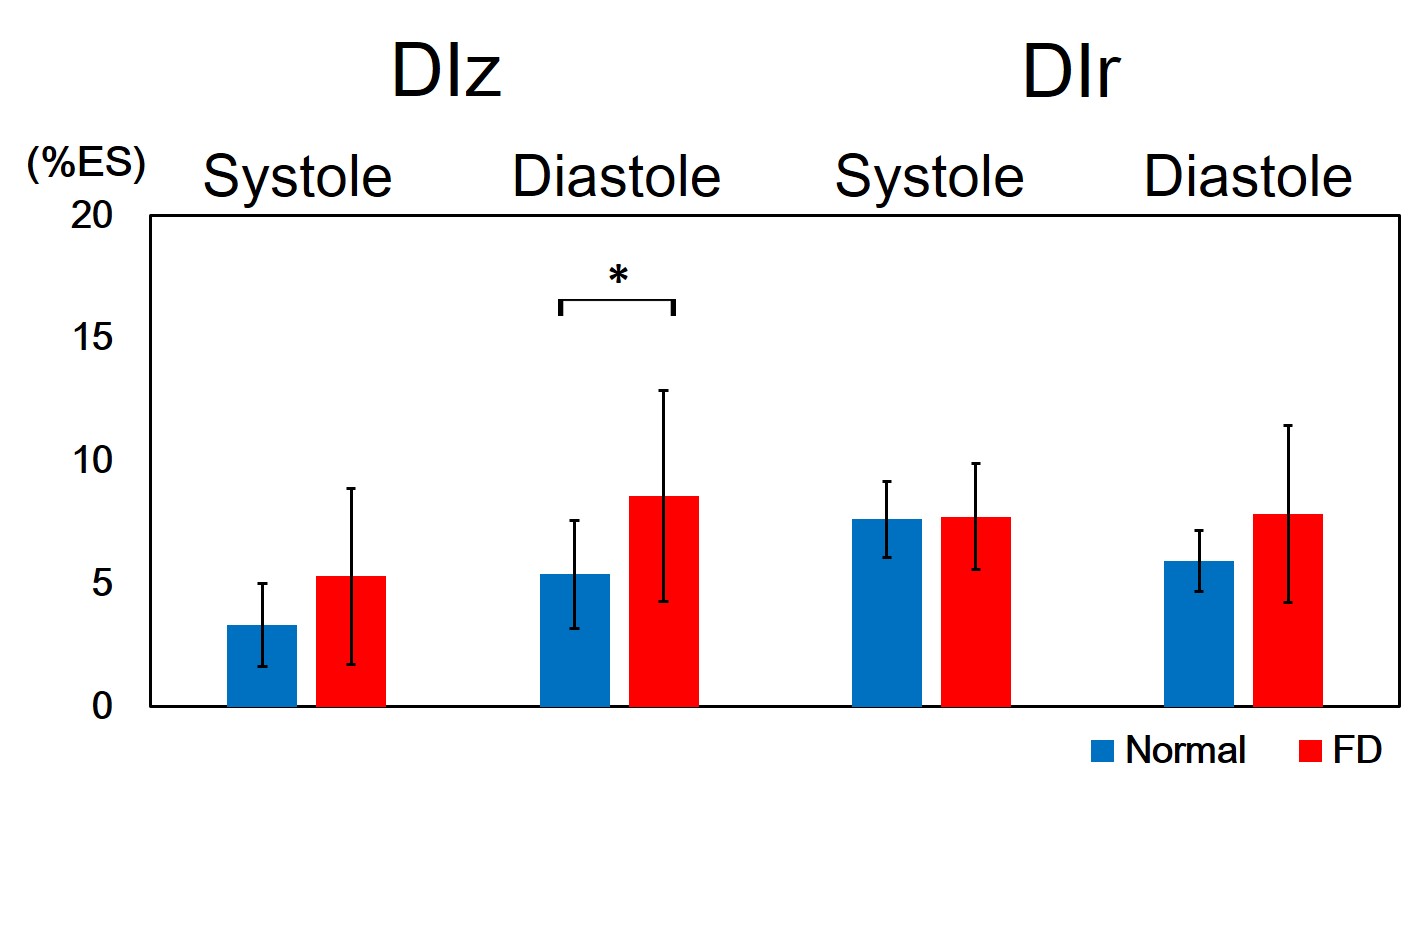
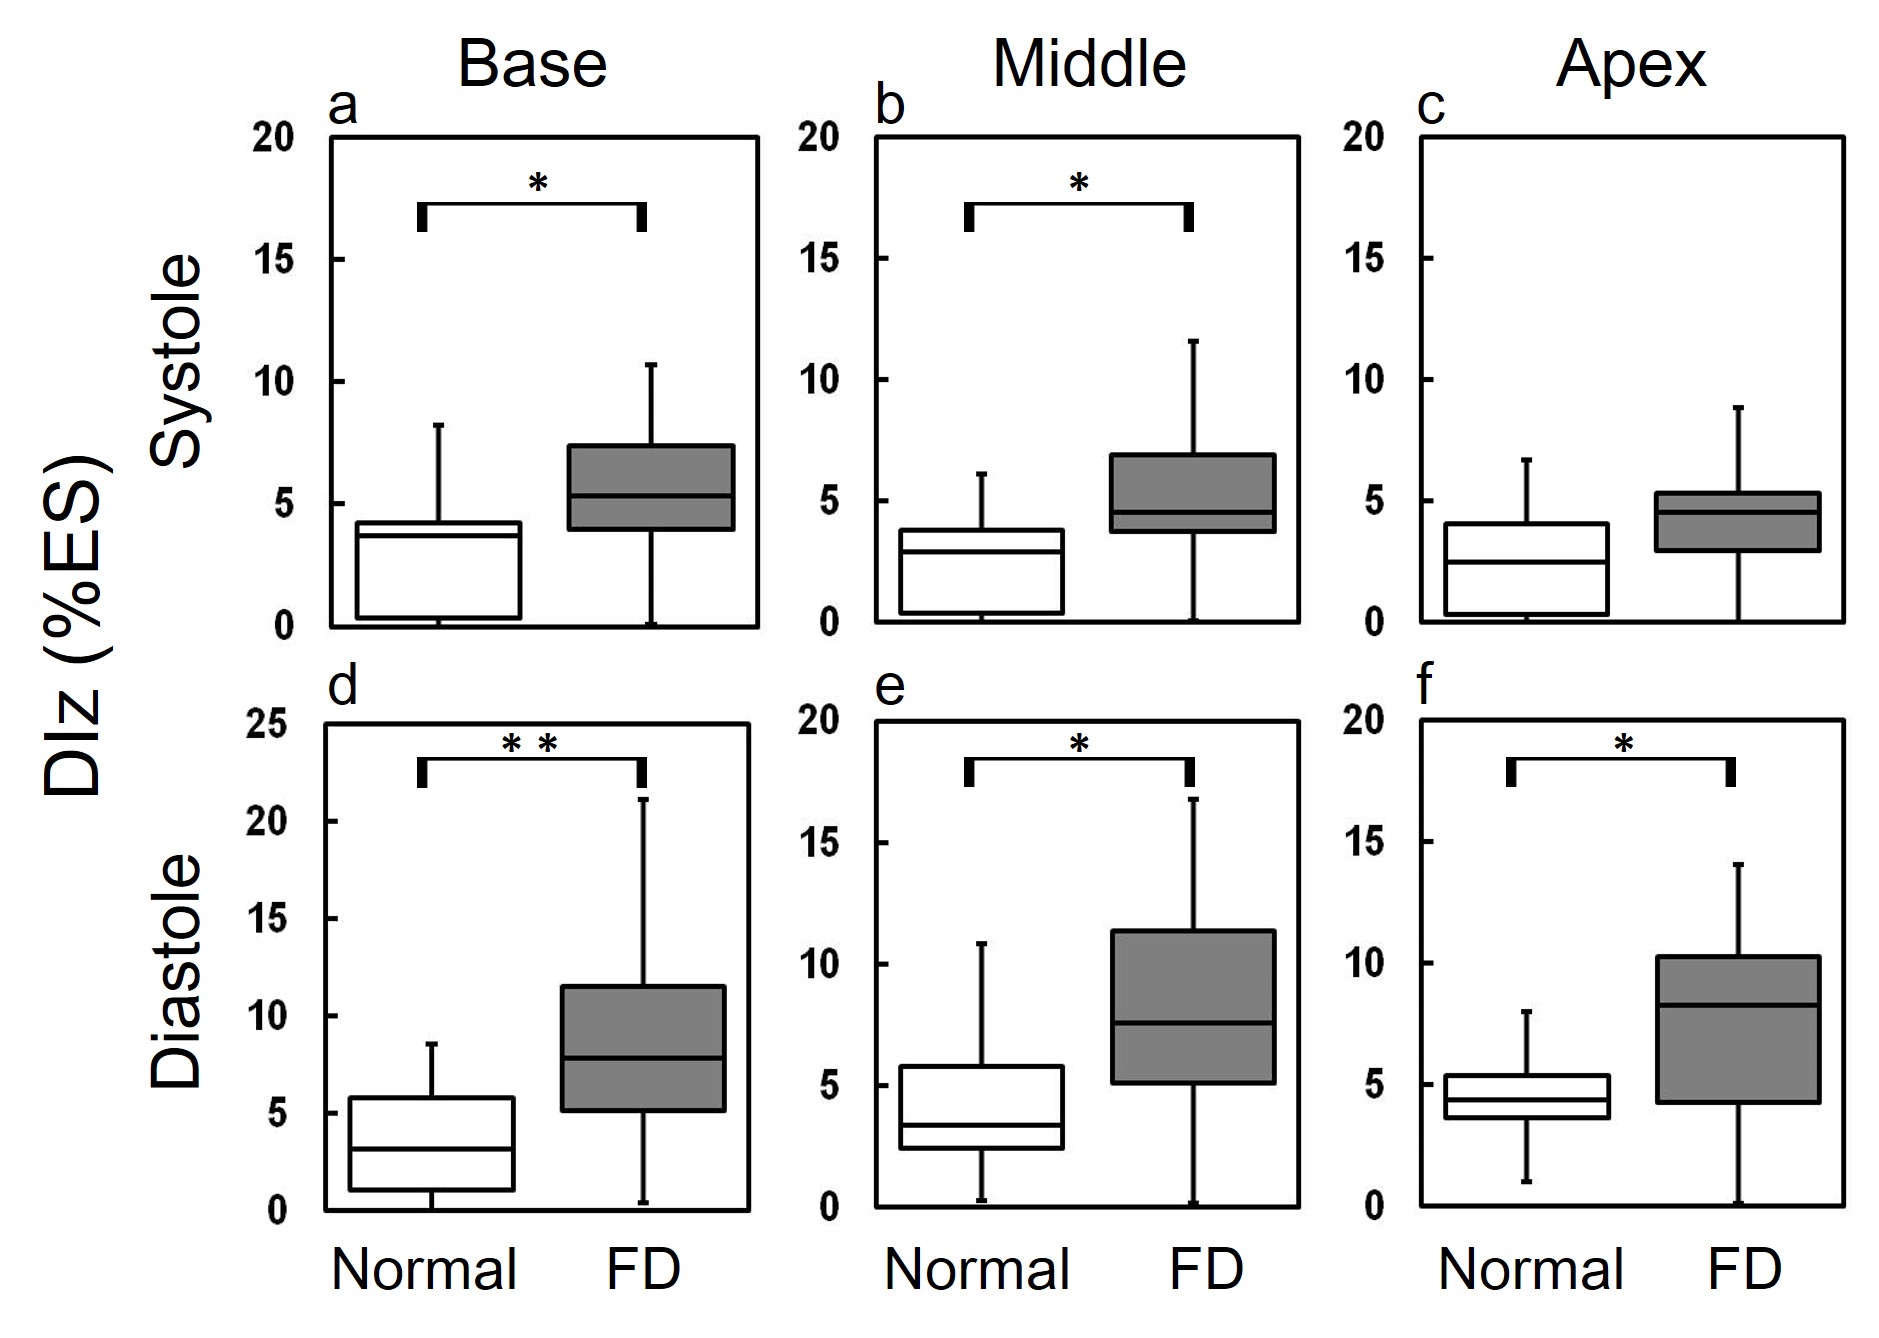
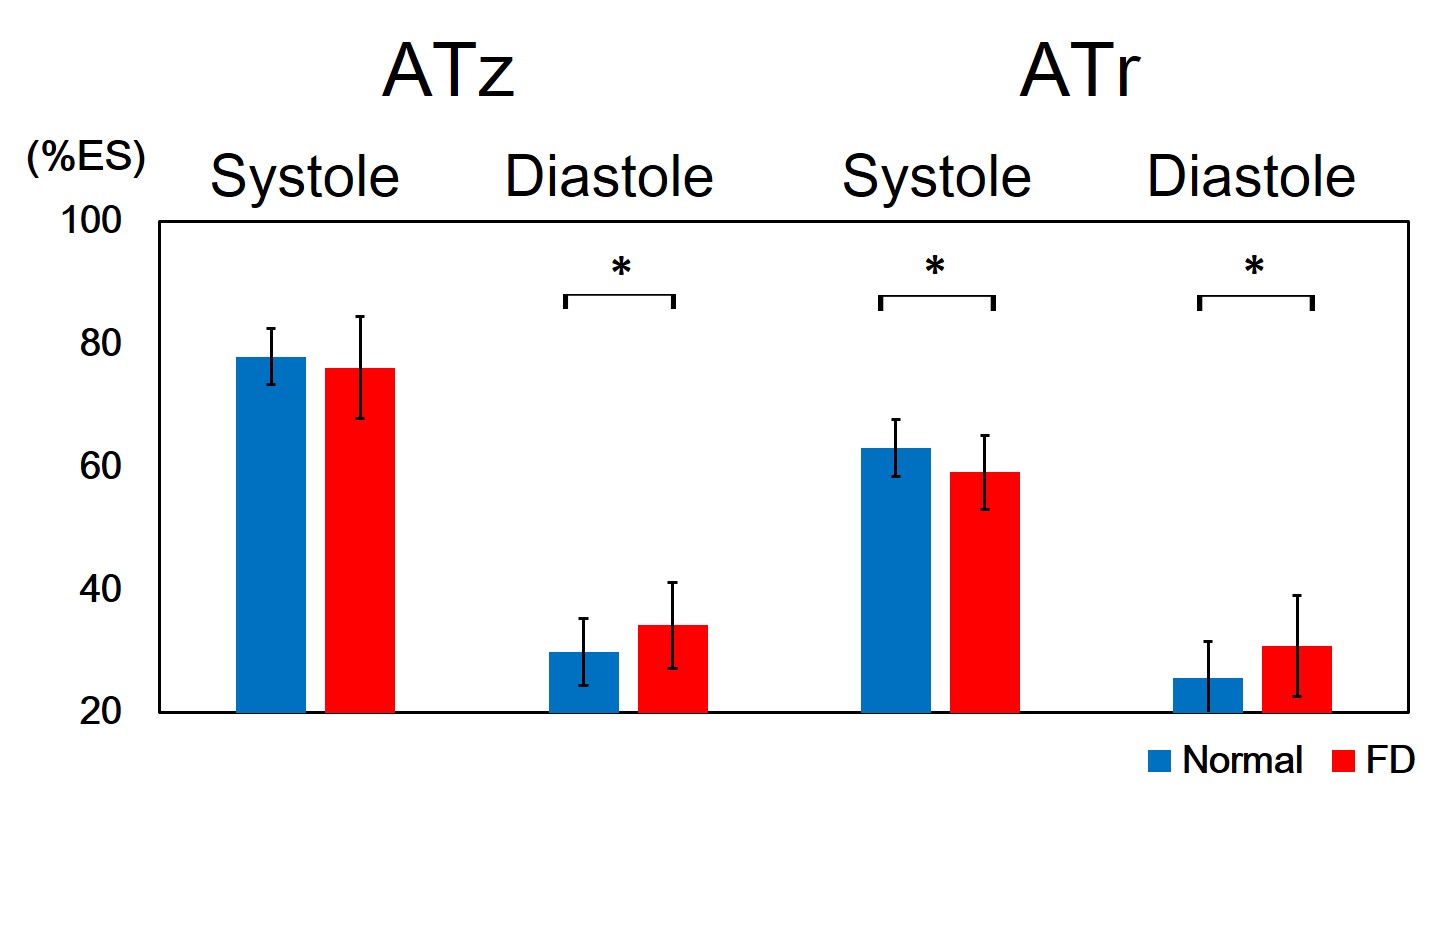
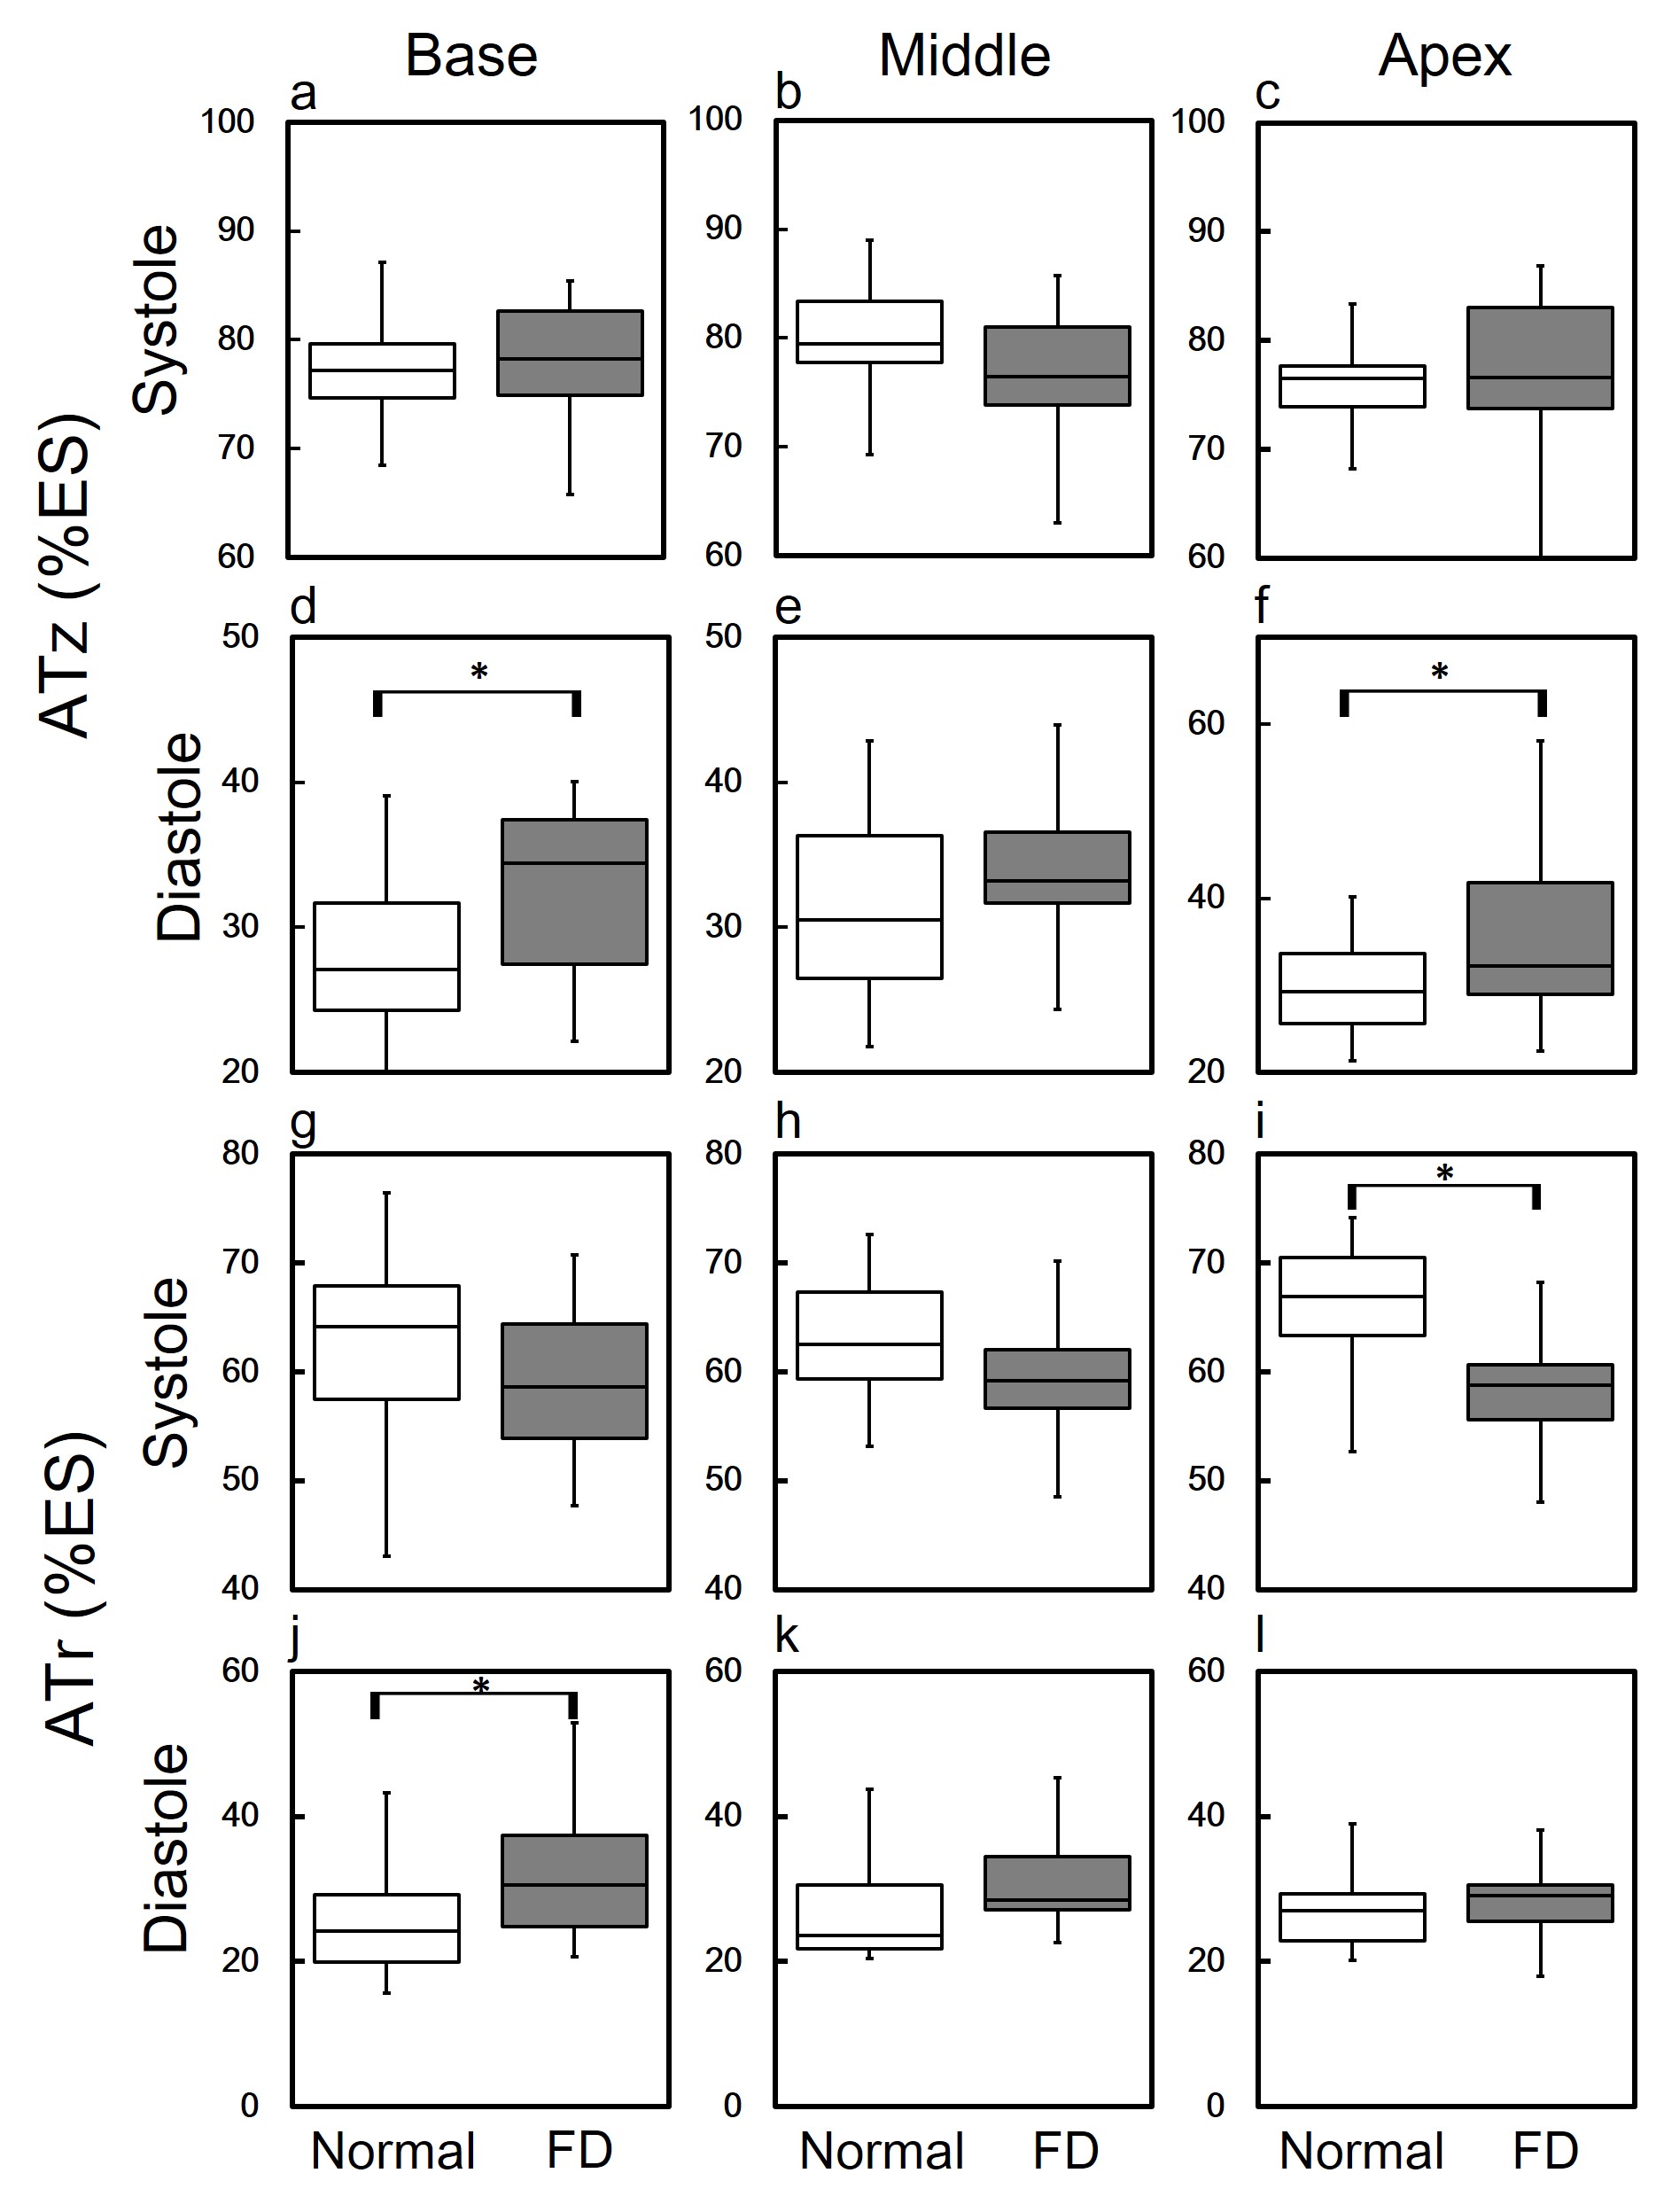
In Figure 2, compared to normal group, the global diastolic DIz in FD group increased significantly (8.8±6.1 %ES vs. 5.4±2.2 %ES, p<0.05) (Figure 2b). In respect of intra-slice DI, FD group exhibited significantly increased systolic DIz in basal and middle slices (Figures 3a and 3b). Patients also presented substantial increased diastolic DIz in the three slices (Figures 3(d-f)). Figure 4 illustrates that lower global systolic ATr in FD group (p<0.05). In diastole, both of global diastolic ATz and ATr in FD group were significantly higher than normal group (ATz: 34.2±7.1 %ES vs. 29.9±5.4 %ES, ATr: 30.8±8.3 %ES vs. 25.7±5.84 %ES, both p<0.05). Regarding to intra-slice AT, FD group presented significantly increased diastolic ATz in base and apex, decreased systolic ATr in apex, and increased diastolic ATr in base. (all with p<0.05) (Figure 5).Discussions and Conclusions
In this study, we performed TPM to acquire myocardial motion velocity and thereby to investigate global and intra-slice myocardial DI as well as AT in basal, middle, and apical slices. Previous studies proved that LV dyssynchrony is strongly associated with heart failure.3,4 The presence of LV dyssynchrony leads to inefficient LV contraction with a decreased cardiac output or relaxation with a decreased cardiac filling. The greater dyssynchrony denoted more severe myocardial dysfunction. In our work, the altered diastolic global and intra-slice DIz also exhibited impaired diastolic myocardial dysfunction in FD group. The presence of longer deceleration time denoted heart of impaired relaxation. Myocardial stiffness leads to diastolic dysfunction. Diastolic dysfunction leads to increased filling time. Maurizio et al employed echocardiography to explore that FD patients with diastolic dysfunction demonstrated longer deceleration time than the normal group.5 In the current work, prolonged diastolic AT in FD group may result from the increased filling time, reflecting the impaired diastolic function and the potential myocardial stiffness. In conclusion, the quantification of LV myocardial dyssynchrony and action time may provide useful information to comprehend the impaired cardiac manifestation and diastolic dysfunction in patients with Fabry disease.Acknowledgements
No acknowledgement found.References
1. Bleeker, G.B., et al., Left ventricular dyssynchrony in patients with heart failure: pathophysiology, diagnosis and treatment. Nat Clin Pract Cardiovasc Med, 2006. 3(4): p. 213-219.
2. Weidemann, F., et al., Long-Term Effects of Enzyme Replacement Therapy on Fabry Cardiomyopathy. Evidence for a Better Outcome With Early Treatment, 2009. 119(4): p. 524-529.
3. Foll, D., et al., Magnetic resonance tissue phase mapping: analysis of age-related and pathologically altered left ventricular radial and long-axis dyssynchrony. J Magn Reson Imaging, 2011. 34(3): p. 518-25. 4.
4. Takenaka, T., et al., Terminal stage cardiac findings in patients with cardiac Fabry disease: An electrocardiographic, echocardiographic, and autopsy study. Journal of Cardiology, 2008. 51(1): p. 50-59.
5. Pieroni, M., et al., Early detection of Fabry cardiomyopathy by tissue Doppler imaging. Circulation, 2003. 107(15): p. 1978-1984.
Figures