2883
Left Ventricle Circumferential Strain from Radially Tagged Images through CIRCOME combined by SinMod1Biomedical Engineering, Amirkabir University of Technology (Tehran Polytechnic), Tehran, Iran
Synopsis
Left ventricle function can be evaluated by measuring circumferential strain. CIRcumferential COMpression Encoding (CIRCOME), as a technique for quantification of circumferential strain, needs local frequency and displacement maps during deformation. This study aims to use sine wave modeling approach for estimation of local spatial frequency and displacement maps used in CIRCOME for radially tagged series of images. Circumferential strain computed from proposed method shows expected results in agreement with previous studies.
Introduction
Left ventricle (LV) circumferential strain is a key index of myocardial deformation in assessment of cardiac function. The development of radial tagging1 facilitates the measurement of LV rotation and circumferential strain. CIRcumferential COMpression Encoding, CIRCOME, is an innovative method in cardiac MRI for evaluation of this strain which requires local spatial frequency of each point before and after deformation.2 Furthermore, the Sine wave Modeling (SinMod) is a novel technique that simultaneously derives local spatial frequency and displacement field from tagged images. 3 In this study, the use of SinMod is proposed in combination with CIRCOME to reduce its computational cost.Materials and Methods
The previously developed CIRCOME uses the spatial frequency of each point that estimated by sequential band pass filtering of k-space data. This procedure is a time-consuming step of CIRCOME. Moreover, in order to compute local strain map, it needs a tracking process. In the SinMod, tagged image intensity in the vicinity of each pixel is modeled as a moving sine wave with local frequency, amplitude and phase. Based on this modeling local spatial frequency and displacement field for series of images can be estimated. This spatial frequency is used as the frequency required for CIRCOME, while the estimated displacement helps to find the corresponding points before and after deformation. Therefore, the two inputs for CIRCOME are obtained in one step.
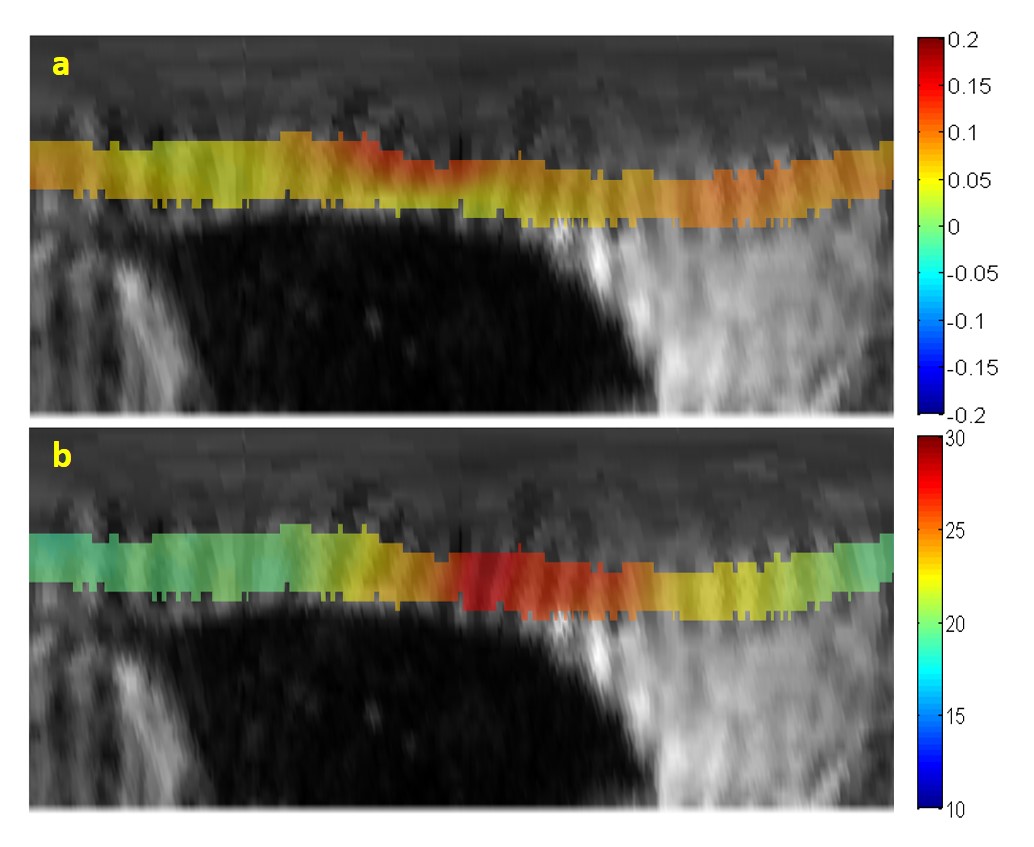
Short-axis breath-hold radial tagging images were acquired on Mid-ventricle for 8 healthy volunteers. Number of radial taglines was set to 11 taglines per half circle. The epicardium and endocardium contours were delineated manually and the myocardial region was converted to polar coordinate. Afterward, SinMod was implemented to obtain local spatial frequency and circumferential displacement field (Figure 1). The thickness change in consecutive myocardium masks was used to track the local radial displacement. The circumferential strain for each point was then computed by the relative changes of its spatial frequency during deformation. Finally, the resulting strain maps were transformed into the Cartesian coordinates for visualization.
Results and Discussion
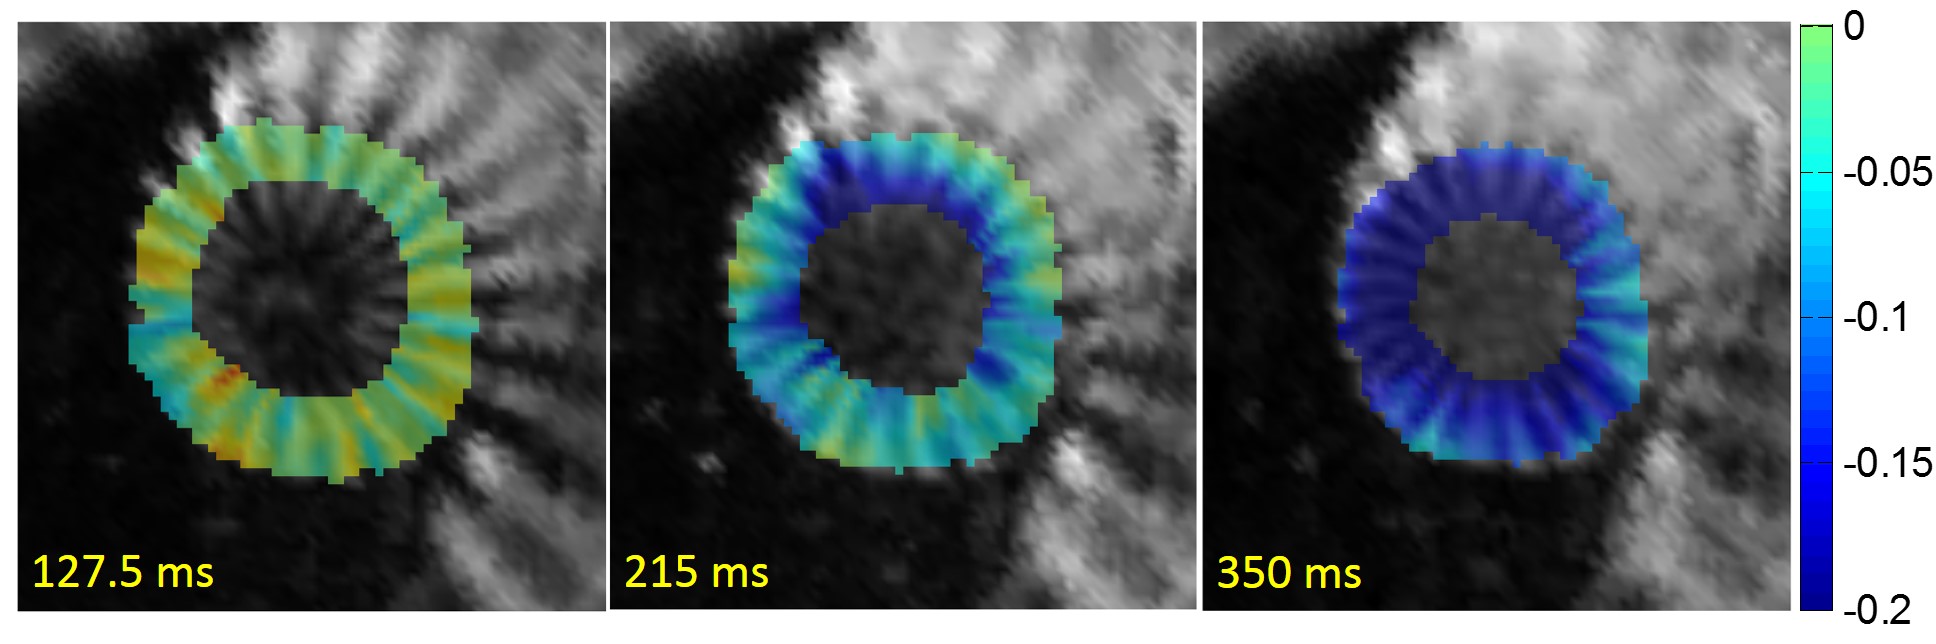
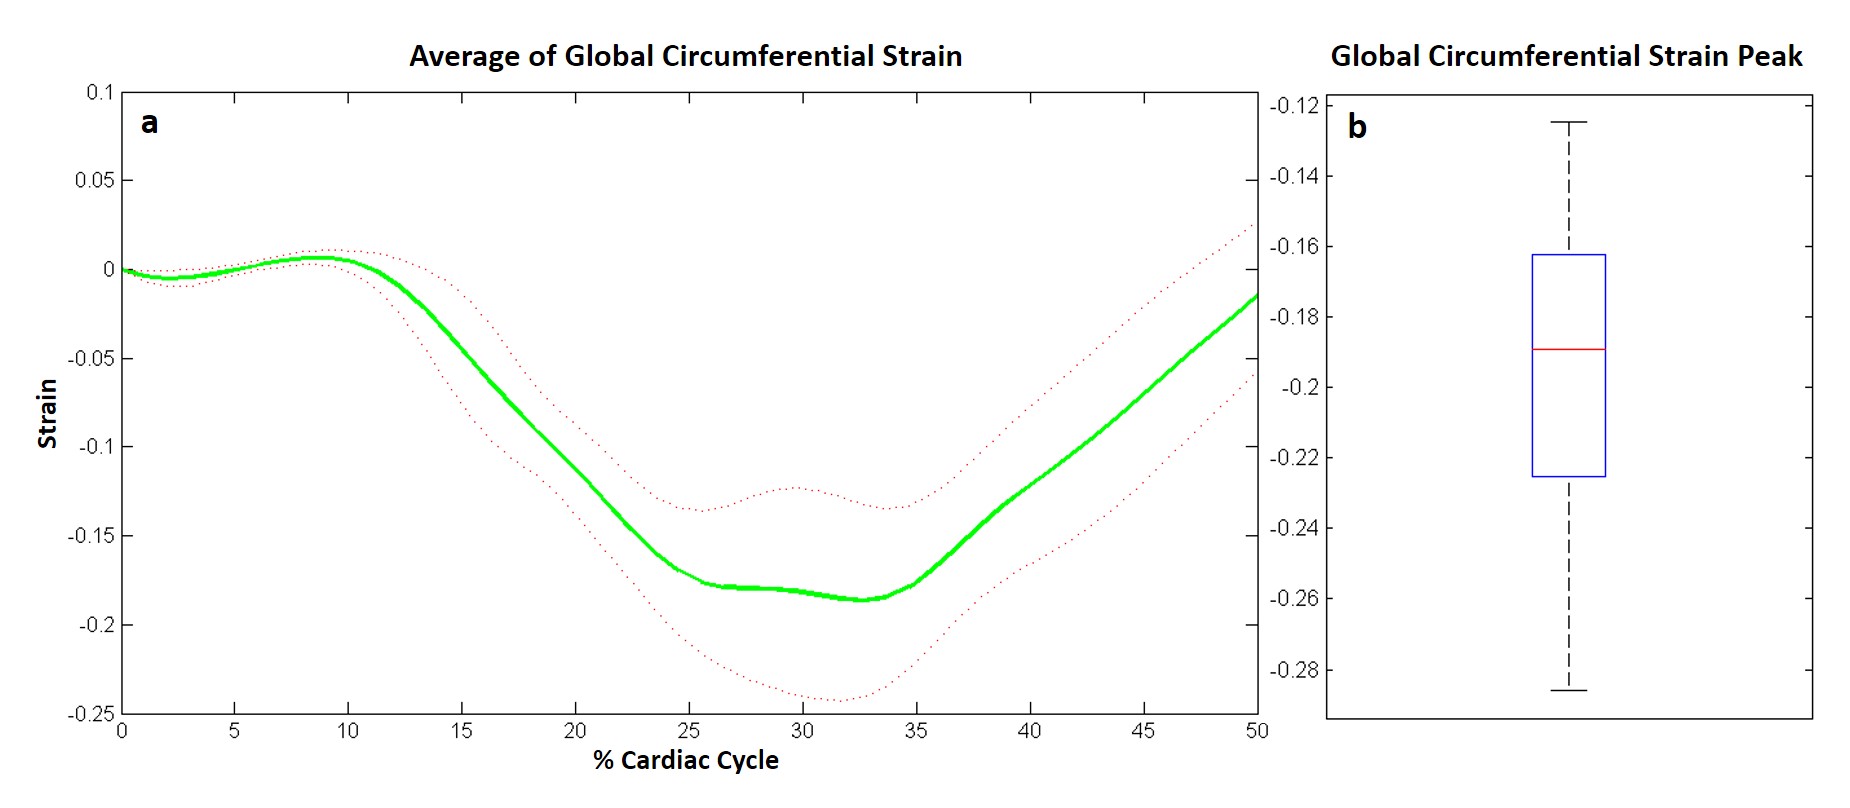
Figure 2; shows the color coded Lagrangian circumferential strain map superimposed on the radially tagged images of one volunteer for three different cardiac phases. The increased dark blue coloration in the images demonstrates the circumferential shortening during cardiac deformation. Figure 3(a); displays the plot of average global circumferential strain measured in 8 healthy subjects. Negative values of strain indicate circumferential shortening of the myocardial fibers during systole. As can be seen, the average circumferential strain peak occurs at %33 of cardiac cycle. Peak values of circumferential strain for healthy subjects are depicted in the box-plot of Figure 3 (b). This plot illustrates that the range of peak values is in the physiological range reported in previous studies.4,5Conclusion
In this study, a novel approach for LV circumferential strain quantification from radially tagged images is presented. This method is based on the basic idea of CIRCOME and utilizes SinMod to prepare local frequency and displacement maps for strain encoding. The patterns of estimated circumferential strains obtained with this method concur with previous studies. This approach has the potential to be widely used in practice due to its simplicity and performance. Furthermore, the combination of this method with a recently developed Polar Fourier Transform (PFT),6 for reconstruction of radially acquired radial tagged images can provide more acceleration in which the entire processes of strain imaging takes place in polar coordinate.Acknowledgements
Images were obtained at UCLA Diagnostic Cardiovascular Imaging (DCVI) section.References
1. Nasiraei-Moghaddam A, Finn JP. Tagging of cardiac magnetic resonance images in the polar coordinate system: Physical principles and practical implementation. Magnetic resonance in medicine. 2014 May 1;71(5):1750-9.
2. Moghaddam AN, Finn JP. Accelerated circumferential strain quantification of the left ventricle using CIRCOME: simulation and factor analysis. InMedical imaging 2008 Mar 6 (pp. 691604-691604). International Society for Optics and Photonics.
3. Arts T, Prinzen FW, Delhaas T, Milles JR, Rossi AC, Clarysse P. Mapping displacement and deformation of the heart with local sine-wave modeling. IEEE Transactions on Medical Imaging. 2010 May;29(5):1114-23.
4. Del-Canto I, López-Lereu MP, Monmeneu JV, Croisille P, Clarysse P, Chorro FJ, Bodí V, Moratal D. Characterization of normal regional myocardial function by MRI cardiac tagging. Journal of Magnetic Resonance Imaging. 2015 Jan 1;41(1):83-92.
5. Jeung MY, Germain P, Croisille P, ghannudi SE, Roy C, Gangi A. Myocardial tagging with MR imaging: overview of normal and pathologic findings. Radiographics. 2012 Aug 31;32(5):1381-98.
6. Golshani S, Nasiraei-Moghaddam A. Efficient radial tagging CMR exam: A coherent k-space reading and image reconstruction approach. Magnetic resonance in medicine. 2016 Mar 1.
Figures