2877
Respiratory variation in left ventricular cardiac function with 3D double-golden-angle whole-heart cine imaging1Karolinska Institutet and Karolinska University Hospital, Stockholm, Sweden
Synopsis
Respiratory variation in ventricular volume can potentially provide clinically important information in cardiac diseases involving left ventricular stiffness changes, and can be measured using respiratory resolved imaging. 3D double-golden-angle radial data were acquired during free breathing, and respiratory self-gating signals were extracted from k-space. All radial spokes were sorted into 8 respiratory phases and one end-diastolic cardiac phase and left ventricular end-diastolic volume (EDV) was segmented from a short-axis image stack. Respiratory induced changes in EDV were demonstrated and changed 9.0±2.3 % with respect to maximum expiratory EDV.
Introduction
Cardiac left ventricular (LV) function can be assessed with cardiovascular magnetic resonance (CMR) cine imaging acquired during breath-holding. However, some diseases affecting the stiffness of the ventricles or pericardium could potentially benefit from evaluation of the respiratory variations of cardiac dimensions1. In patients with stiffness changes, the variation of ventricular filling during the respiratory cycle changes. Assessment of ventricular volumes and septal motion during respiration can potentially be of value in differentiating constrictive from restrictive physiology2. The purpose of this study was to develop a 3-dimensional (3D) free breathing CMR technique for LV volume assessments with flexible retrospective data-binning for resolving the LV end-diastolic volume (EDV) during the entire respiratory cycle and evaluating it in healthy volunteers.Methods
Acquisition
A balanced steady-state free precession sequence using 3D double-golden-angle radial acquisition order3 was implemented at 1.5T (Siemens, Aera) for acquisition of an image volume covering the whole heart in healthy volunteers (n=6). The sequence was used for continuous data acquisition during free breathing and over several cardiac and respiratory cycles. Scan parameters were: FOV 352 mm, isotropic voxels 2x2x2 mm, TE/TR 1.3/2.7 ms, flip angle 65°, 900,000 radial spokes. ECG and respiratory motion from bellows were recorded simultaneously by the scanner.
Respiratory Self-gating
Respiratory self-gating (SG) signals were extracted retrospectively from the k-space center point of each radial spoke and each receiver coil element. One k-space center point in all coil elements in the middle of the scan was used as a reference vector, r, representing the respiratory motion state at this particular time instance. A one-dimensional signal, z(t), was calculated from the scalar product of r with all other k-space coil vectors, v(t) with z(t) = v(t) · r.
z(t) was band-pass filtered with a quadrature filter only keeping the positive frequencies with width 0.5 Hz and center frequency manually adjusted to the respiratory peak in the frequency spectrum. The angle of this signal corresponded to the instantaneous phase of the signal and provided a 2π phase wrapping in the same motion phase of all respiratory cycles that was used to distinguish between individual respiratory cycles.
Image reconstruction
The respiratory SG signal and recorded ECG were used to bin each radial spoke into 8 respiratory phases covering the whole cycle and one end-diastolic cardiac phase out of a total of 8 cardiac phases. Image reconstruction of each bin was done with a standard gridding and following Fourier transform. From each image volume, multi-planar reformatting was used to extract a short axis stack and a 4-chamber stack. 4 image slices in each of the two directions were summed to achieve a resolution of 2x2x8 mm. The LV endocardial border was manually segmented from each short axis stack to obtain one LV EDV for each respiratory bin. Data are given as mean±SD.
Results
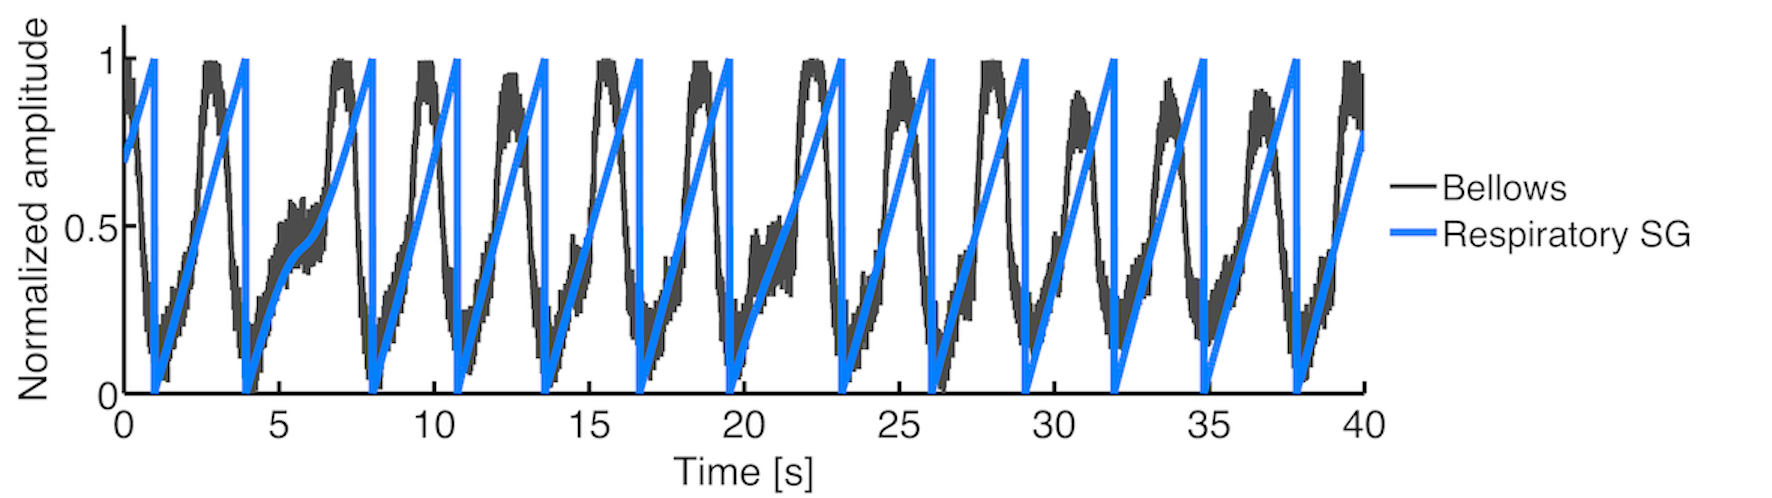
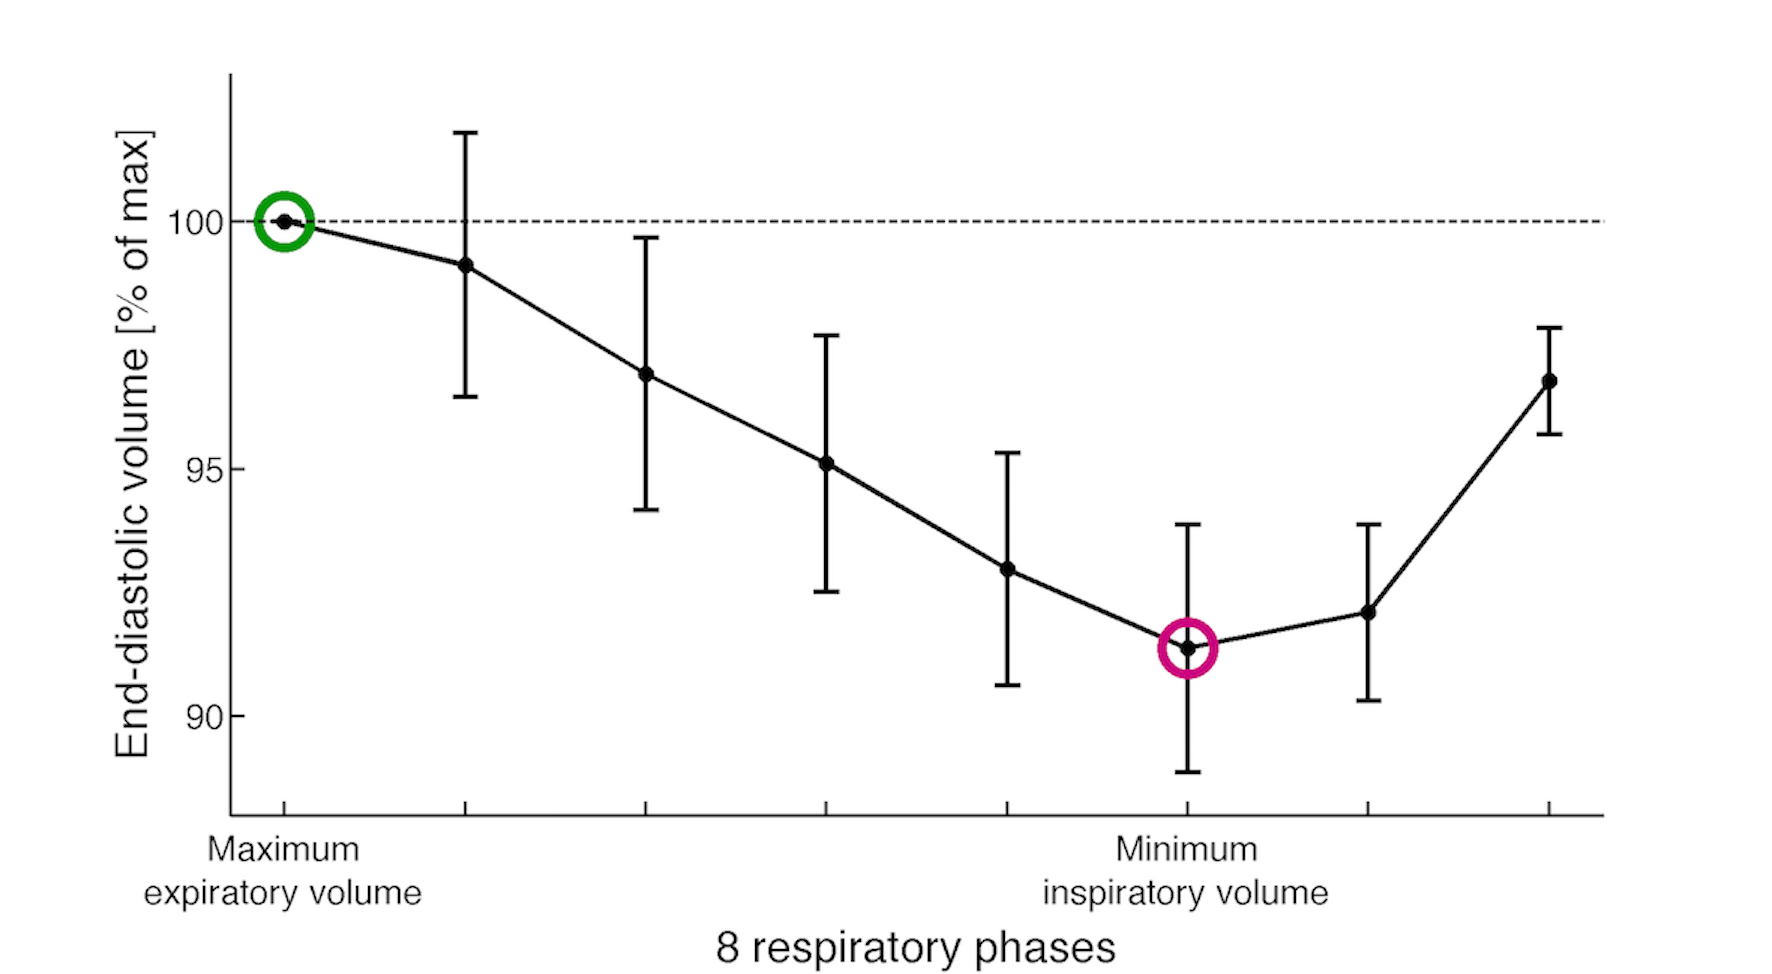
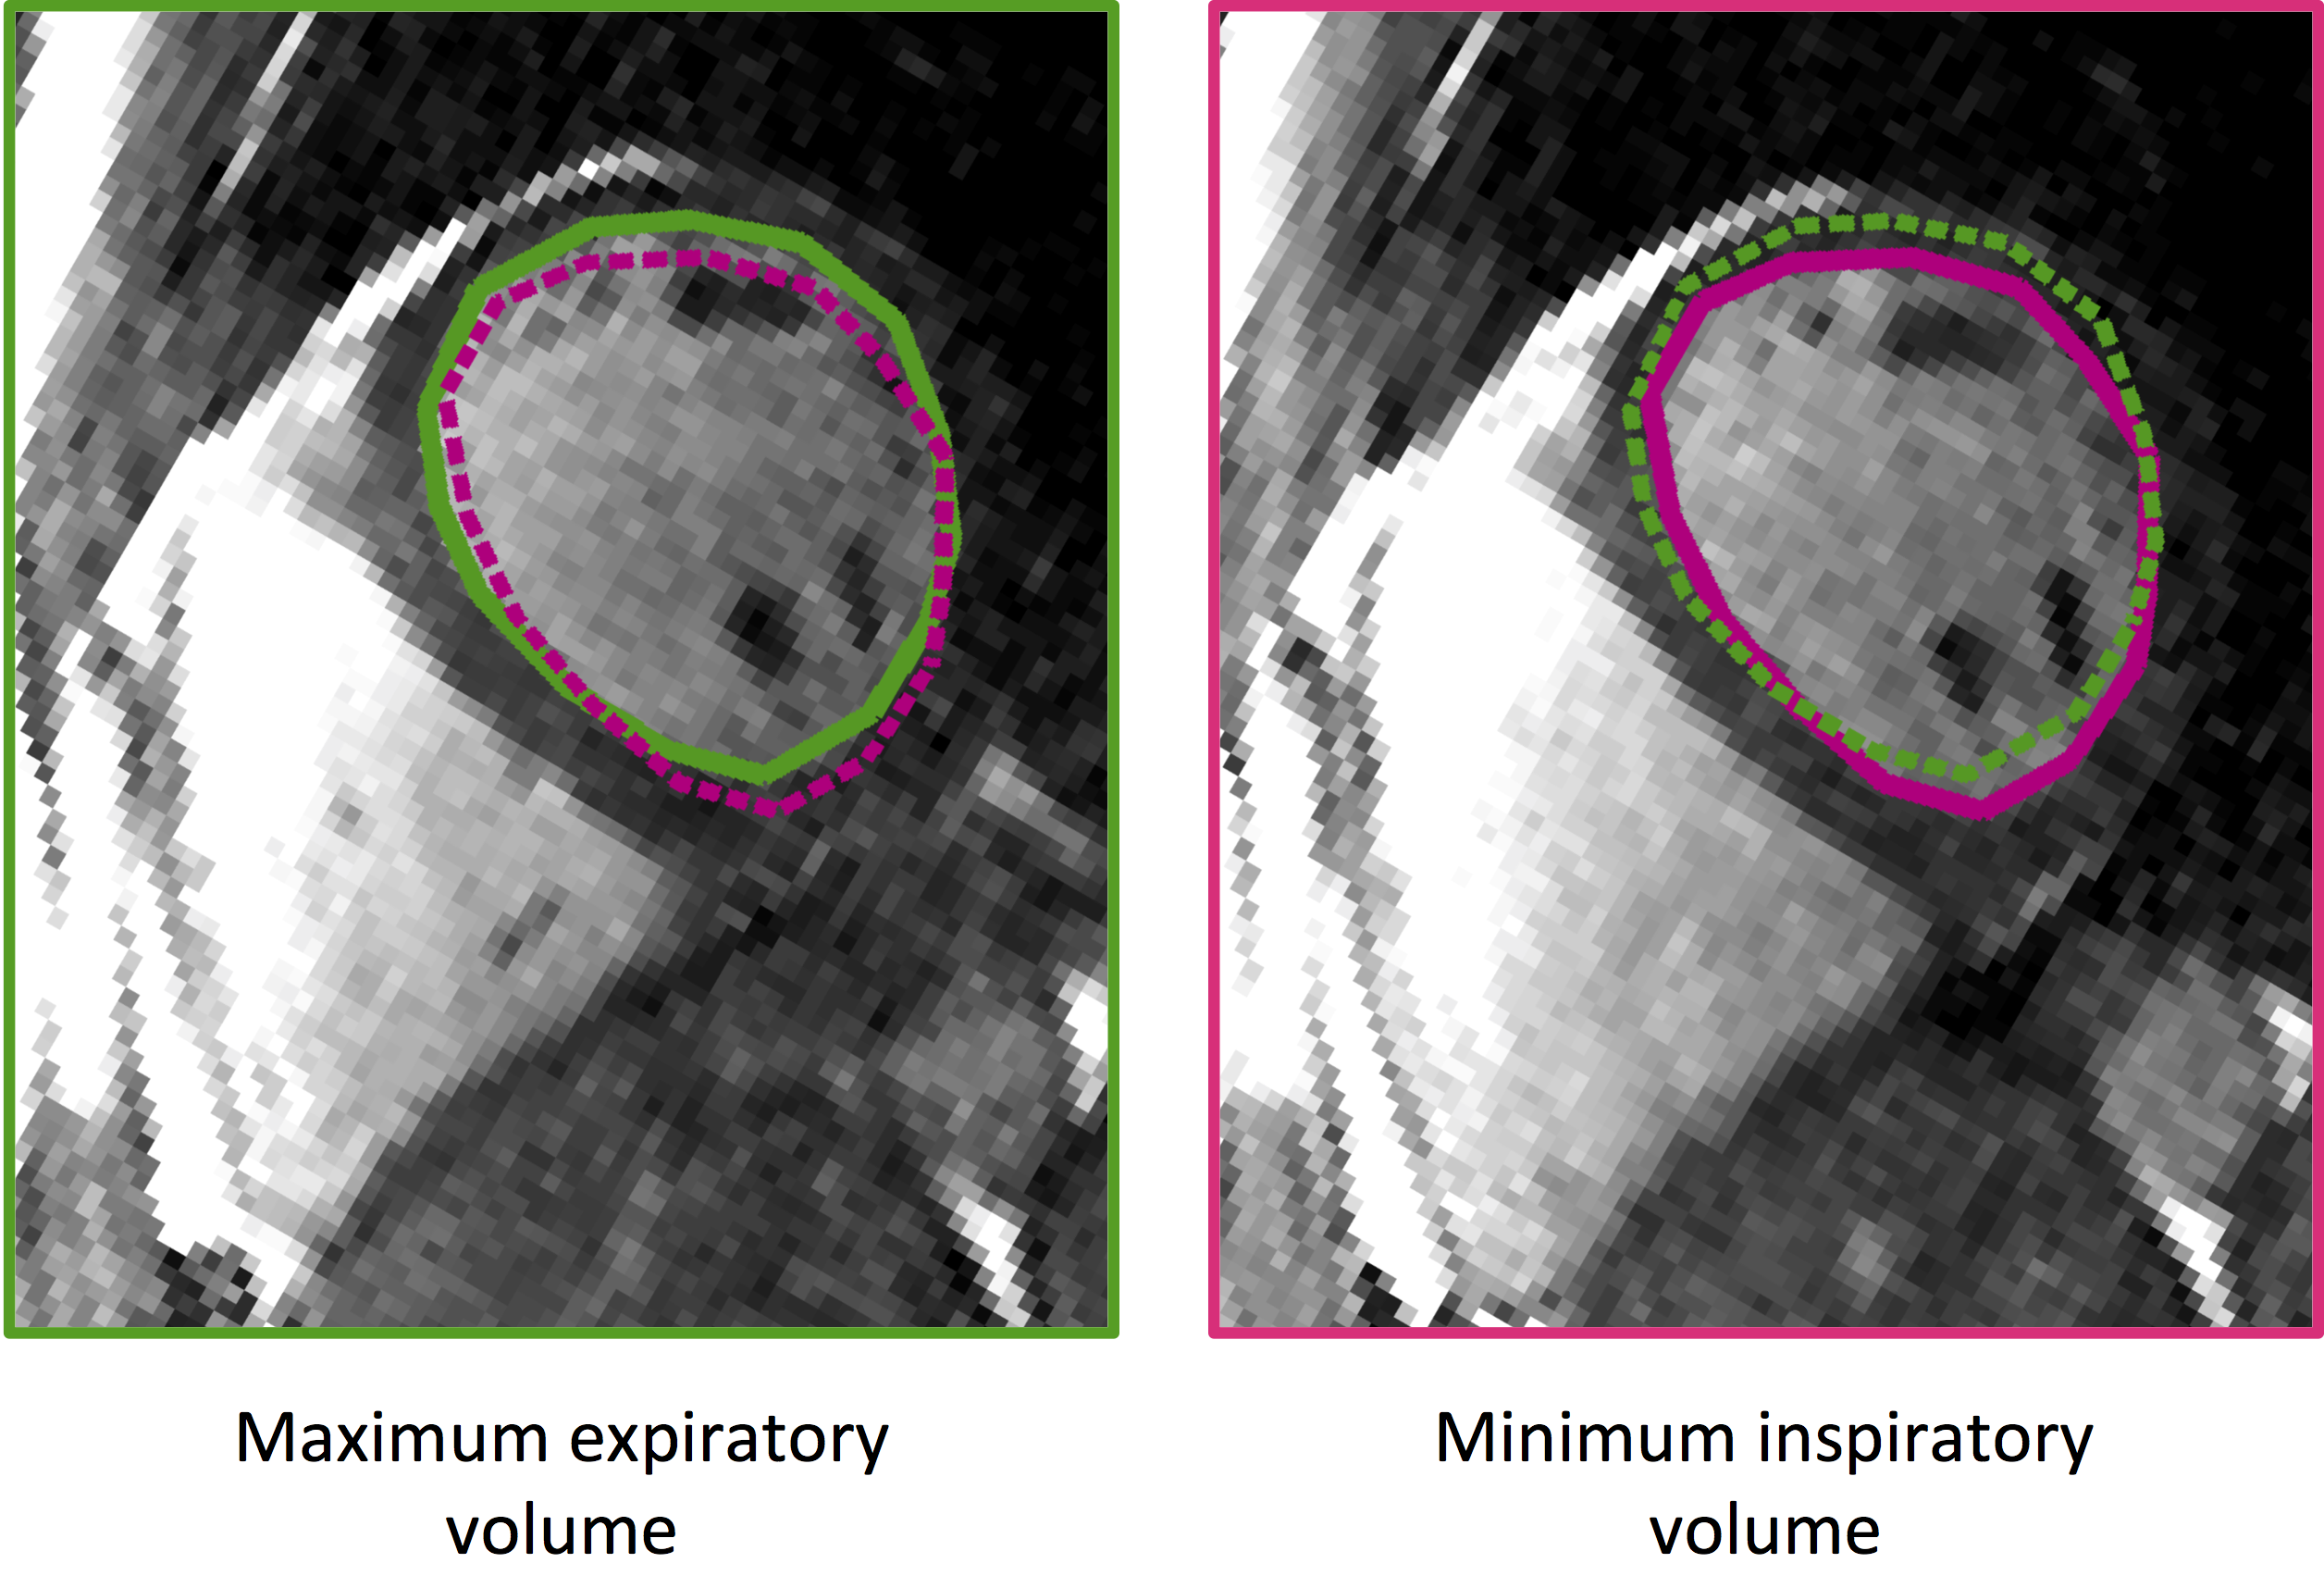
Figure 1 shows a respiratory SG angle signal (blue) and measured bellows signal (grey) from a representative subject. The amount of radial spokes binned into each of the 8 respiratory phases was 14069±1526 spokes. The Nyquist limit for a fully sampled k-space with given scan parameters was 48657 spokes. Thus, 29 % of the spokes for a fully sampled k-space were acquired per bin. Figure 2 shows LV EDV from all subjects normalized to 100 % of maximum expiratory EDV for each individual volunteer. The vertical bars indicate the standard deviation of the volunteers. Mean EDV during respiration was 150±48 ml for all volunteers. With respect to maximum expiratory volume the EDV variation was 9.0±2.3 % during respiration. Representative images from peak expiration and peak inspiration are shown in Figure 3.Discussion
Continuous 3D double-golden-angle radial acquisition with retrospective respiratory self-gating is able to non-invasively resolve and measure the LV EDV throughout the respiratory cycle in healthy volunteers. The EDV variation during respiration of 9 % corresponds to what has previously been reported in the literature4,5. Some streaking was present in the images due to undersampling, but image quality was still sufficient for LV segmentation. Future work is planned to include reducing scan time using parallel imaging and/or compressed sensing.Conclusion
Free breathing retrospectively respiratory self-gated cine imaging was able to show the respiratory induced variation in LV EDV and provides a new potential diagnostic tool for cardiac diseases involving stiffness changes of myocardium or pericardium.Acknowledgements
No acknowledgement found.References
1. Weber KT, Janicki JS, Shroff S, Fishman AP. Contractile mechanics and interaction of the right and left ventricles. Am J Cardiol; 1981;47(3):686–95.
2. Kusunose KT, Dahiya A, Popovic ZB, et al. Biventricular Mechanics in constrictive pericarditis comparison with restrictive cardiomyopathy and impact of pericardiectomy. Circ Cardiovasc Imaging. 2013;6:399-406.
3. Chan RW, Ramsay EA, Cunningham CH, Plewes DP. Temporal stability of adaptive 3D radial MRI using multidimensional golden means. Magn Reson Med 2009;61:354-63.
4. Brenner JI, Waugh RA. Effect of phasic respiration on left ventricular dimension and performance in a normal population. An echocardiographic study. Circulation 1978;57:122-7.
5. Sigfridsson A, Kvitting JP, Knutsson H, Wigstrom L. Five-dimensional MRI incorporating simultaneous resolution of cardiac and respiratory phases for volumetric imaging. J Magn Reson Imaging 2007;25:113-21.
Figures