2873
Cardiovascular Magnetic Resonance Imaging Evaluation of Right Ventricular Efficiency in Health and Disease: State of the Art1Radiology, University of Wisconsin - Madison, Madison, WI, United States, 2University of Wisconsin - Madison, WI, United States
Synopsis
Assessing RV function is complex, particularly in patients with RV dysfunction. Traditional indices, such as RV volumes and ejection fraction, incompletely describe the alterations that occur with changes in RV volume or afterload. New CMR methods of assessing RV efficiency based on strain and energetics have the potential to detect dysfunction earlier than currently used approaches.
Purpose:
The purpose of this educational exhibit is to review the current state-of-the-art methods for assessing right ventricular mechanics and efficiency, highlighting the increasing role for cardiovascular magnetic resonance (CMR).Outline of Content:
Adaptations of the right ventricle (RV) to congenital and acquired heart diseases are complex and incompletely understood. CMR imaging is increasingly used and is now considered the non-invasive reference standard for the assessment of cardiac anatomy and function. In an effort to identify reliable metrics that can predict outcomes earlier, investigators have explored hemodynamic parameters other than volume and ejection fraction to characterize the ability of the RV to perform the work necessary to pump blood through the pulmonary circulation.
Basic indices of RV function and efficiency: This exhibit will begin with a review of standard assessments of RV function and morphology for which CMR is the clinical reference standard. In patients with congenital heart disease (CHD) and pulmonary hypertension (PH), CMR is now routinely used to measure RV volumes and ejection fraction.
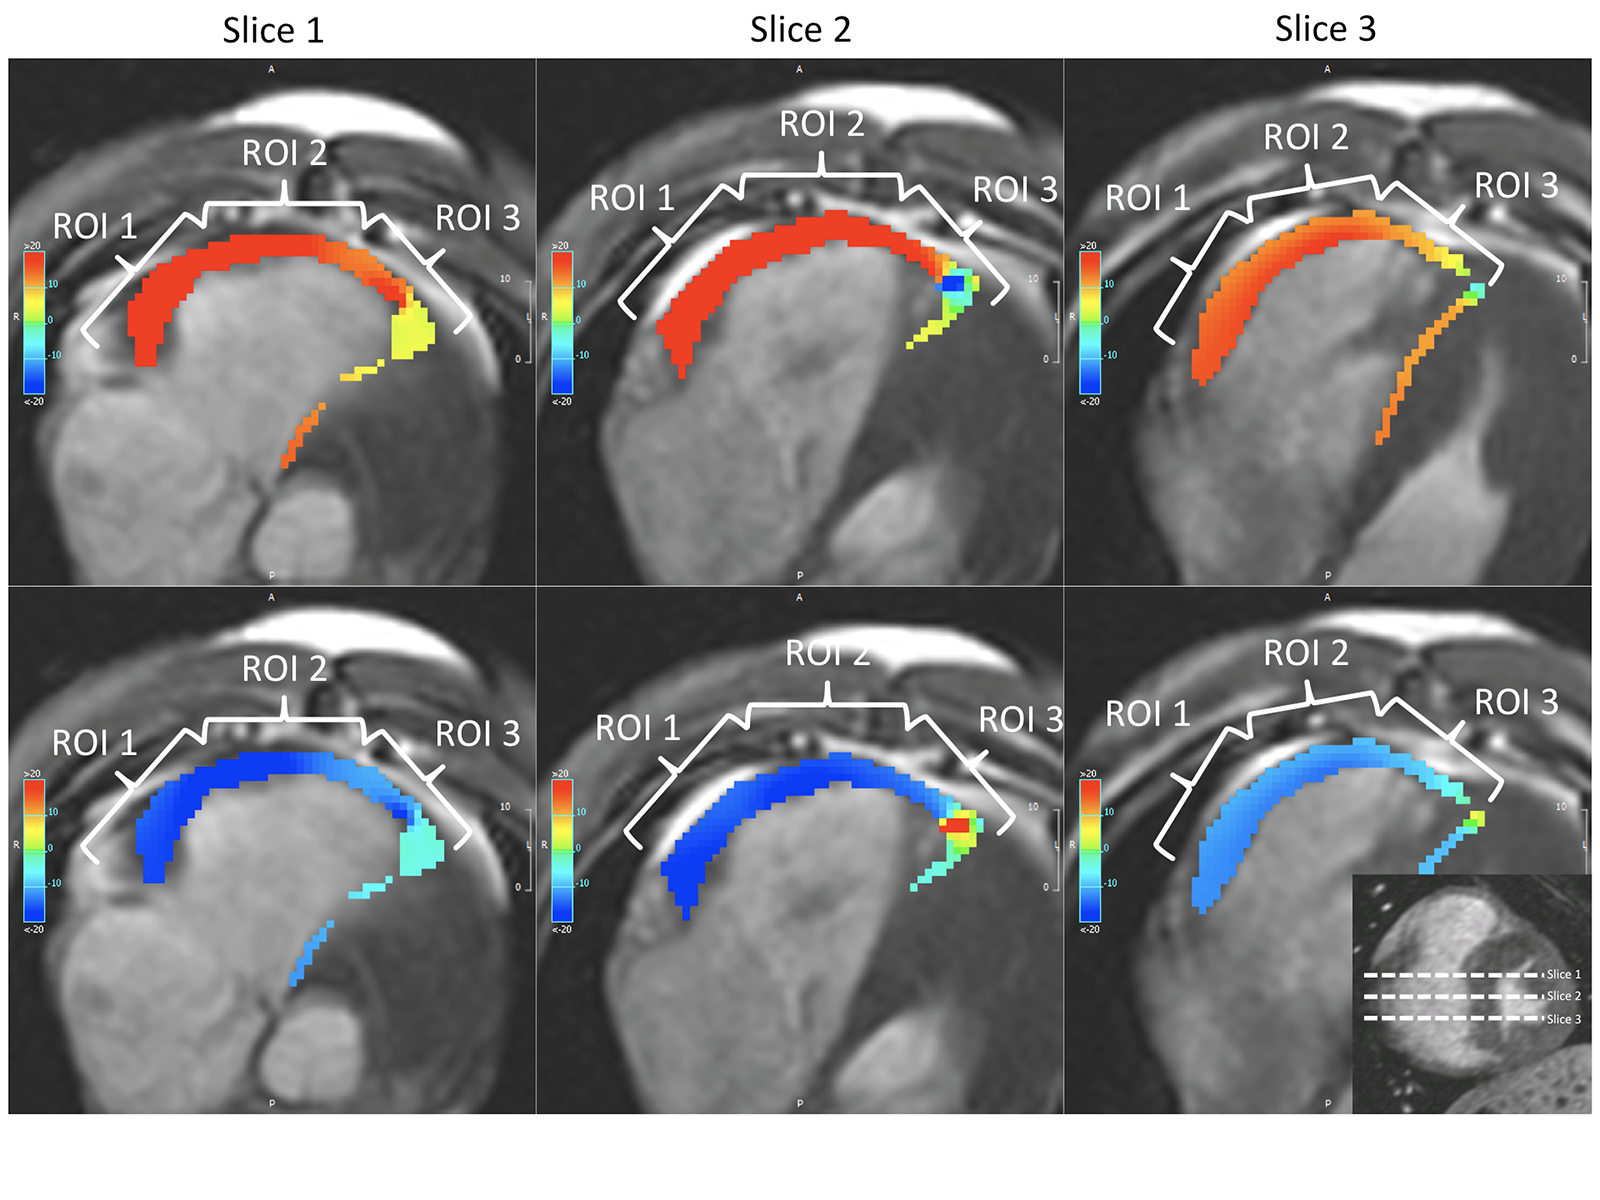
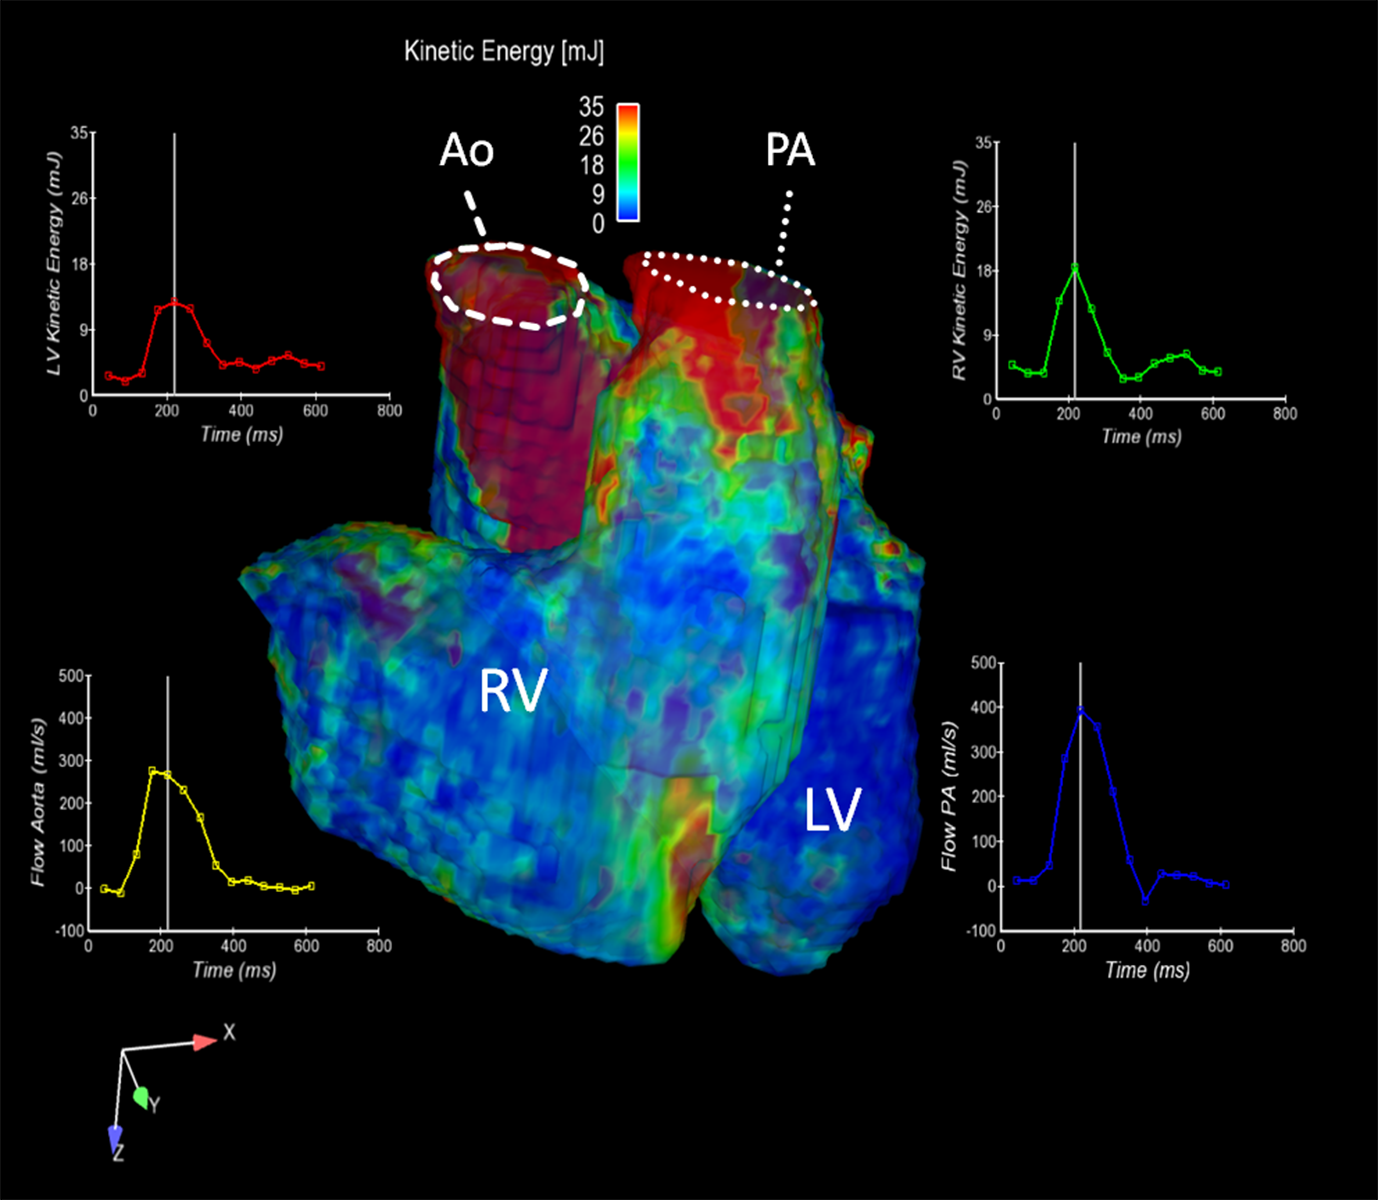
Novel indices of RV function and efficiency: Newer CMR methods for assessing RV efficiency based on RV strain and energetics will be presented. RV strain and strain rate can be quantified using CMR myocardial tagging, displacement encoding,1 strain encoding,2 tissue phase mapping, and tissue tracking (Figure 1).3 The emerging role for 4D flow MRI techniques to quantify RV kinetic energy (Figure 2)4,5 will be highlighted.
Other methods of assessing RV efficiency: At a cellular and metabolic level, RV efficiency is best characterized by the relationship between the amount of oxygen and glucose consumption by the myocardium to perform a given level of work. Methods of quantifying myocardial oxygen and glucose consumption with newer molecular imaging techniques,6,7 and how these could be combined with CMR methods, will be reviewed
Summary:
Assessing RV function is complex, particularly in patients with RV dysfunction. Traditional indices, such as RV volumes and ejection fraction, incompletely describe the alterations that occur with changes in RV volume or afterload. New CMR methods of assessing RV efficiency based on strain and energetics have the potential to detect dysfunction earlier than currently used approaches.Acknowledgements
No acknowledgement found.References
1. DA Auger, et al. JCMR 2012, 14:4.
2. A Youssef, et al. JCMR 2008, 18:33.
3. ME Menezes de Siqueira, et al. JCMR 2016, 18:39.
4. M Carlsson, et al. Am J Physiol Heart Circ Physiol 2012, 302:H893.
5. D Jeong, et al. J Thorac Cardiovasc Surg 2015;149:1339.
6. K Yoshinaga, et al. Eur J Nucl Med Mol Imaging 2014;41:1240.
7. YY Wong, et al. Circ Heart Fail 2011;4:700.
Figures