2872
Inter-center reproducibility of left ventricular circumferential strain analysis with spatial modulation of magnetization imaging analysis in healthy and repaired Tetralogy of Fallot patients1National Heart Centre Singapore, Singapore, Singapore, 2The University of Auckland, New Zealand, 3Duke-NUS Medical School Singapore, Singapore, Singapore
Synopsis
The aim of this study was to examine inter-center reproducibility of tagging magnetic resonance imaging (MRI) analysis in human patients undergoing either 1.5T or 3.0T MR examinations. A total of 20 subjects, 10 heathy subjects and 10 patients with repaired tetralogy of Fallot (rTOF), aged between 18 and 69 years, underwent either 1.5T or 3.0T MR scans. Circumferential strain (CS) from base, mid, and apex regions were analysed using CIM v8.4 at two centres (NHCS Singapore and University of Auckland). Reproducibility was moderate at the base (ICC 0.765), and excellent at the mid (0.979) and apex (0.982) regions. Overall reproducibility was excellent in both healthy controls and rTOF patients (ICC: 0.956 and 0.932), and at both 1.5T and 3.0T (0.972 and 0.940).
Background and Purpose
Myocardial strain from cardiac magnetic resonance (CMR) is used to detect early onset of myocardial disease. Tagging CMR is considered as the “gold” standard technique for assessing myocardial strain. CIM, an automated analysis software, has been used in human studies previously1,2. However, the inter-center analysis reproducibility of results in different MR scanners (i.e. 1.5T versus 3.0T) in patients with rTOF has not yet been examined.Methods
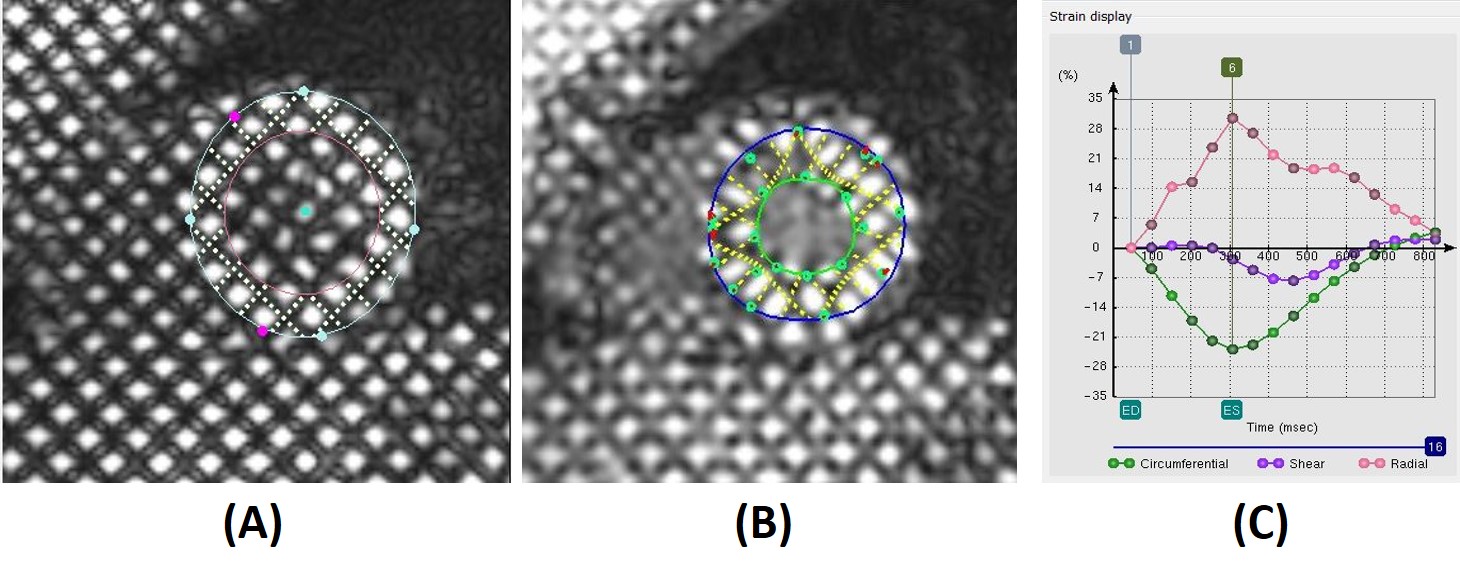
In this two-centre analysis reproducibility study, 20 subjects (10 controls and 10 rTOF patients) were prospectively recruited. All subjects underwent cardiac tagging CMR scans, of which 9 subjects (4 controls, 5 patients) were at 1.5T (Siemens Avanto), and 11 subjects (6 controls, 5 patients) were 3.0T (Philips Ingenia). Semi-automated analysis of the tagged short axis (basal, mid and apex) slices were performed using CIM software at both NHCS Singapore and University of Auckland. A grid was automatically aligned to the myocardial tagging planes at end diastole, and the left ventricle (LV) centroid and two right ventricle (RV) insertion points where the RV free wall joined LV were defined1. Guide points were added to define the endocardial and epicardial contours at end-diastole (Fig. 1 (A)), and the end systole phase was determined visually before tracking. Tags were adjusted after automatic tracking to ensure that yellow model tag lines maintained alignment with image tags (Fig. 1 (B)). LV myocardial CS was calculated by the software from the motion of the tracked model (see Fig. 1 (C)). Reliability was tested by the intraclass correlation coefficient (ICC). Bland-Altman analysis and Passing-Bablok regression3 was used to describe the agreement and measurement errors between the two measurements.Results
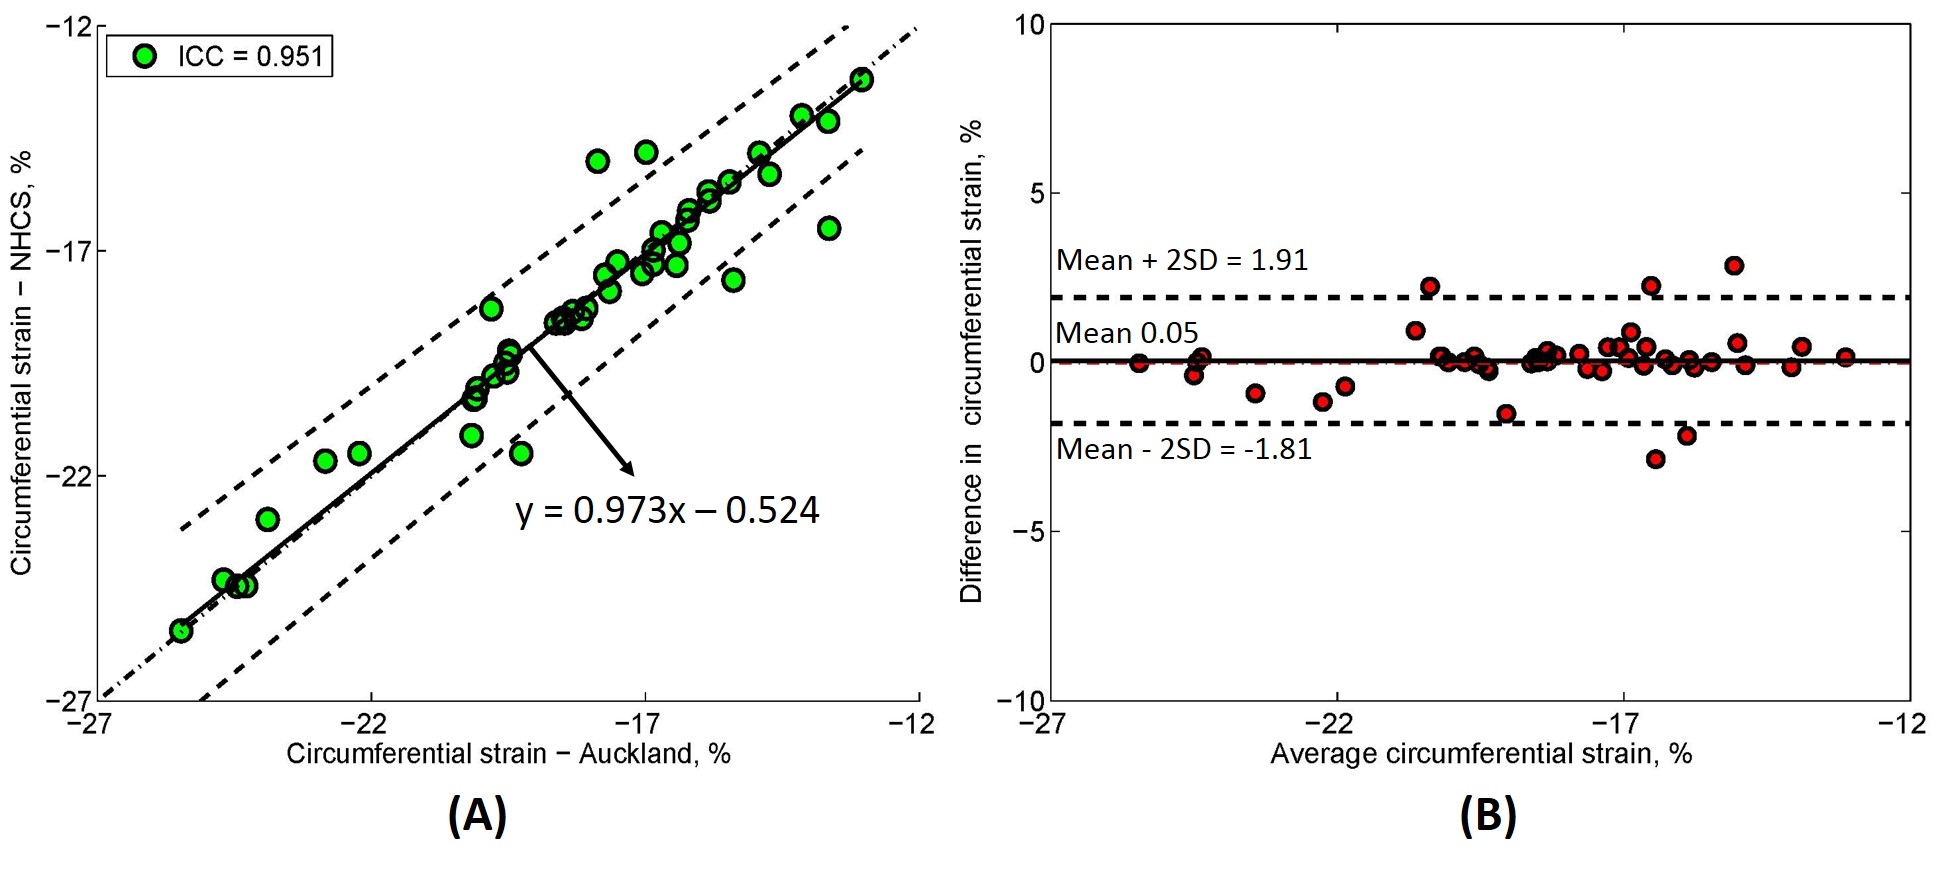
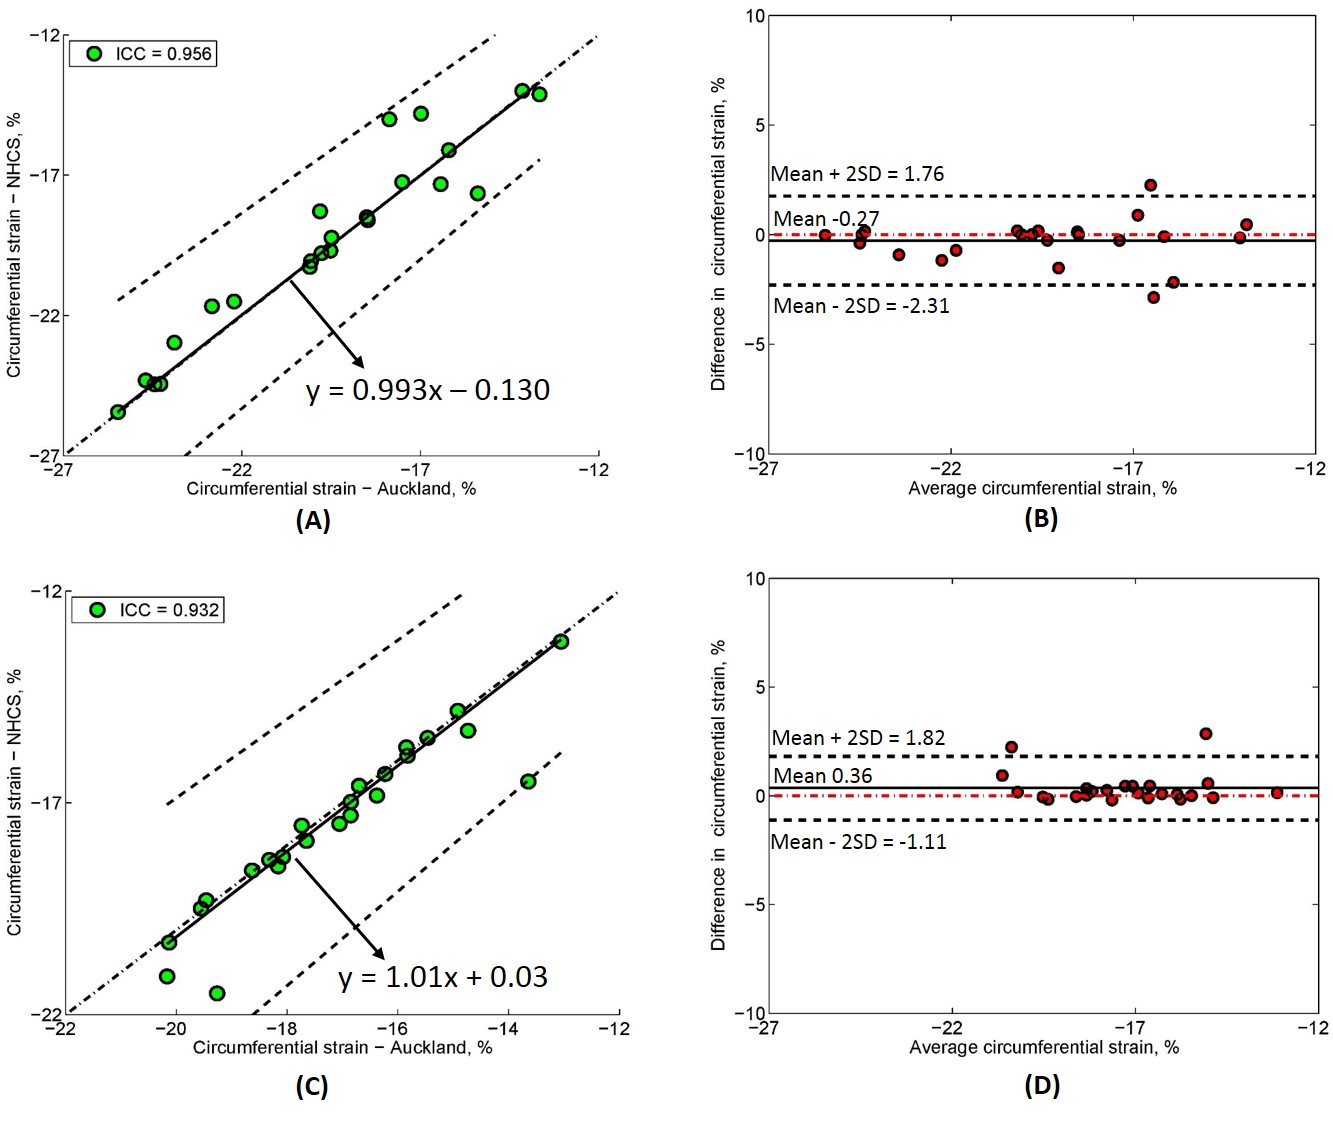
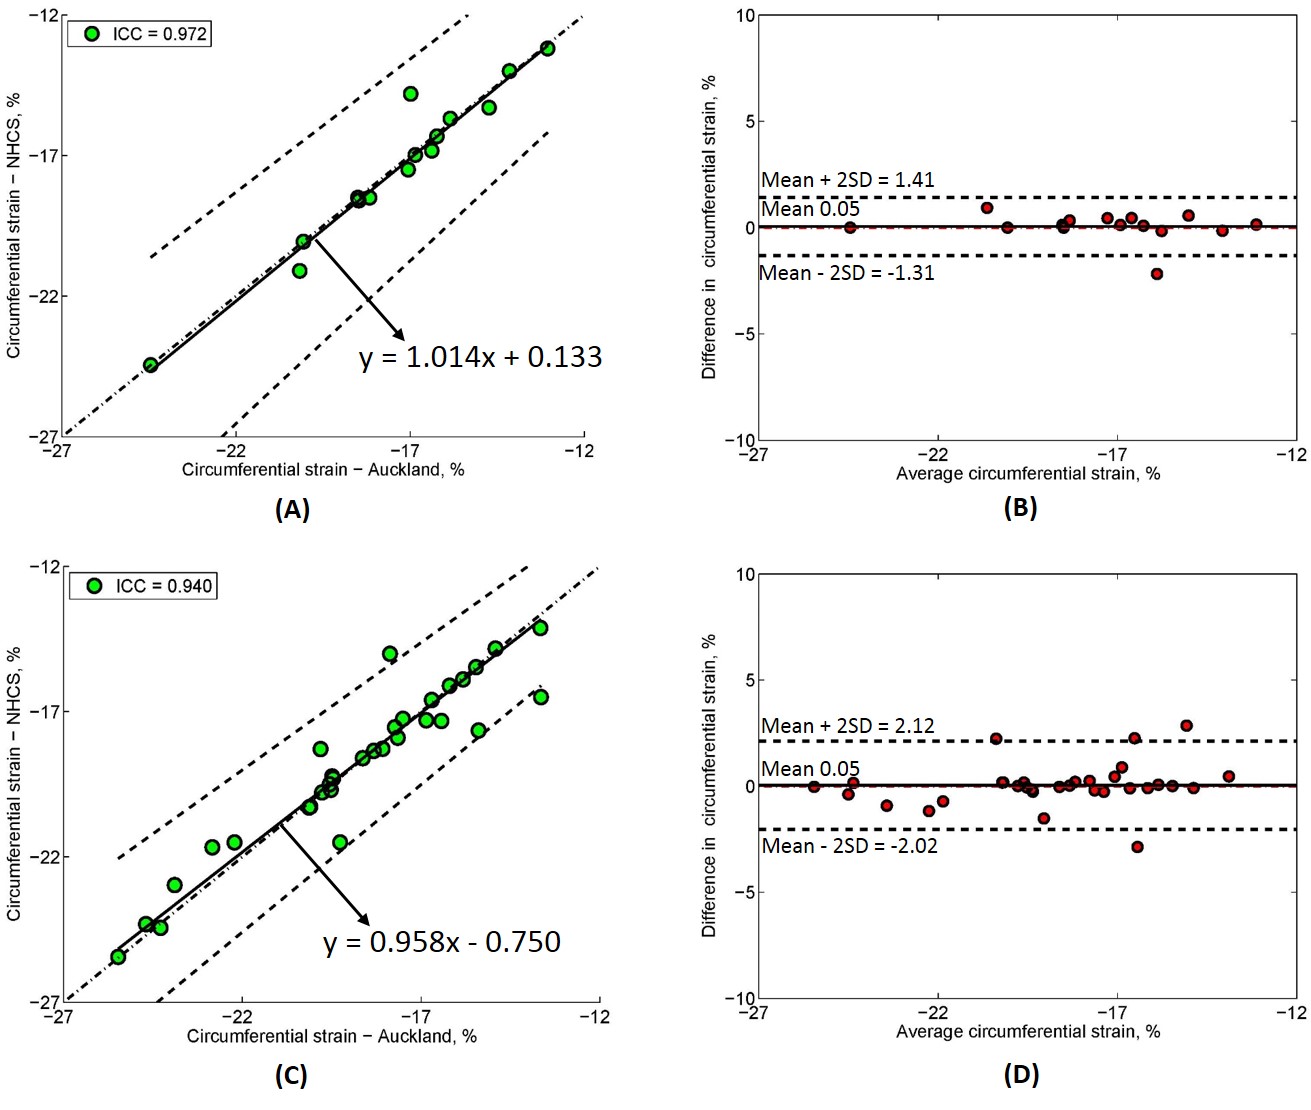
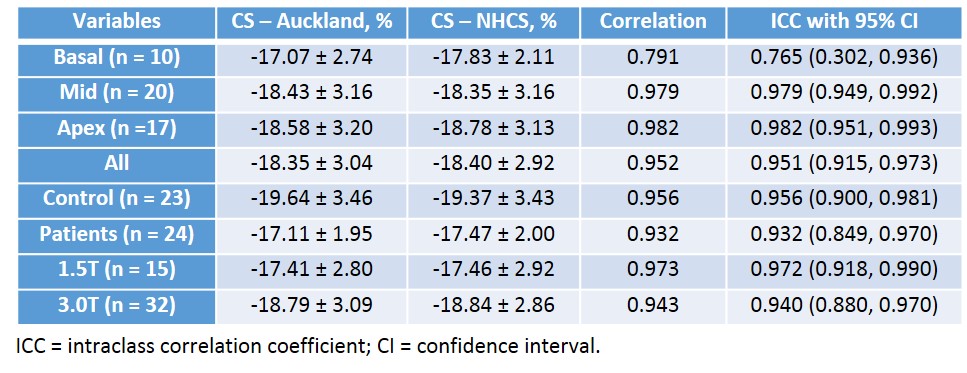
Of 20 tagging cases, CS was analysed in 47 slices including 20 mid slices, 17 apex and 10 basal slices (since only basal slices with a full circumference of myocardium at end-systole were analysed). The CS values for all slices (n = 47) from reader 1 and reader 2 were -18.35 ± 3.04% vs. -18.40 ± 2.92% with ICC = 0.951 with 95% CI (0.915, 0.973). Passing-Bablok regression with 95% confidence bands and Bland-Altman bias plot are given in Fig. 2 (A) and Fig. 2 (B). For the basal, mid and apex slices, circumference strains were correlated with ICC = 0.765, 0.979 and 0.982, respectively. Furthermore, intraclass coefficients for CS in patients (n = 24) and healthy controls (n = 23) were 0.932 and 0.956. A significant difference in CS was found between patients and controls (-17.29 ± 1.94% vs. -19.51 ± 3.40%, P < 0.05). Passing-Bablok regression with 95% confidence bands and Bland-Altman bias plot are given in Fig. 3 (A)-(D). Lastly, CS for both 1.5T (n = 15) and 3.0T (n = 32) was reproducible with ICC = 0.972 and 0.940, both with mean difference 0.05%. Passing-Bablok regression with 95% confidence bands and Bland-Altman bias plot are given in Fig. 4 (A)-(D). All the CS values from two centres and ICC with 95% CI are shown in Table 1.Conclusions
Inter-observer reproducibility from inter centres of circumferential strain by using the tagged MRI was excellent.Acknowledgements
No acknowledgement found.References
1. Young AA, Li B, Kirton RS, Cowan BR. Generalized spatiotemporal myocardial strain analysis for DENSE and SPAMM imaging. Magn Reson Med. 2012; 67:1590-1599.
2. Moody WE, Taylor RJ, Edwards NC, Chue CD, Umar F, Taylor TJ, Ferro CJ, Young AA, Townend JN, Leyva F, Steeds RP. Comparison of magnetic resonance feature tracking for systolic and diastolic strain and strain rate calculation with spatial modulation of magnetization imaging analysis. J Magn Reson Imaging. 2015;41(4):1000-12.
3. Passing H, Bablok W. A new biometrical procedure for testing the equality of measurements from two different analytical methods. Application of linear regression procedures for method comparison studies in Clinical Chemistry, Part I. J Clin Chem Clin Biochem 1983;21:709-20.
Figures