2865
Determining prolate spheroidal modes of cardiac deformation directly from tagged heart images1Radiation Oncology, University of Florida, Gainesville, FL, United States, 2Biomedical Engineering, University of Florida, Gainesville, FL, United States
Synopsis
An approach was developed to compute modes of left ventricular wall deformation directly from tagged MR images via generation of simulated tagged images undergoing modes of deformation expressed in a prolate spheroidal coordinate system (PSCS). This eliminates the laborious pre-processing step of detecting tags and/or points along tags while employing an efficient and accurate representation of LV wall motion in terms of PSCS modes. The method was tested with simulated and low-quality human image data sets with acceptable initial results. It is hoped that this advancement will help rekindle application of quantitative MR tagging in the clinical and research arenas.
Background
MR cardiac tagging provides a non-invasive means to accurately quantify regional myocardial wall strains in the clinical setting. The most accurate reconstruction methods require semi-manual segmentation of the heart and tag lines followed by modeling of the 3D wall motion with high degrees of freedom.1 The laborious preprocessing steps hinder the application of these modeling methods in the clinic and for research purposes.Purpose
The goal of this project was to develop a method for computing myocardial wall strains more efficiently by matching patient tagging images directly to virtual tagged images under deformation via prolate spheroidal (PS) modes of displacement.2 This eliminates the time-consuming additional step of semi-automatically detecting the tags or points along the tags.3Methods
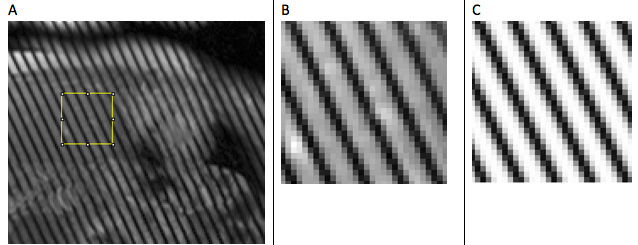
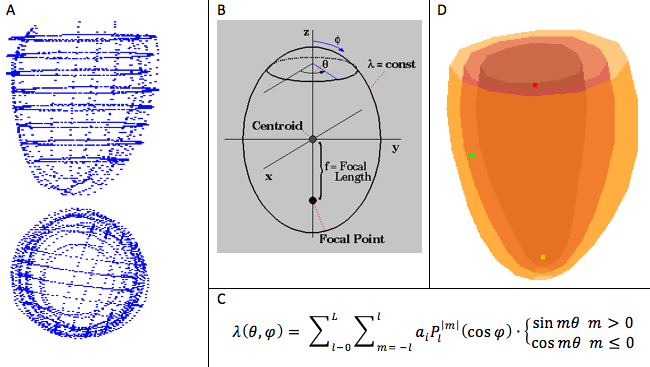
A time series of parallel-tagging cardiac MR images in a patient were acquired and a dedicated semi-automatic snake-based contouring program applied to the endocardial and epicardial borders on each image. The contour points at each time frame were fit to a surface model to define the local heart PS coordinate system and for subsequent generation of mesh points at which to compute and display the myocardial wall strains (Figure 1).4 The tag spacing, width and orientation for each series in the patient scan were determined by first manually selecting in the first time image a region in which the tags were clear and undeformed (typically a 40x40 pixel rectangle in the liver; see Figure 2). Next, a virtual parallel tagged image was created using the initial tag parameter values. The tag parameter values were then iteratively adjusted to achieve the largest normalized cross-correlation coefficient (NCCC) between the virtual and real parallel-tagged images. The typical NCCC value at this step was around 0.97 (where 1.0 indicates a perfect match). Starting with the first time frame, the 6 bulk motions (3 translations and 3 rotations in x, y and z) and the modes of deformation in the local PS coordinate system were iteratively applied to the heart with the effect of warping the virtual tagged images for each of the 3D series and slices of patient images. Because the tags are aligned perpendicular to the image plane for each series and slice, we used the efficient approach of warping each pixel in the deformed image back to its 3D, sub-pixel location in at the reference time and determining the virtual tag intensity (with sub-pixel accuracy based on the underlying Gaussian model of the tag profile) in the reference time and then applying this pixel intensity to the pixel location in the deformed time point. Under rotation and/or shearing of the heart, the tag planes can become non-perpendicular to a given slice plane, thereby generating tag lines that are spread out and our method for computing virtual tag pixel intensities account for this tag blurring effect. The estimates for the 6 bulk motions and the coefficients in the PS deformation model thus generate virtual warped tagged images. The PS modes of deformation are expressed via a spherical harmonics series. The modes for displacement in the radial component, lambda, are given in Equation 1, however the first term in the series for Δlambda is replaced by pure concentric isovolumic contraction.
Eqn. 1
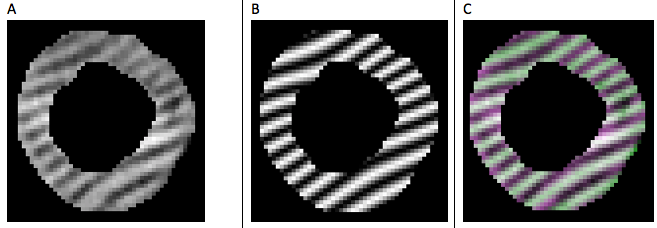
Iterative optimization of the bulk motion and PS coefficients was performed to achieve the best NCCC match between the patient and virtual tagged images for each series and slice simultaneously. The NCCC matching on each image slice was performed only over pixels that were contained between the 2D endocardial and epicardial contours as determined from the initial contouring step (Figure 3a). For each time frame in succession, the optimal coefficients from the previous time were used as the initial estimates for the parameter optimization. A graphical user interface was created to facilitate real-time adjustment of parameters by the user and visualization of the image-matching results.
Results and initial Conclusions
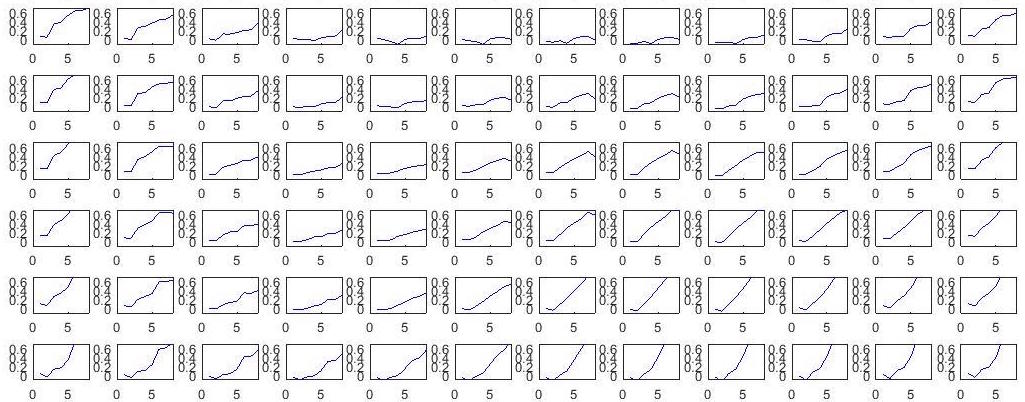
The program was tested using simulated deformed tagged-heart images and applied to a low-quality human tagged cardiac MR data set. A simulated testing data set was generated for an ellipsoidal LV geometry and consisting of 2 short axis and 2 long axis stacks of parallel slice planes. The testing data set validated the applicability of the approach and correctness of the code and internal mathematical formulations. Applied to the human data set, the resulting approach achieves visually acceptable results (see Figures 3&4) even in regions with poor tag and image quality where direct segmentation of the tags or points along the tags would likely fail.Acknowledgements
The authors wish to acknowledge funding for this work through the University of Florida University Scholars Program, and the Ocala Royal Dames for Cancer Research Foundation.References
1. J. Declerck et al., “Left ventricular motion reconstruction from planar tagged MR images: a comparison,” Phys. Med. Biol. 45(6), 1611–1632 (2000).
2. W. G. O’Dell et al., “Three-dimensional myocardial deformations: calculation with displacement field fitting to tagged MR images,” Radiology 195(3), 829–835 (1995).
3. M. A. Guttman, E. A. Zerhouni, and E. R. McVeigh, “Analysis of Cardiac Function from MR Images,” IEEE Comput. Graph. Appl. 17(1), 30–38 (1997) [doi:10.1109/38.576854].
4. W. G. O’Dell and A. D. McCulloch, “Imaging three-dimensional cardiac function,” Annu. Rev. Biomed. Eng. 2, 431–456 (2000) [doi:10.1146/annurev.bioeng.2.1.431].
5. C. C. Moore et al., “Three-dimensional systolic strain patterns in the normal human left ventricle: characterization with tagged MR imaging,” Radiology 214(2), 453–466 (2000) [doi:10.1148/radiology.214.2.r00fe17453].
Figures