2863
On the link between cardiac action and magnetic field dynamics observed with NMR sensors1Institute for Biomedical Engineering, ETH Zurich and University of Zurich, Zurich, Switzerland, 2Skope Magnetic Resonance Technologies Inc., Zurich, Switzerland
Synopsis
Magnetic field dynamics recorded with NMR field sensors located close to beating heart provide detailed access to cardio-vascular action. We present a realistic model that examines the physical pathways which translate mechanical heart activity into observable magnetic field dynamics. It is based on a 4D tissue model obtained from cardiac cine MR images. We confirmed that the observed signals are mainly caused by displacements of blood and muscle tissue. The presented modelling approach is expected to advance the physiological interpretation of the observed signals.
Introduction
Magnetic field measurements in high background fields provide sensitive access to the dynamics of the heart and the major vessels1–5. Recorded in close proximity to the heart, such field dynamics are thought to be generated by the periodic redistribution of magnetized tissues. The traces thus primarily reflect the mechanics of the heart and are complementary to electrocardiography, which maps its electrical activity. To date, the physical pathways translating cardiac mechanical activity into the observed field dynamics are hardly explored, such that the physiological interpretation of the signals is unclear. Early attempts1-3 to interpret the observed signals resulted in a one-parameter model fitting the recorded magnetic field dynamics to a single stationary dipole with temporally varying magnetic moment. With this model, physiologically realistic values for the cardiac stroke volume were extracted from traces recorded with SQUIDs in moderate background fields (<1 mT).
Using sensitive NMR field probes6 operated in ultrahigh field MRI magnets, the contrast-to-noise ratio of such recordings was recently increased by up to two orders of magnitude4,5. As a consequence, the added level of detail calls for more realistic modelling. In this work we present a novel model that infers the three-dimensional magnetic fields distribution from a temporally resolved, three-dimensional tissue map generated from cardiac cine MR images. It is shown to reproduce a great level of detail and is expected to facilitate the interpretation of the signal characteristics substantially.
Method
The model assumes the measured field dynamics to be produced solely by the magnetized cardiac tissues changing their volume, shape and position as a function of cardiac activity. The expanding heart thereby displaces primarily lung tissue.
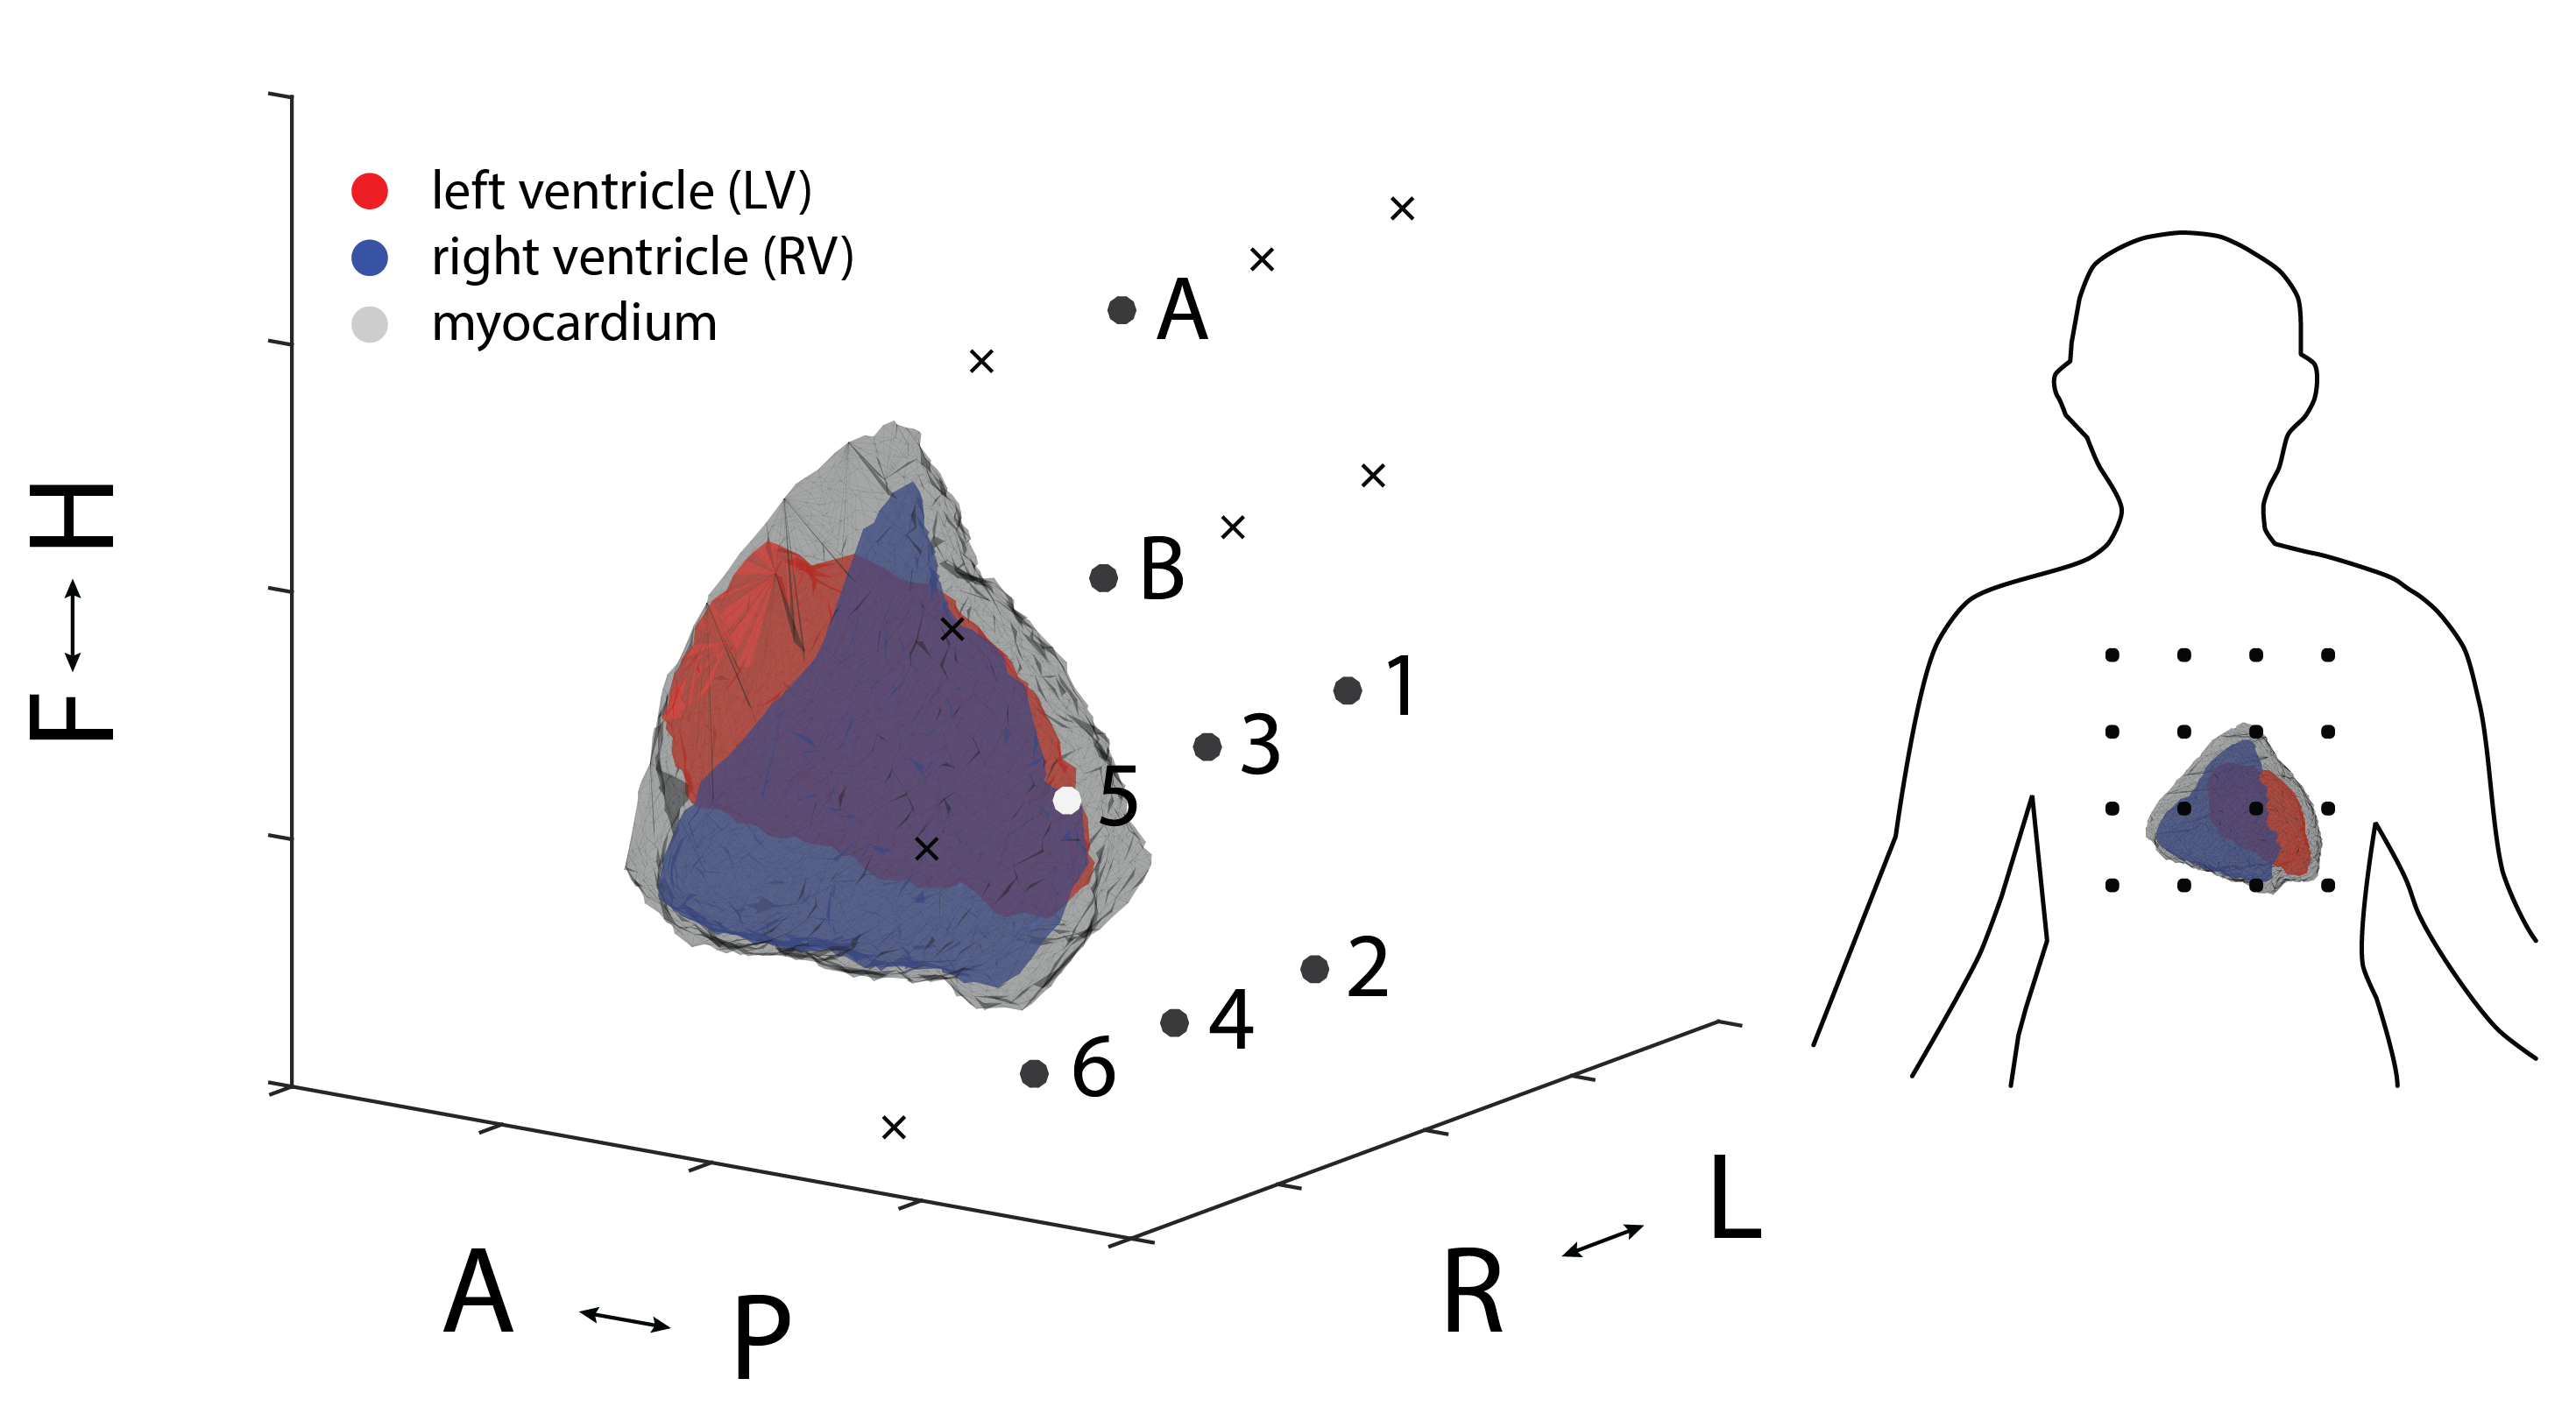
4D model generation: Cardiac cine MR images (bSSFP, TR 3.3 ms, 1x1x8 mm3 resolution) of a healthy subject were acquired with a 3 tesla scanner (Philips Ingenia). Data was acquired in inhaled breathhold position and divided in 30 cardiac phases, triggered by fingertip pulse oximetry. For each slice and phase, the left and right ventricle as well as the myocardium were segmented, providing a temporally resolved 3D model of the tissue distribution. The model was truncated at the level of the atrial valves. For each of the three tissue types (oxy-, and deoxygenated blood and muscle tissue) one magnetic susceptibility value was assigned7. The susceptibility of lung tissue2 was subtracted to mimic the embedding of the heart in the lung. Finally, for each cardiac phase, the 3D magnetic field distribution in a static magnetizing field of 7 tesla was calculated using a Fourier method8.
Field traces: 16 sensitive 1H NMR field probes4-6 were used to record cardio-vascular magneto-dynamics from the same subject at 7 tesla field strength (Philips Achieva). The temporal resolution was 5.5 ms. The field probes were arranged in a 4x4 quadratic grid at a spacing of 50 mm, suspended above the chest using an adjustable mechanical lever. Exact sensor positions were determined and co-registered to the coordinate system of the tissue model using three gradient pulses (Fig. 1). Cine imaging at 3T and field recording at 7T were performed in quick succession. The subject was asked to reproduce the same breathhold position in both experiments. Concurrently acquired pulse oximetry and ECG data were used for temporal alignment of the data.
Results
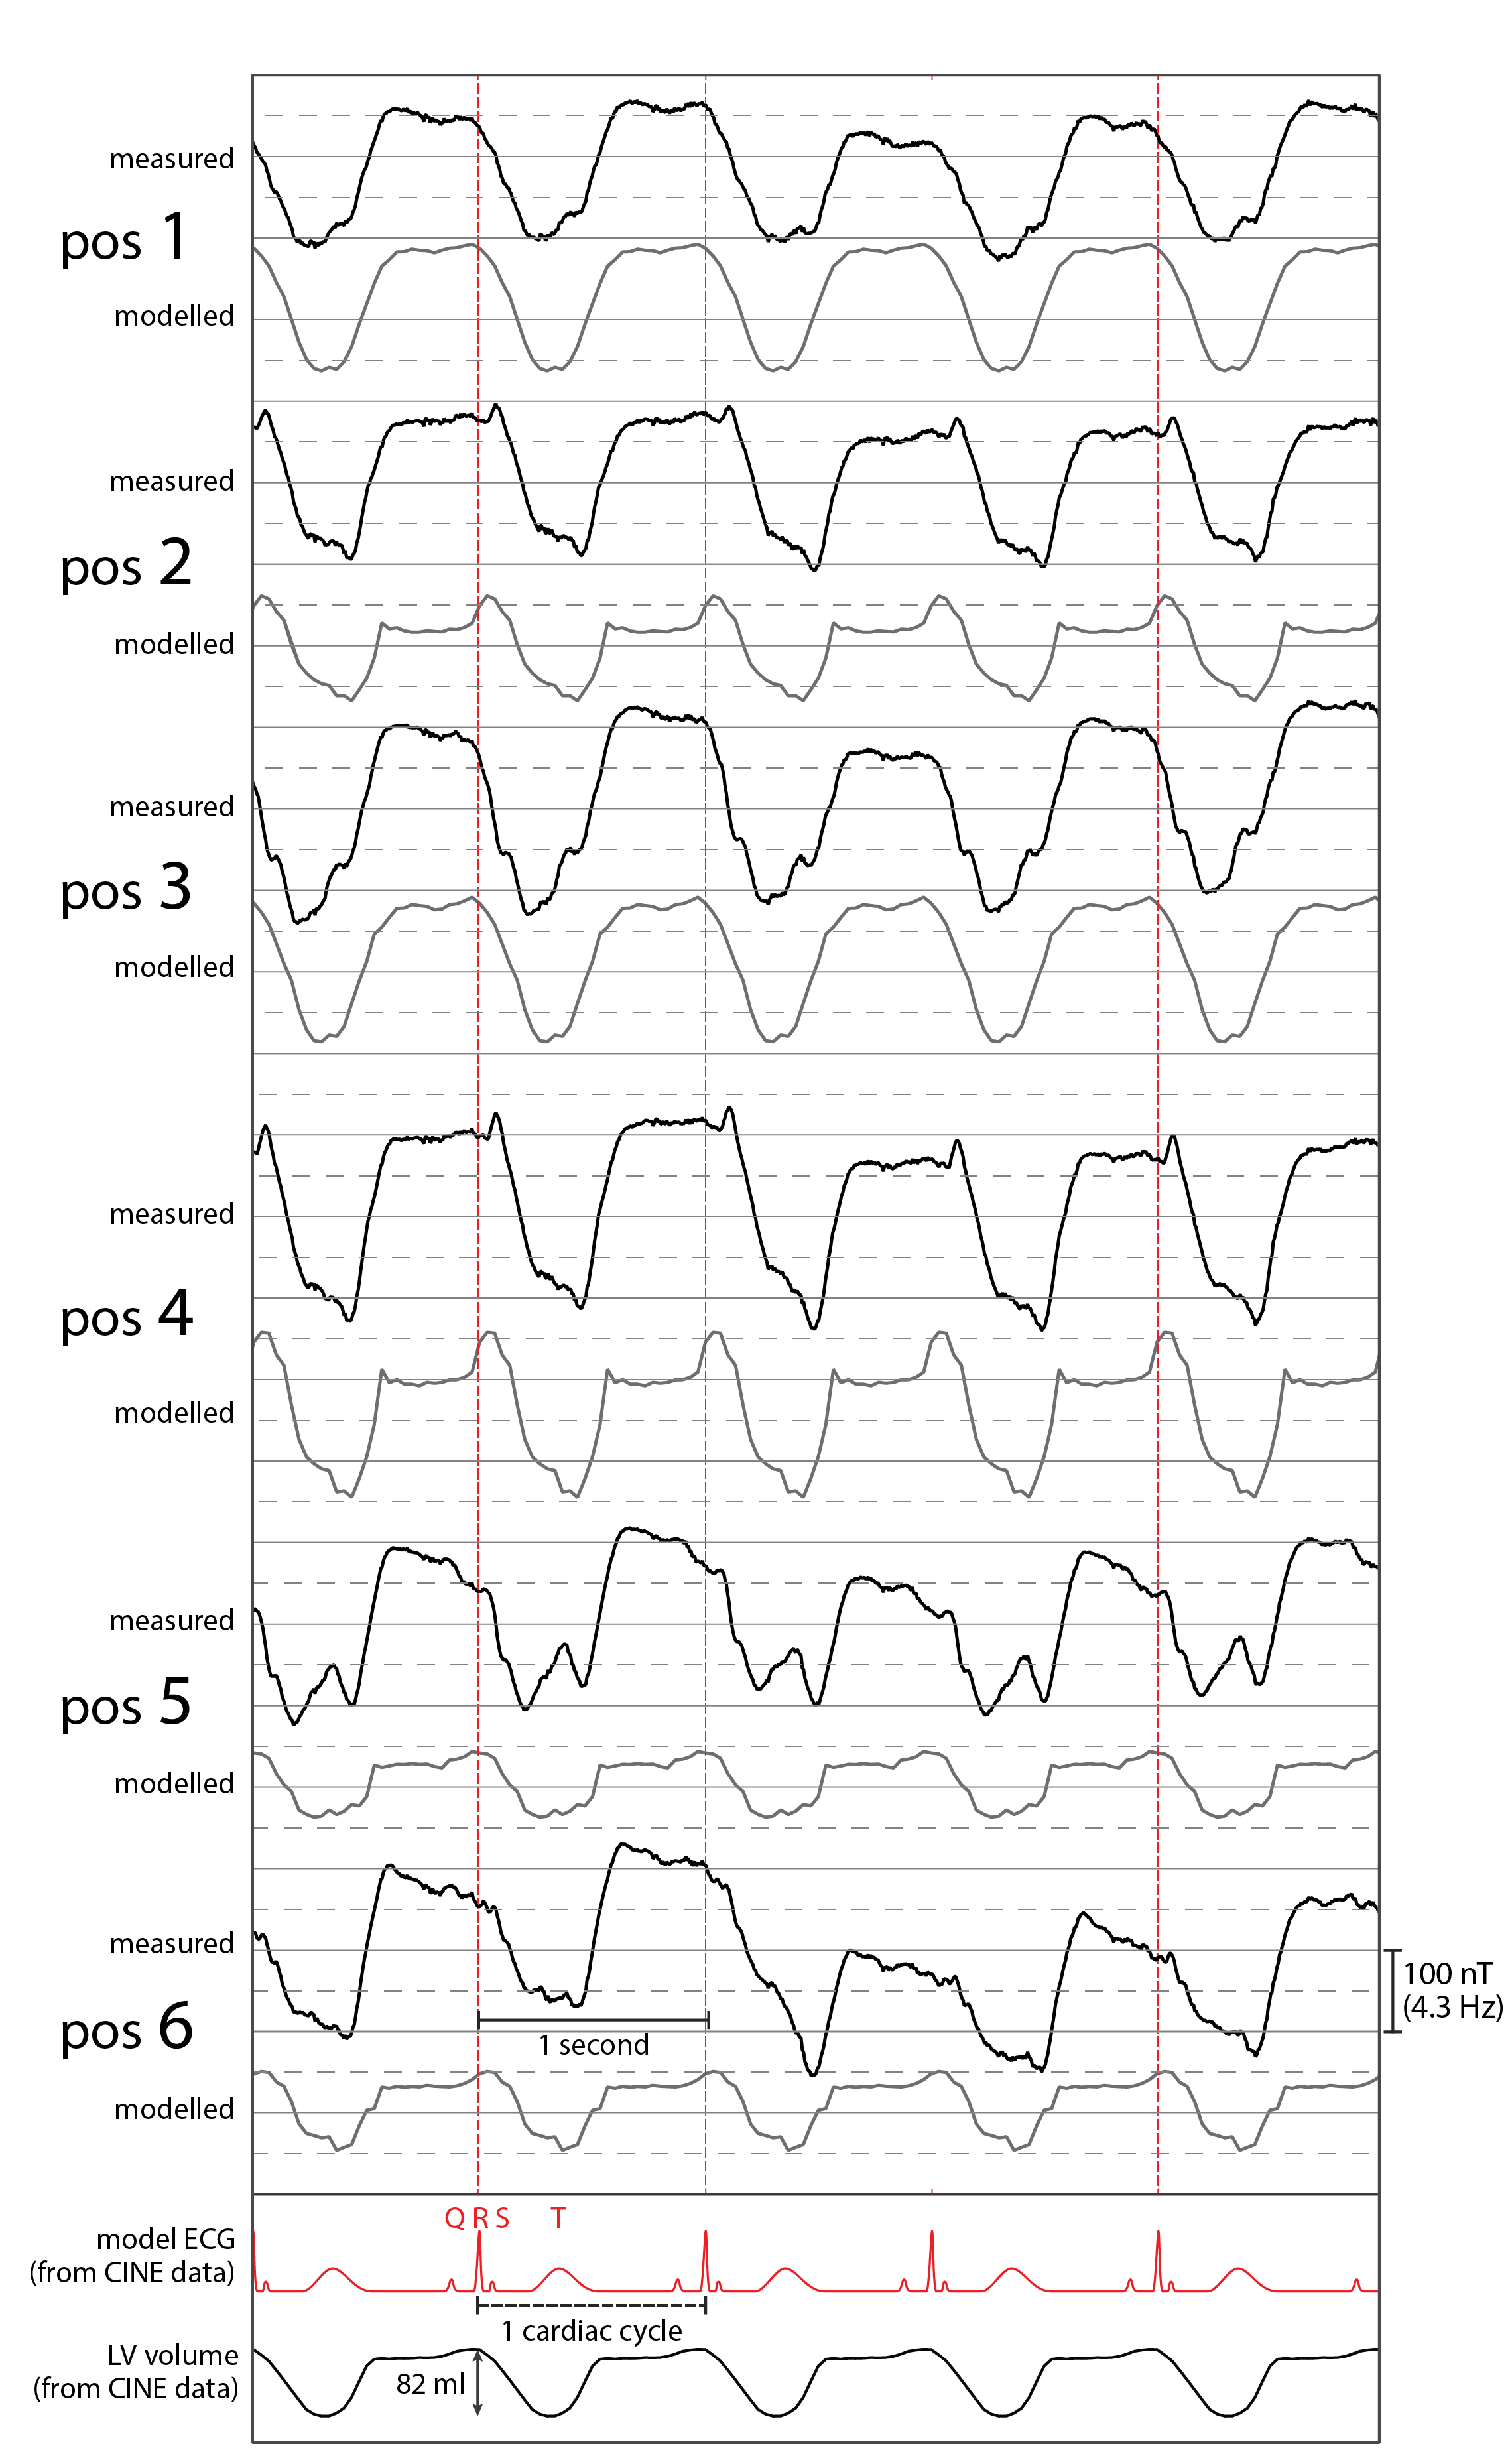
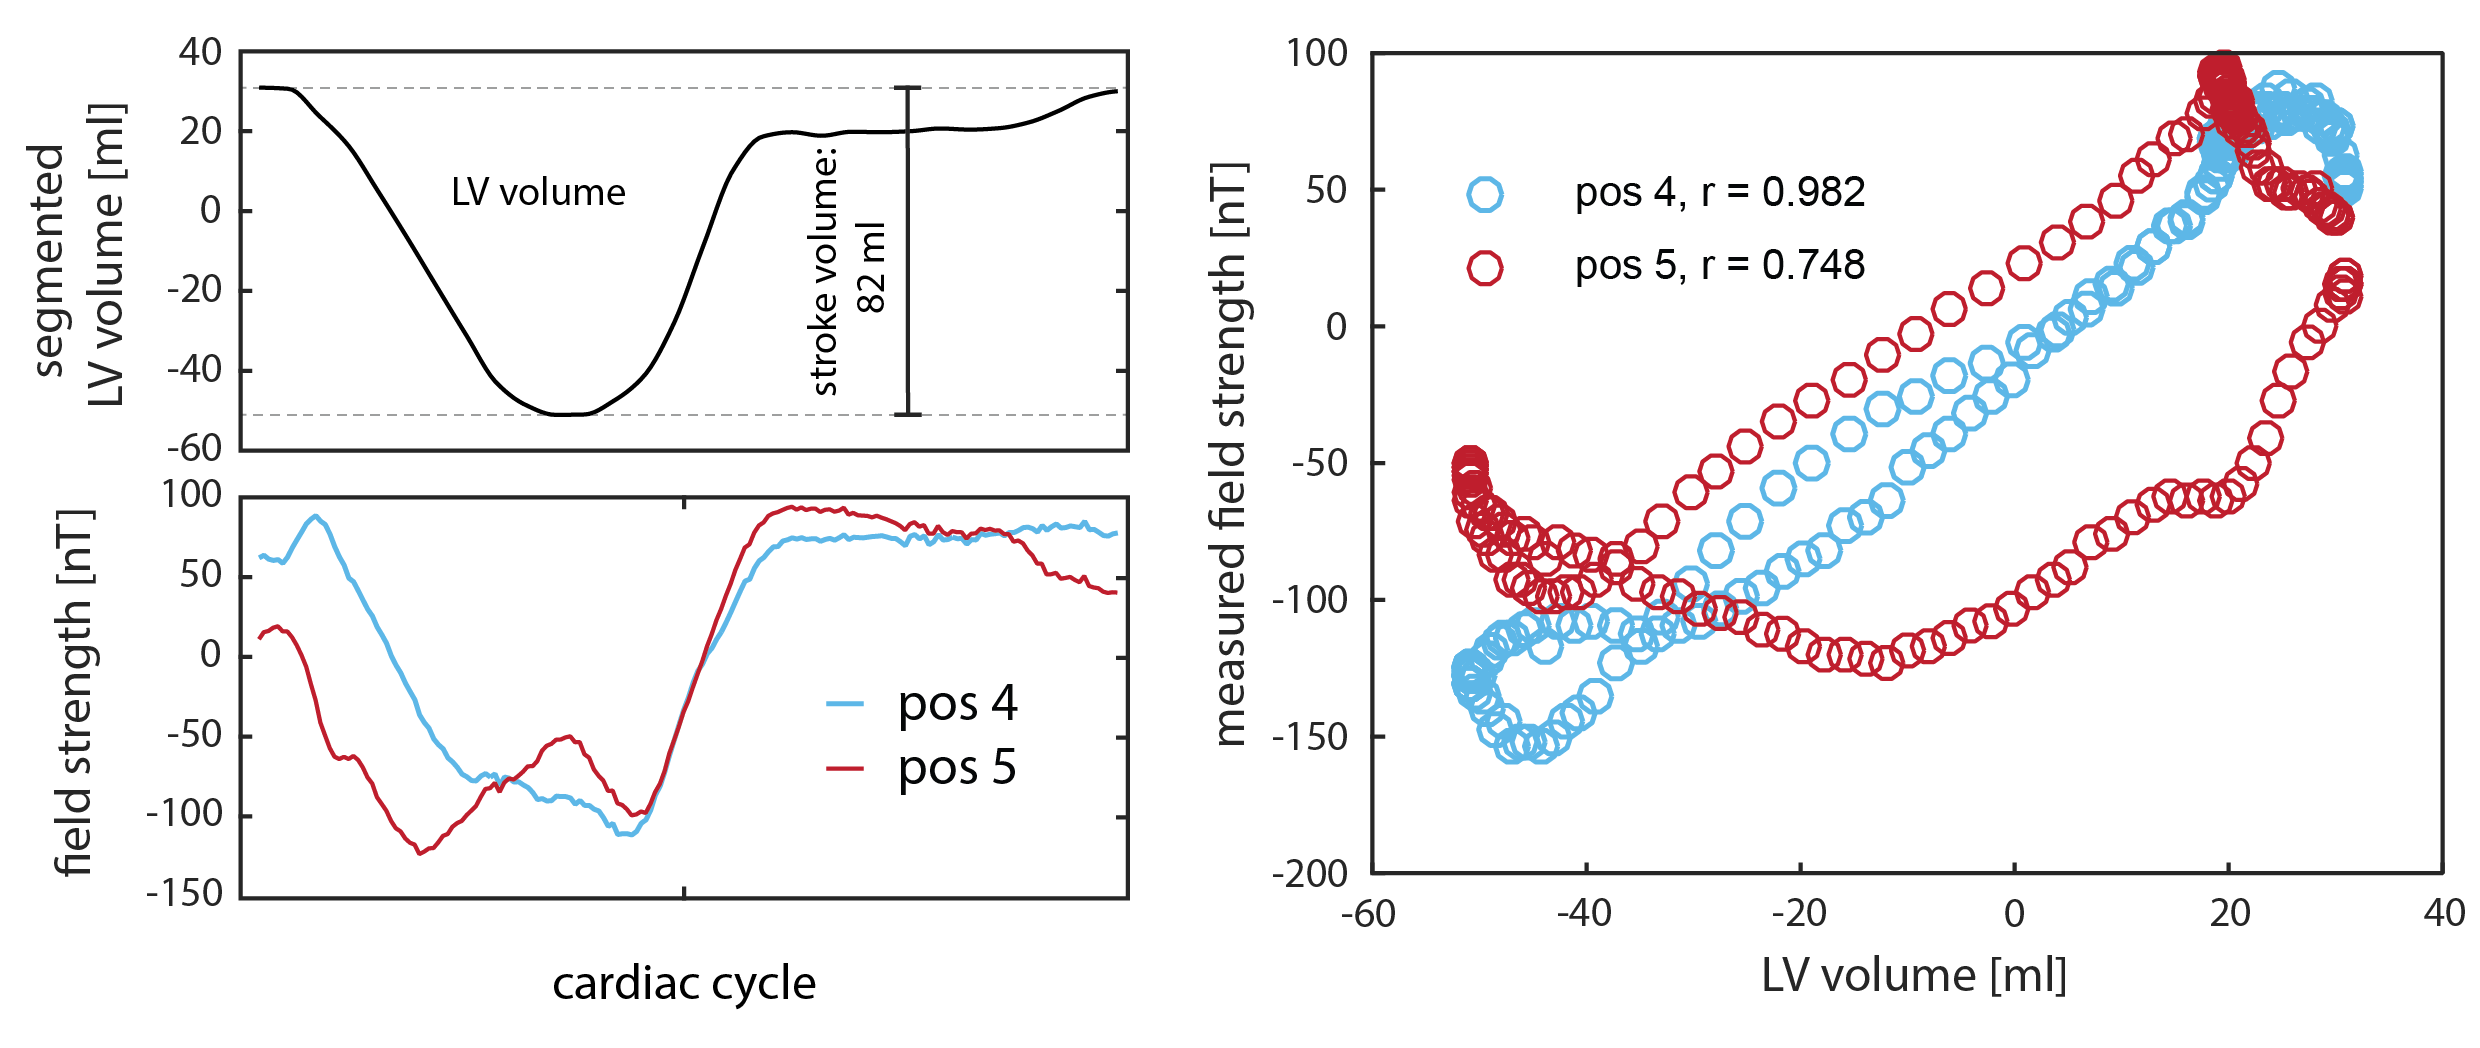
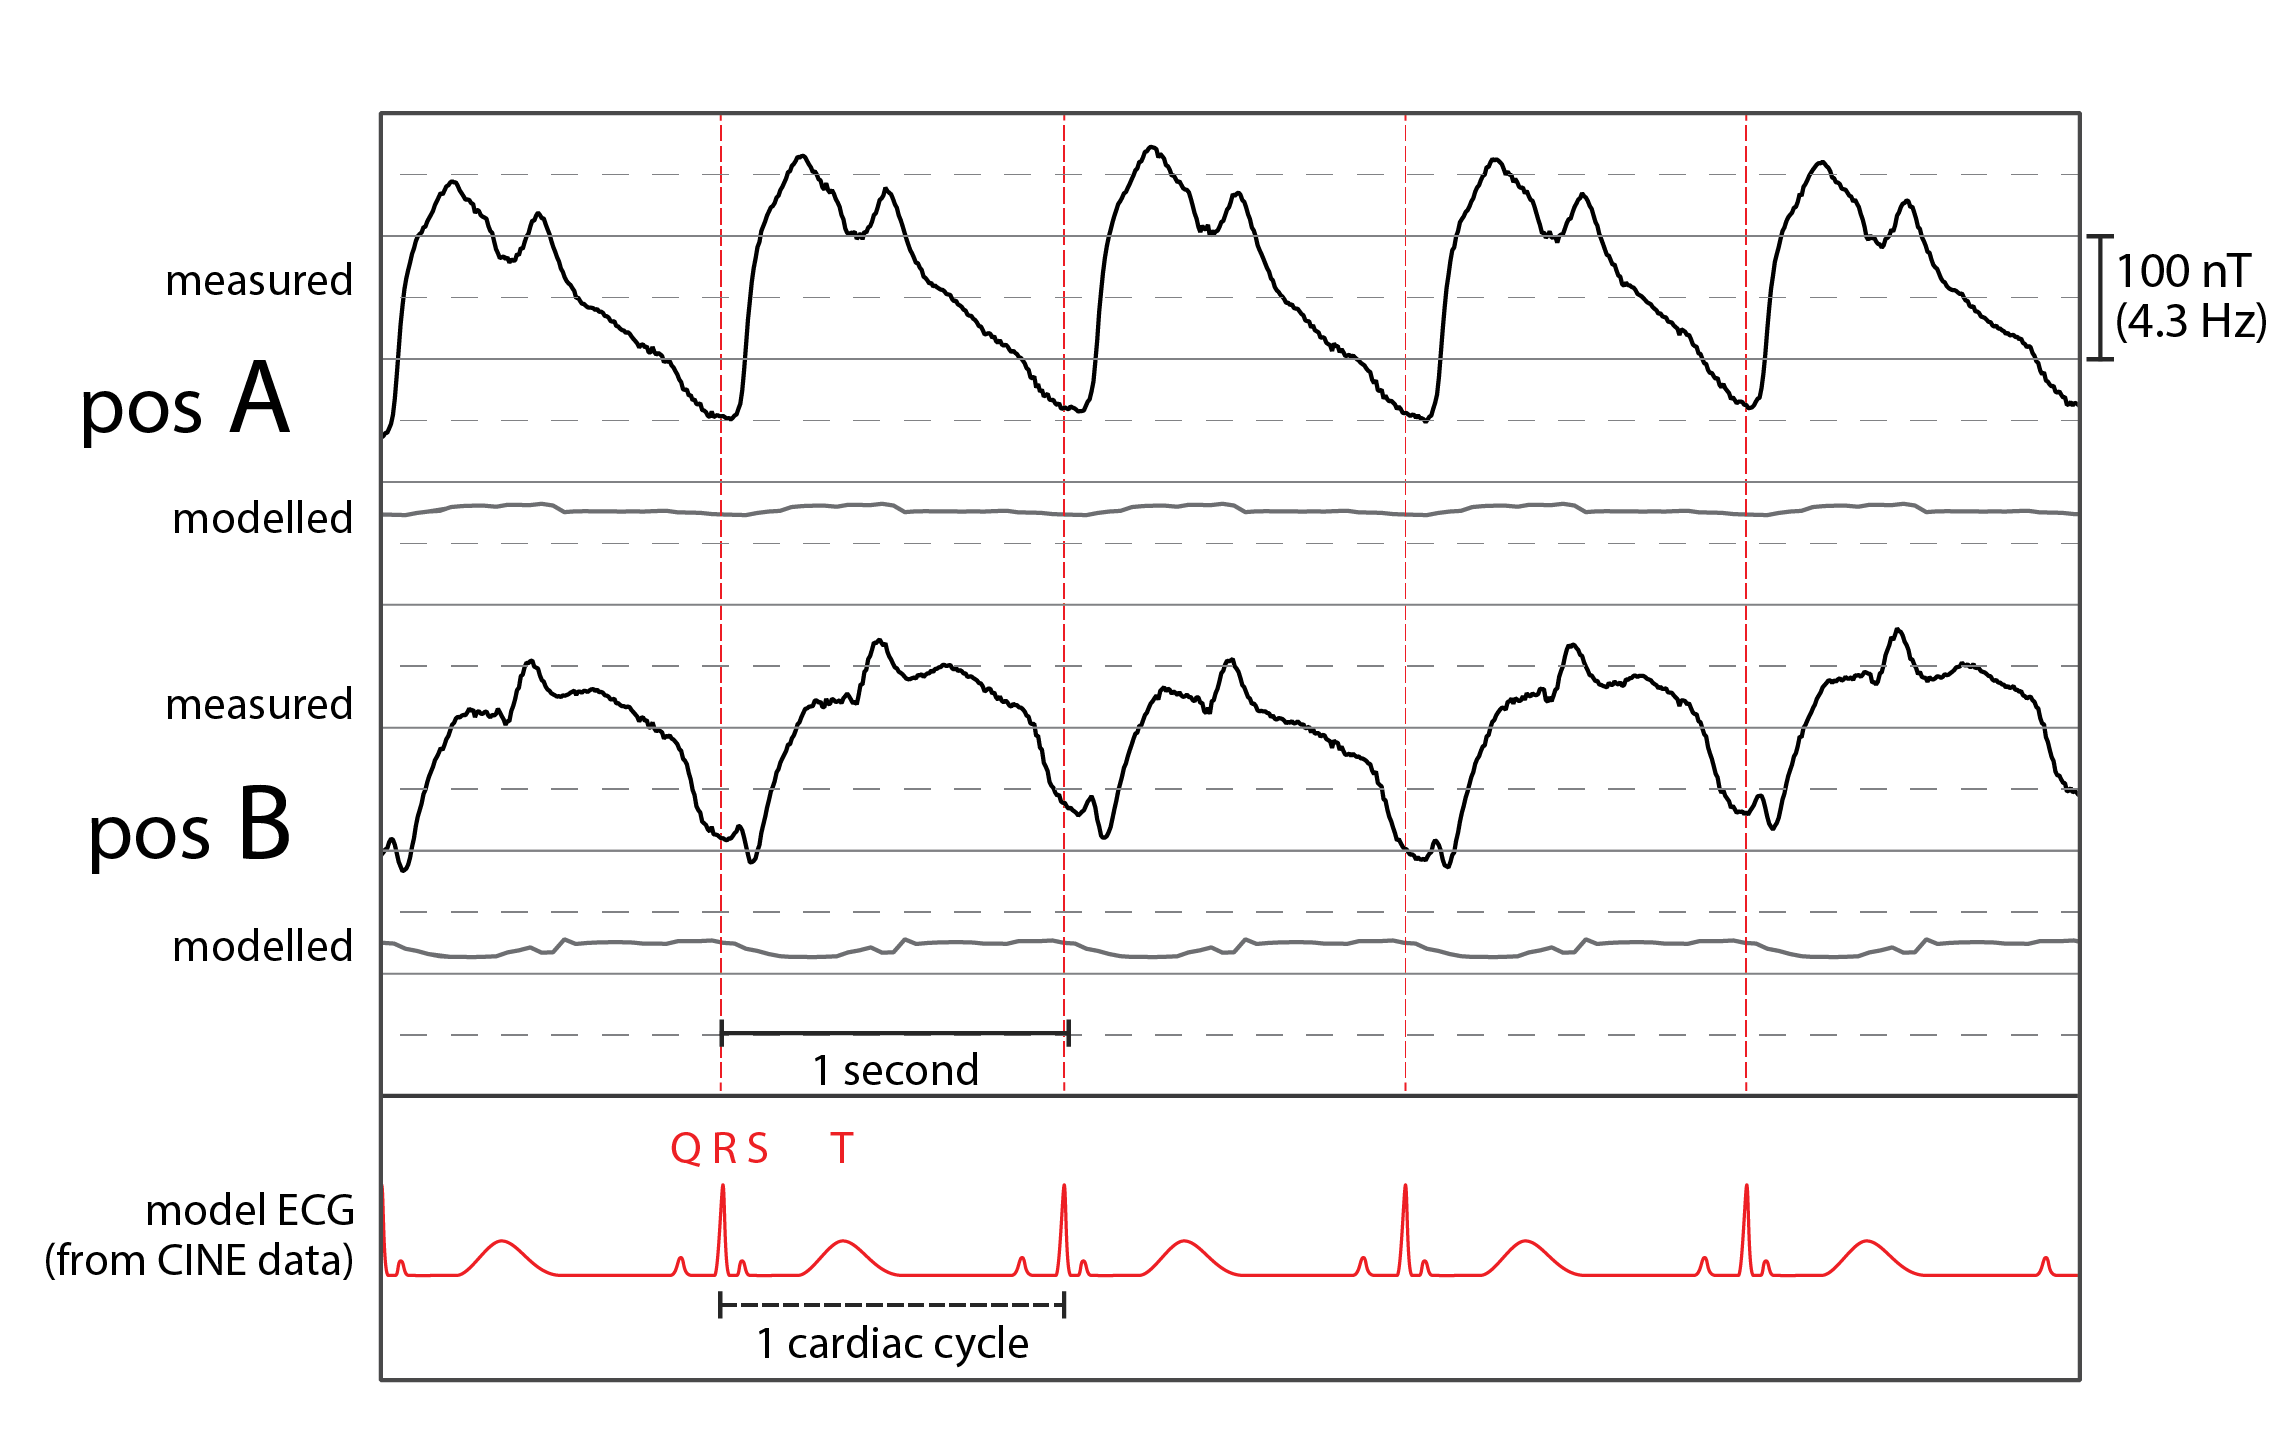
Figure 2 shows measured and modelled field traces at six positions close to the segmented volume. Overall, the model reproduces the measured dynamics with high accordance, covering also subtle details. Furthermore, Fig. 3 shows the direct comparison of two measured traces with the evolution of the left ventricular volume. Vastly differing correlation with coefficients of 0.98 and 0.75 indicate the insufficient degrees of freedom of the single-parameter model. As expected, the model accuracy is highest in the apical region and decreases towards the atria, which were not part of the model (Fig. 4).
Conclusion
We presented a realistic physical model examining the origin of magnetic field dynamics caused by cardiac activity. In a first step, the model was confined to the apical region of the heart. It confirmed that the field dynamics observed close to the modelled volume are caused primarily by displacements of blood and muscle tissue. Our findings further indicate that besides the mere change of ventricular volume, the field dynamics also encode other aspects of the mechanical choreography of the heartbeat. This is particularly accentuated in sensor positions remote from the apex, where ventricular volume changes fail to explain the observed dynamics. They must thus originate in other processes and may be expected to offer insight into the dynamics of the atria, aortic arch and blood therein.Acknowledgements
No acknowledgement found.References
1. Wikswo, J. P., Opfer, J. E. & Fairbank, W. M. Observation of Human Cardiac Bloodflow by Non-Invasive Measurement of Magnetic Susceptibility Changes. AIP Conf. Proc. (1974);18:1335–1339.
2. Maniewski, R. et al. Magnetic measurements of cardiac mechanical activity. IEEE Trans. Biomed. Eng. (1988);35:662–670.
3. Katila, T., Maniewski, R., Tuomisto, T., Varpula, T. & Siltanen, P. Magnetic Measurement of Cardiac Volume Changes. IEEE Trans. Biomed. Eng. (1982);BME-29:16–25.
4. Pruessmann, K. P., Dietrich, B. E. & Barmet, C. Observation of Cardiovascular Dynamics by Field Recording with an NMR Probe. Proc. Intl. Soc. Mag. Reson. Med. (2011);19:1171.
5. Gross, S., Dietrich, B. E., Barmet, C. & Pruessmann, K. P. Spatially resolved observation of cardiovascular magneto-dynamics with NMR field probes. in Proc. Intl. Soc. Mag. Reson. Med.(2013);21:1410.
6. De Zanche, N., Barmet, C., Nordmeyer-Massner, J. A. & Pruessmann, K. P. NMR Probes for Measuring Magnetic Fields and Field Dynamics in MR Systems. Magn. Reson. Med. 60, 176–186 (2008).
7. Spees, W. M., Yablonskiy, D. A., Oswood, M. C. & Ackerman, J. J. H. Water proton MR properties of human blood at 1.5 Tesla: Magnetic susceptibility, T1, T2, T*2, and non-Lorentzian signal behavior. Magn. Reson. Med. (2001);45:533–542.
8. Jenkinson, M., Wilson, J. L. & Jezzard, P. Perturbation method for magnetic field calculations of nonconductive objects. Magn. Reson. Med. (2004);52:471–477.
Figures