2862
Automated Cardiac Resting Phase Detection in 2D cine MR images for Acquisition Window Selection in High-Resolution Coronary MRI1Advanced Clinical Imaging Technology, Siemens Healthcare AG, Lausanne, Switzerland, 2Department of Radiology, University Hospital (CHUV) and University of Lausanne (UNIL), Lausanne, Switzerland, 3LTS5, École Polytechnique Fédérale de Lausanne (EPFL), Lausanne, Switzerland, 4Division of Cardiology and Cardiac MR Center, University Hospital of Lausanne (CHUV), Lausanne, Switzerland, 5Center for Biomedical Imaging (CIBM), Lausanne, Switzerland
Synopsis
In MR coronary angiography, the synchronization of the ECG-triggered imaging sequence with periods of minimal diastolic/systolic myocardial motion (resting phases) is essential. The selection of the resting phases is usually performed manually by an expert user. Here, automated detection of the period of minimal myocardial motion is described and tested in 30 cine patient datasets. After normalization of the cine image series, a 1D curve representative of the overall amount of motion for each cine frame is extracted. Frames belonging to diastolic/systolic resting phases are selected from such curve using peak detection and threshold-based region-growing. Testing is performed in comparison to manually expert-selected resting phases.
Purpose
In the context of coronary MR angiography (MRA), synchronization of the EGC-triggered imaging sequence with a period of minimal myocardial motion (resting phase) - whether in systole or diastole - is of prime importance. As the average displacement of the coronary arteries during a 120ms time period can be as high as 6mm1, timing imperfections in the ECG-synchronization can lead to strong blurring and sub-optimal image quality. The preselection of the resting phase is usually performed manually by an expert user (e.g. the medical professional at the scanner), based on visual assessment of a 2D-cine dataset acquired previous to the MRA2. Although some algorithms for automated detection of periods of minimal myocardial motion were previously proposed3,4, these studies were only applied to phantoms and volunteer data. In this work, a new algorithm for automated detection of the myocardial resting phases is proposed and tested on a patient population that underwent clinical cardiac MRI.Methods
Data acquisition: The cine datasets for the 2-chamber, 3-chamber, and 4-chamber views in N=10 subjects were randomly selected from the patient database of the local cardiac MRI center, before undergoing the prototyping pipeline for automated resting phase detection. Acquisitions were performed on a 1.5T clinical scanner (MAGNETOM Aera, Siemens Healthcare) with the following sequence parameters: 2D-bSSFP, spatial/temporal resolution (1.2x1.6mm)2/40ms, slice thickness: 8mm, TR/TE: 2.4/1.2ms.
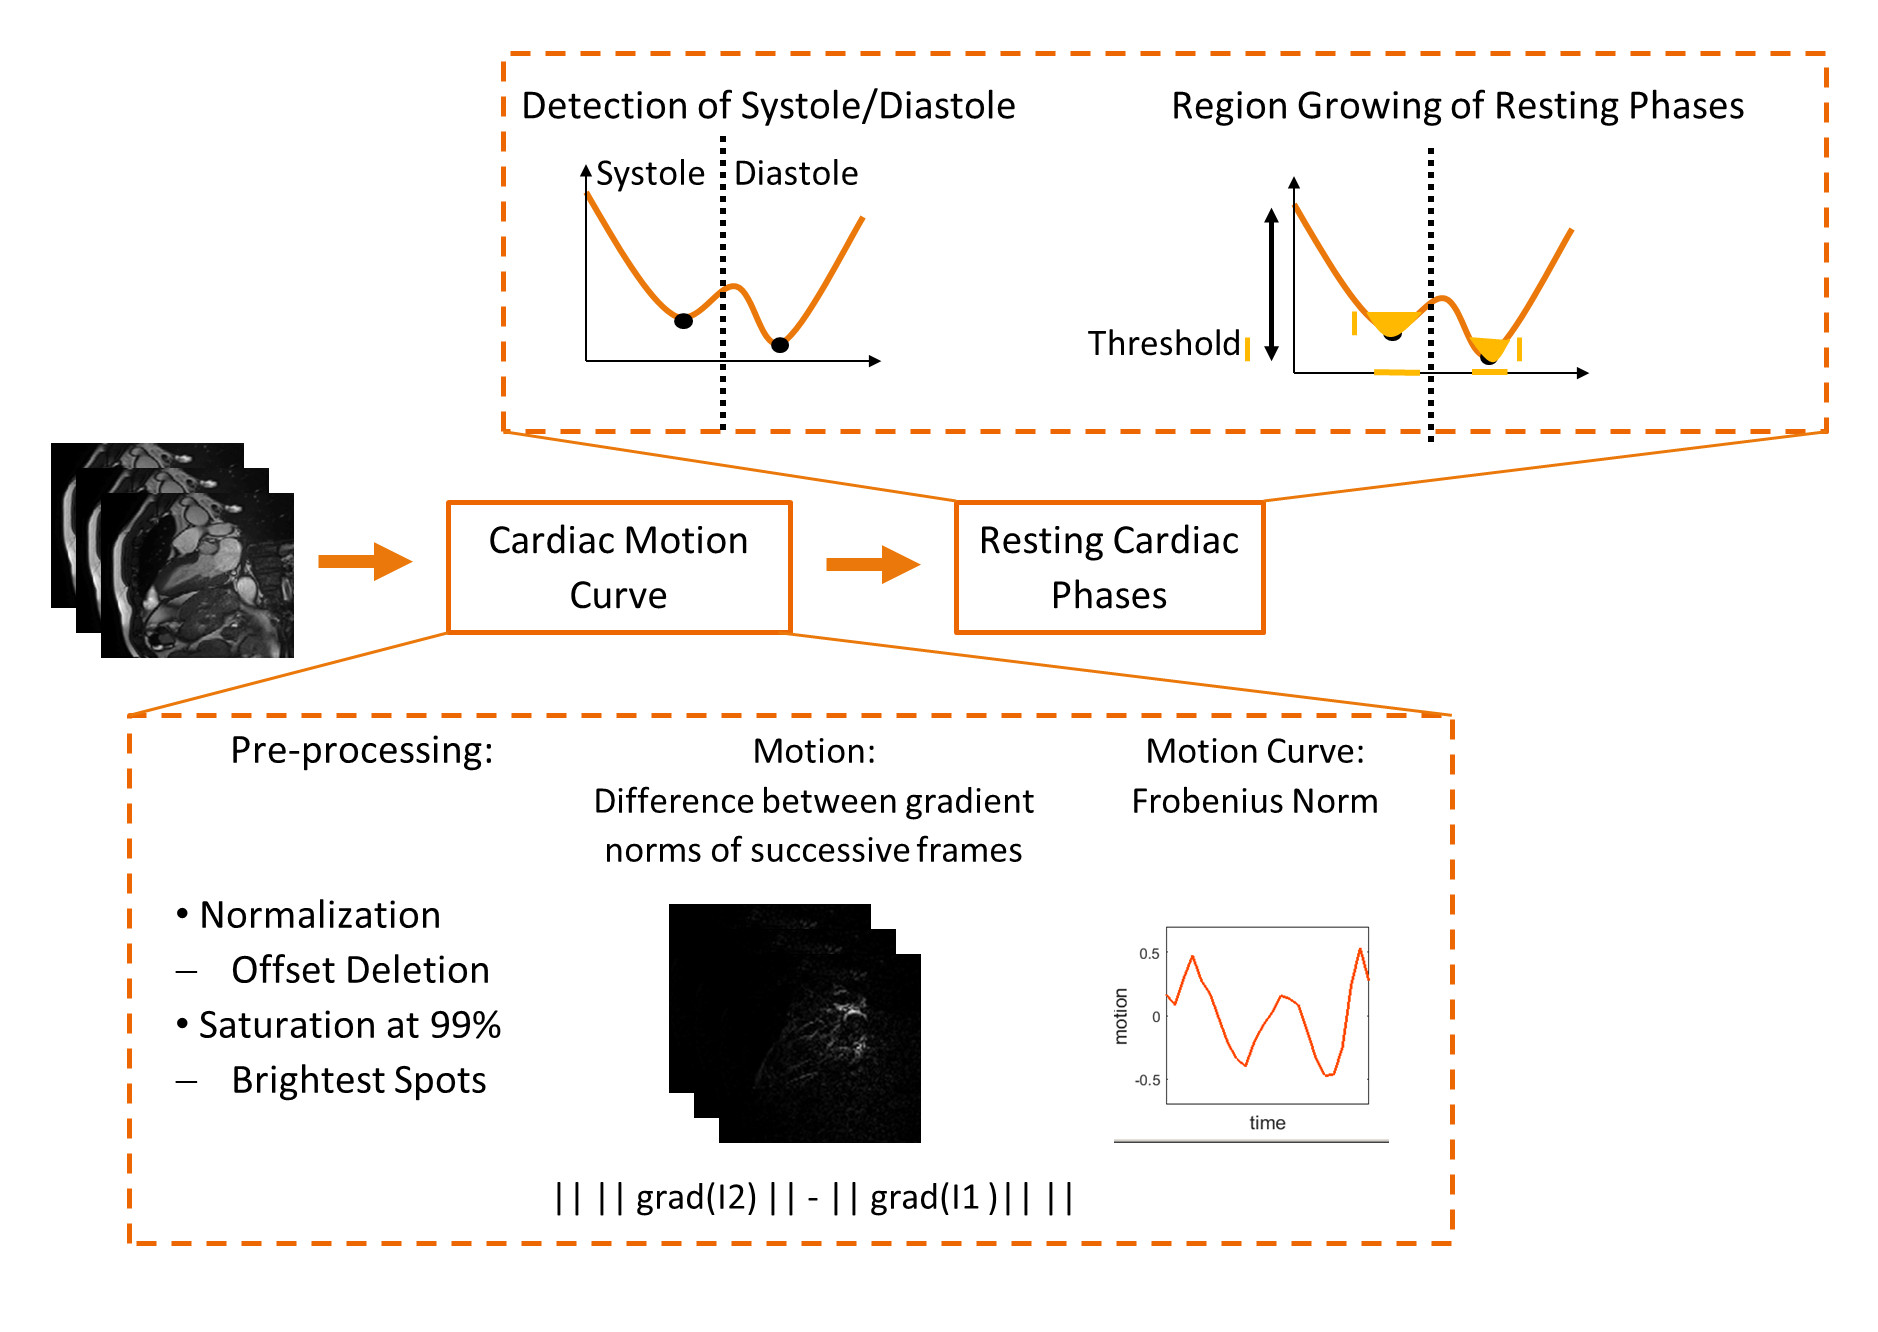
Automated extraction of cardiac motion parameters: All 30 2D-cine image series were first pre-processed by pixel intensities normalization. Then, for each pair of consecutive images in one series, the magnitude of the difference of their gradient magnitudes was computed. The resulting series is referred to as “difference images”. Such difference images are ideally zero when borders are not moving. To account for dark tissue motion (myocardium) as much as for bright structure motion (fat tissue and blood pool), the difference images were saturated at a normalized intensity of 99%. Finally, the Frobenius norm was calculated to represent the overall amount of motion for each difference image, thus resulting in a single parameter linked with the overall heart motion between two consecutive cine frames and that can be represented as a motion curve (Fig.1).
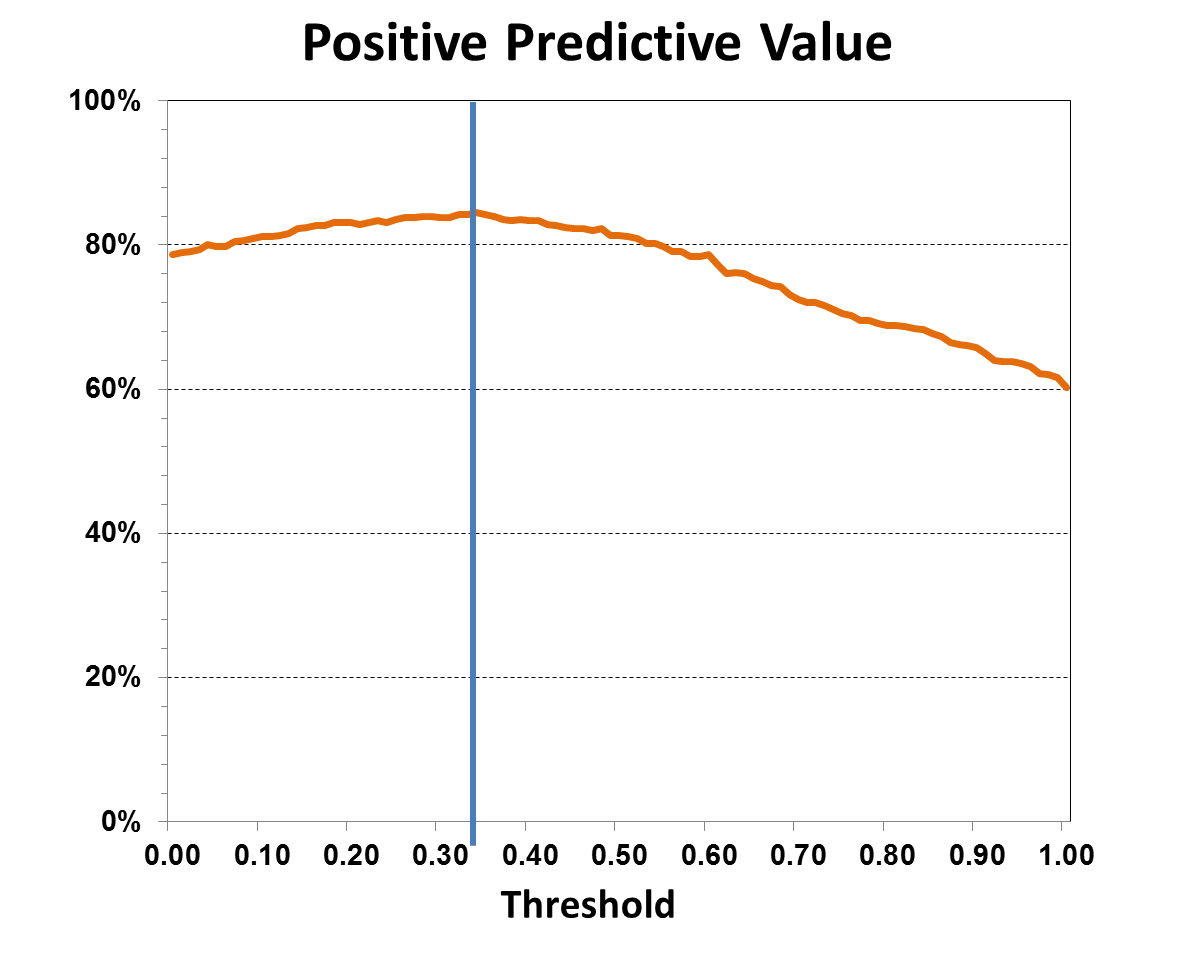
Detection of the cardiac resting phases: A threshold-based region growing algorithm was applied on the cardiac motion curve to determine the two sets of cine frames with the least amount of motion. The systolic and diastolic minima (example curves in Fig.2-3), were first extracted by standard automated peak detection. Then, a threshold (TH) was calculated as a percentage of the amplitude difference between these minima and the local maximum between them. This threshold was optimized in a subset of M=18 datasets, where manual selection of the cine frames corresponding to the systolic and diastolic resting phases was also performed by one experienced cardiologist (G.V., CMR level-III expert). In detail, for threshold selection, the problem of assigning each cine frame to a resting phase was considered as a statistical test, with the ground truth being the manual selection. For TH ranging from 0.00 (0%) to 1.00 (100%) in steps of 0.01, true positives (TP) and true negatives (TN) were computed. The maximum positive predictive value (PPV=(TP+TN)/M) was used to select the optimized threshold.
Validation: For validation, the resting phases automatically selected using the optimal threshold were compared with those manually selected (same expert as above) in the remaining Q=12 datasets. Validation results were reported as specificity, sensitivity, and PPV.
Results
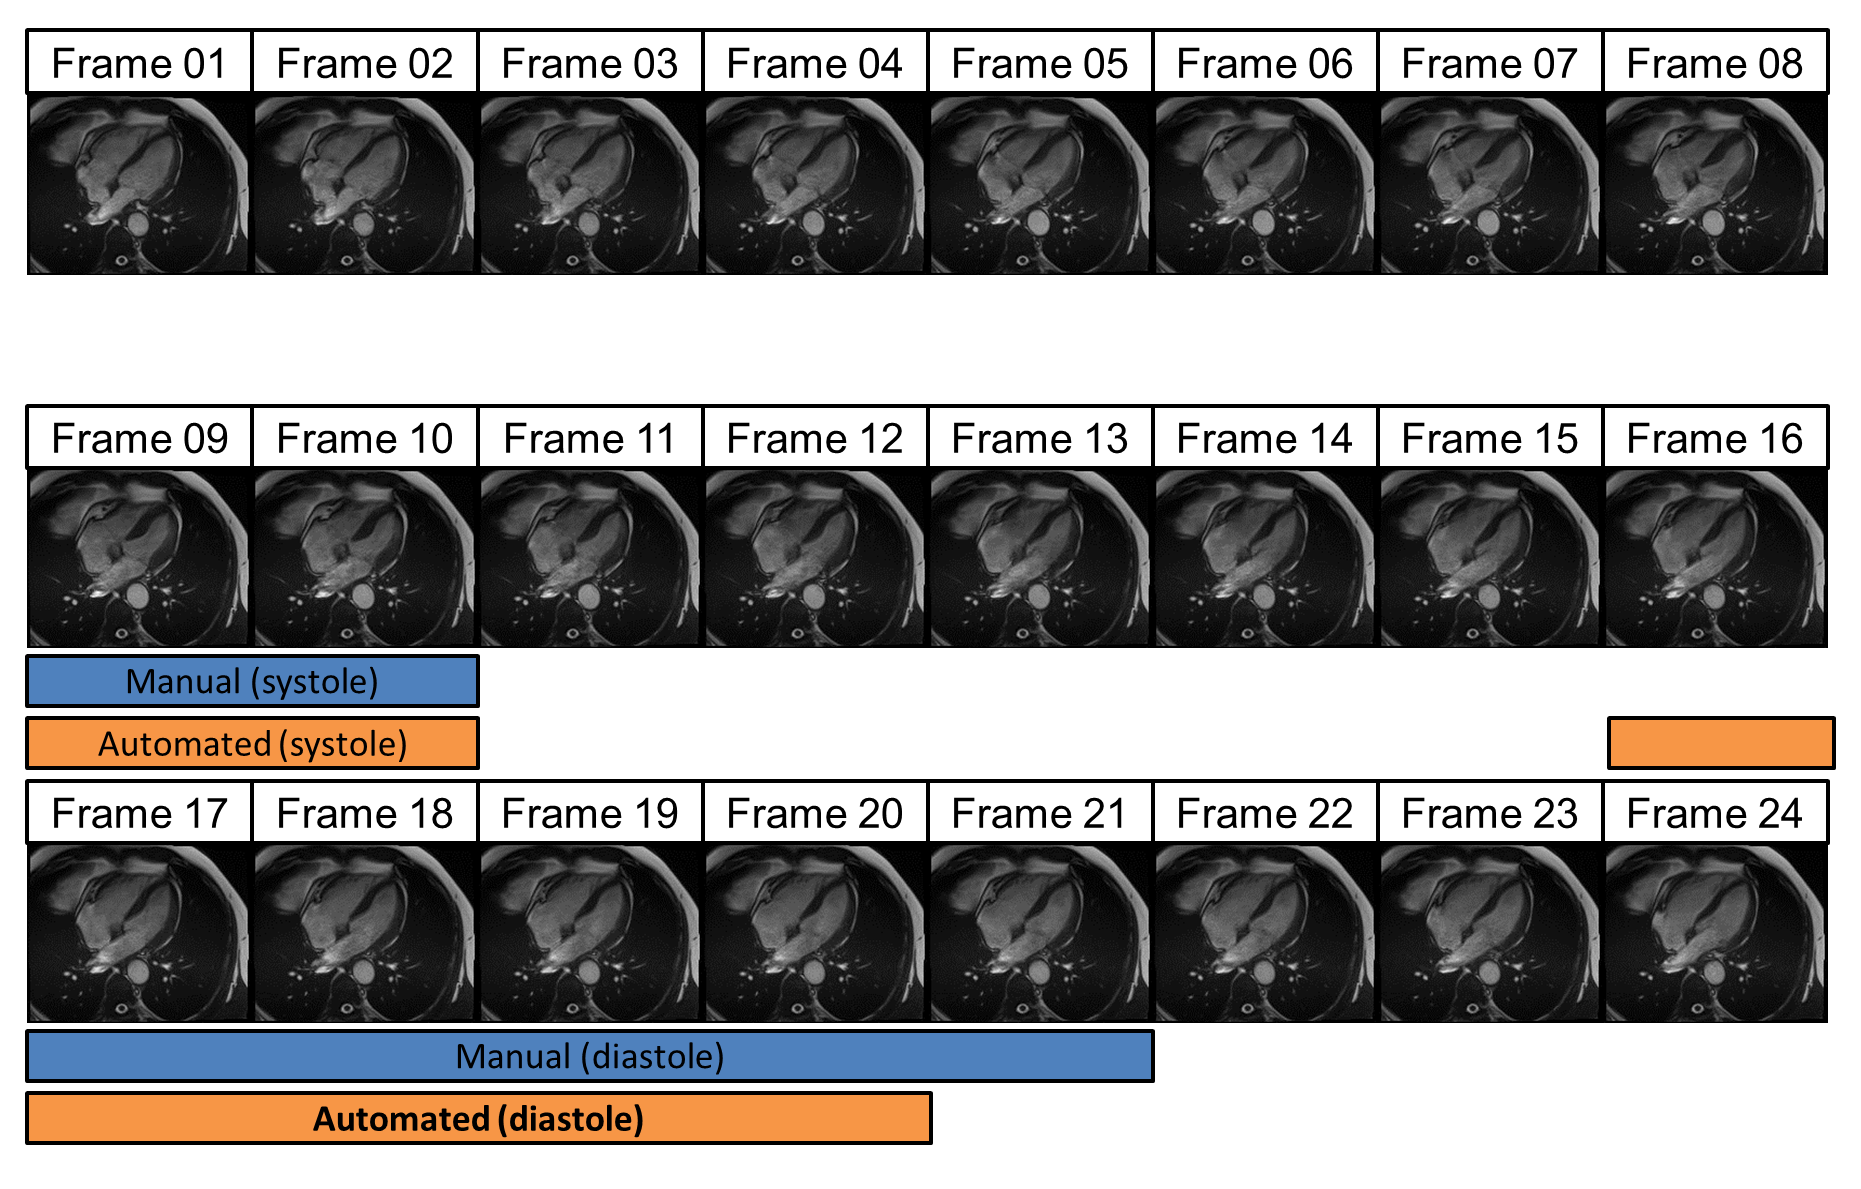
Motion curve extraction and automated selection of the frames with minimal cardiac motion in both systole and diastole was successful for all 2D cine datasets. Two examples are shown in Fig.2 and Fig.3, where the original image series is presented with the difference images and the corresponding cardiac motion curve. The optimal threshold was selected at TH=0.32 with corresponding maximum PPV=84.44% (Fig.4). The validation step resulted in sensitivity, specificity, and PPV respectively at 73.2%, 90.6%, and 81.4%. A visual comparison between automated and manual resting phase selection is shown in Fig.5.Discussion and Conclusion
The automated selection of the cardiac resting phase showed very good correspondence to the manual selection in our patient cohort. While there was no specific patient selection criterion in this study, we speculate that the threshold could be specifically optimized for different beat morphologies of different cohorts. Image quality comparison of coronary MRA acquisitions, obtained using either manual or automated acquisition window selection, will be performed in future prospective studies. An automated selection algorithm can decrease operator-dependency when performing coronary MRA acquisitions and consequently increase the ease-of-use of this imaging technique, which could potentially become available to a wider range of users.Acknowledgements
References
1. Hofman M, et al. Quantification of in-plane motion of the coronary arteries during the cardiac cycle: implications for acquisition window duration for MR flow quantification. J Magn Reson Imaging. 1998;8:568-576.
2. Wang Y, et al. Coronary MR angiography: selection of acquisition window of minimal cardiac motion with electrocardiography-triggered navigator cardiac motion prescanning. Radiology. 2001;218:580-585.
3. Jahnke C, et al. A new approach for rapid assessment of the cardiac rest period for coronary MRA. J Cardiovasc Magn Reson. 2005;7:395-399.
4. Ustun A, et al. Automated identification of minimal myocardial motion for improved image quality on MR angiography at 3T. AJR. 2007;188:W283-W290.
Figures