2860
Kinetic energy and vorticity in the pulmonary artery in pediatric patients with repaired tetralogy of Fallot using 4D flow MRIJulio Garcia1, Silvia Hidalgo Tobon2,3, Benito de Celis Alonso4, Manuel Obregon2, Porfirio Ibanez2, Julio Erdmenger2, and Pilar Dies-Suarez2
1Department of Cardiac Sciences - Stephenson Cardiac Imaging Centre, University of Calgary, Calgary, AB, Canada, 2Investigacion en Imagen y Resonancia Magnetica Nuclear, Hospital Infantil de Mexico Federico Gomez, Mexico City, Mexico, 3Physics, Universidad Autonoma Metropolitana, Mexico City, Mexico, 4Faculty of Physics and Mathematics, Benemérita Universidad Autónoma de Puebla, Puebla, Mexico
Synopsis
Flow alterations in the pulmonary artery (PA) of patients with repaired tetralogy of Fallot (rTOF) may be link with elevated kinetic energy (KE). 4D flow MRI allows for the non-invasive volumetric assessment of flow hemodynamics, vorticity, and KE in pediatric patients with rTOF in the pulmonary (PA). Thus, the aim was to investigate the impact of flow alterations in the PA and its association with KE and vorticity.
Purpose:
Flow alterations in the pulmonary artery (PA) of patients with repaired tetralogy of Fallot (rTOF) may be link with the expending of kinetic energy (KE)1. Furthermore, complex flow patterns (vortical and helical) may be associated with the energy dissipation within the PA2 and can be evaluated by the mean of flow vorticity3. Three-dimensional time-resolved phase contrast MRI (4D flow) allows for the non-invasive volumetric assessment of flow hemodynamics, vorticity, and KE in patients with rTOF in the PA. Thus, the aim was to investigate the impact of flow alterations in the PA and its association with KE and vorticity.Methods:
33 pediatric patients with rTF (age=9±3 yrs, 12 females) underwent aortic 4D flow MRI as part of an IRB-approved protocol. 4D flow MRI4 was performed at 1.5T (Philips, Achieva, Best, The Netherlands) with full 3D coverage of the thoracic aorta and PA (spatial resolution=2.5×2.1×3.2 mm3; temporal resolution=40-50 ms) using prospective PPU and respiratory navigator gating. Pulse sequence parameters were as follows: 1.5 T scan parameters ranged from TE/TR=2.3–3.4/4.8–6.6 ms, flip angle α=15°, Venc= 1.5-5 m/s, and a field of view of 340–400×200–300 mm. 4D flow dataset pre-processing5 include: eddy-current correction, flow aliasing, and calculation of 3D phase contrast angiography (3D PC-MRA). A 3D segmentation of the PA was obtained from the 3D PC-MRA using a Matlab (The Mathworks, Natick, MA, USA) and was used to mask the PA velocity field and for flow pattern visualization in the PA (Fig. 1). Masked velocity field was used to calculate KE (KE=1/2×rho×v2, were rho is the blood density = 1.06 g/mL and v the velocity field), and vorticity (ω= curl (v)) (Fig. 2). Maximum intensity projections (MIP) were calculated for flow velocity, KE, and vorticity (Fig. 3). Volumetric median of KE was used to divide the evaluated cohort in two groups: 1) low KE and 2) elevated KE. Comparison between KE groups was performed by Mann-Whiteney test.Results:
Velocity, KE, and vorticity MIPs allowed to identify the regions proximal to pulmonary bifurcation presented elevated KE, and vortical flow in the dominant direction of the flow. PA volumetric mean and median KE were associated with volumetric mean vorticity, r=0.76 (p<0.001) and r=0.46 (p<0.001) respectively. When comparing low and elevated KE significant differences were found for volumetric mean KE (0.032±0.017 mJ vs. 0.049±0.019 mJ, p=0.02), median KE (0.0039±0.0015 mJ vs. 0.0129±0.0052 mJ, p<0.001), and mean vorticity (0.032±0.006 1/s vs. 0.038±0.006 1/s, p<0.010).Conclusions:
In this study, maximal and mean KE in the RPA was associated with flow hemodynamic parameters, whereas KE in the MPA and LPA were not. This observation was explain by flow distribution within the PA and the regions (proximal PA bifurcation) where elevated energy dissipation occurs. A large cohort study is needed to evaluate the clinical usefulness of KE to survey patients with rTOF.Acknowledgements
Circle Cardiovascular Imaging and MITACS (IT07679)References
1. Jeong D, Anagnostopoulos et al. J Thorac Cardiovasc Surg 2015;149:1339-47. 2. Francois CJ et al. J Cardiovasc Magn Reson 2012; 14:16. 3. Garcia J et al. J Biomech Eng 2013, 135(12),12450. 4. Markl M et al. J Magn Reson Imaging 2007; 25: 824-31. 5. Block J et al. In. 15th Sci Meet Int Soc Magn Reson Med 2007:3138.Figures
Figure
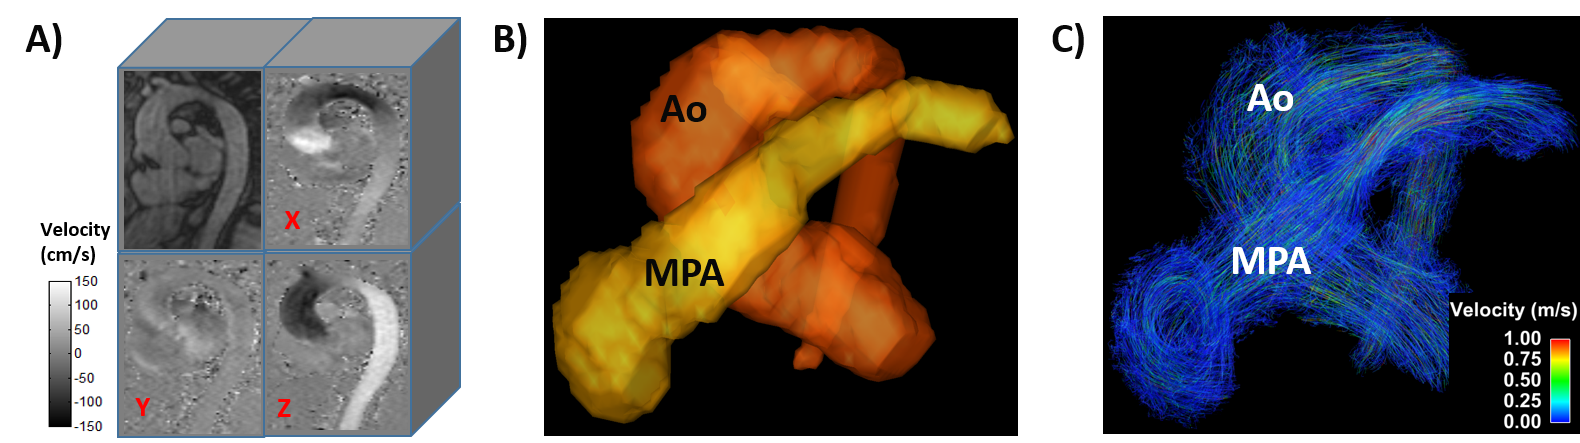
1. Data pre-processing. Panel A shows an example of acquired datasets. Panel B
shows and example of aorta and pulmonary artery segmentation. Panel C shows the pathline flow visualization from the aorta and pulmonary artery.
Figure
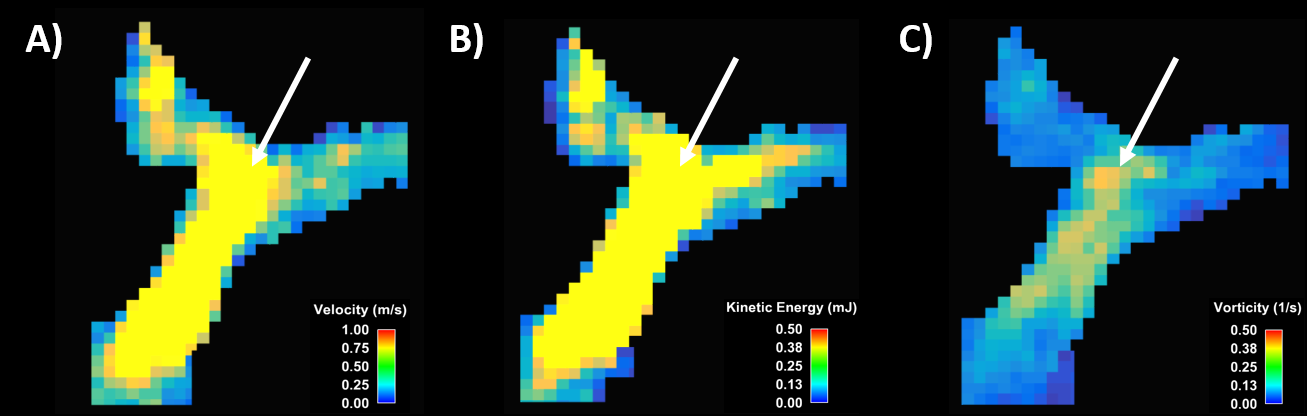
2. Example of volumetric velocity (A), kinetic energy (B) and vorticity (C) at peak systole.
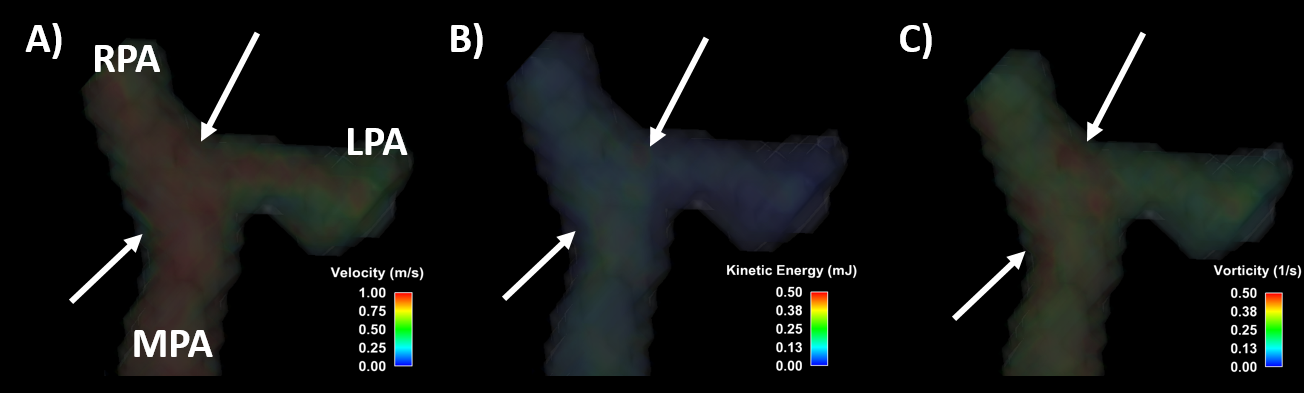
Figure
2. Example of maximum intensity projection for velocity (A), kinetic energy (B) and vorticity (C).