2858
Left Ventricle Strain Estimation using flow MRI1Biomedical Imaging Center, Pontificia Universidad Católica de Chile, Santiago, Chile, 2Department of Electrical Engineering, Pontificia Universidad Católica de Chile, Santiago, Chile, 3Department of Radiology, School of Medicine, Pontificia Universidad Católica de Chile, Santiago, Chile
Synopsis
The stiffness in the myocardium represents a reliable biomarker of cardiac dysfunction or diseases, such as atherosclerosis or cardiac infarction. Actually, there exist methods to retrieve this indicator using MRI, however, they can be very time-consuming, especially for volumetric evaluations. In this work, we propose a novel method to estimate strains using Phase-Contrast or 4D-flow data, where velocity fields are transformed into strain tensors in a numerically simple but robust manner. Preliminary results are promising and we expect to validate our method in volunteers and patients.
Introduction
The stiffness in the myocardium is a good indicator of cardiac diseases, such as atherosclerosis or cardiac infarction. In general, a good qualitative pointer of stiffness are the deformations in cardiac muscle, since small deformations are associated with high values of rigidity and vice-versa. Using MR images, this information can be retrieved using acquisition techniques such as tagging1 or DENSE2. However, for volumetric analysis, these methods are time-consuming. The goal of this work is to introduce a simple but efficient manner to estimate deformation indicators using flow images.Methods
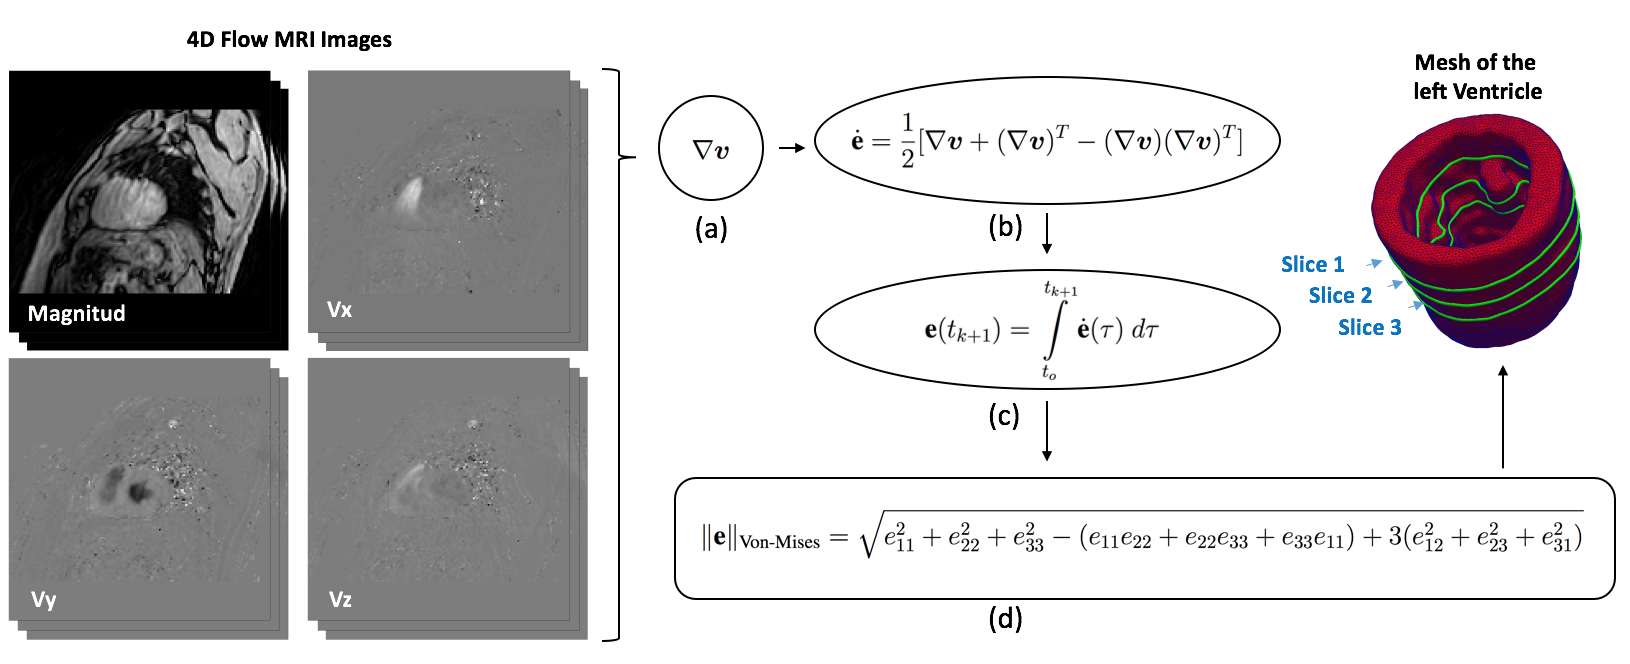
In order to estimate the state of deformations in the myocardium, we need to know with precision the displacement gradients. To this end, velocity images are used to evaluate velocity gradients on the image and then, to integrate over the time variable to recover the strain tensor.Velocity gradients cannot be simply calculated using standard numerical derivation due to images with low signal-to-noise ratio. To tackle this issue, we use the weighted regression method3, obtaining remarkable results with high levels of noise. The Euler-Almansi strain tensor ($$$\textbf{e}$$$) is used to represent large deformations, discarding rigid body motions. The time derivative of $$$\textbf{e}$$$ is defined as
$$\dot{\textbf{e}}=\frac{1}{2}(\nabla\boldsymbol{v} + \nabla\boldsymbol{v}^T - (\nabla\boldsymbol{v})(\nabla\boldsymbol{v})^T),$$
where $$$\boldsymbol{v}$$$ represents the velocity of the body over a certain voxel. Time integration was carried out with the trapezoidal rule to estimate $$$\textbf{e}$$$. High order numerical integration will pollute the solution, considering the poor temporal resolution. Hence, the relation between $$$\dot{textbf{e}}$$$ and $$$\textbf{e}$$$ yields
$$\textbf{e}(t_{k+1})=\int\limits_{t_0}^{t_{k+1}}\dot{\textbf{e}}(\tau)~d\tau \approx \frac{1}{2} \sum\limits_{j=0}^{k+1}(t_{j+1}-t_j)(\dot{\textbf{e}}(t_{j+1}) + \dot{\textbf{e}}(t_j)).$$
Despite gradient and time integration operators can commute in differential calculus, numerically does not occur. The weighted regression gradient can filter noisy data, been more beneficial if it is applied before the integration over the time-domain.
Results and Discussion
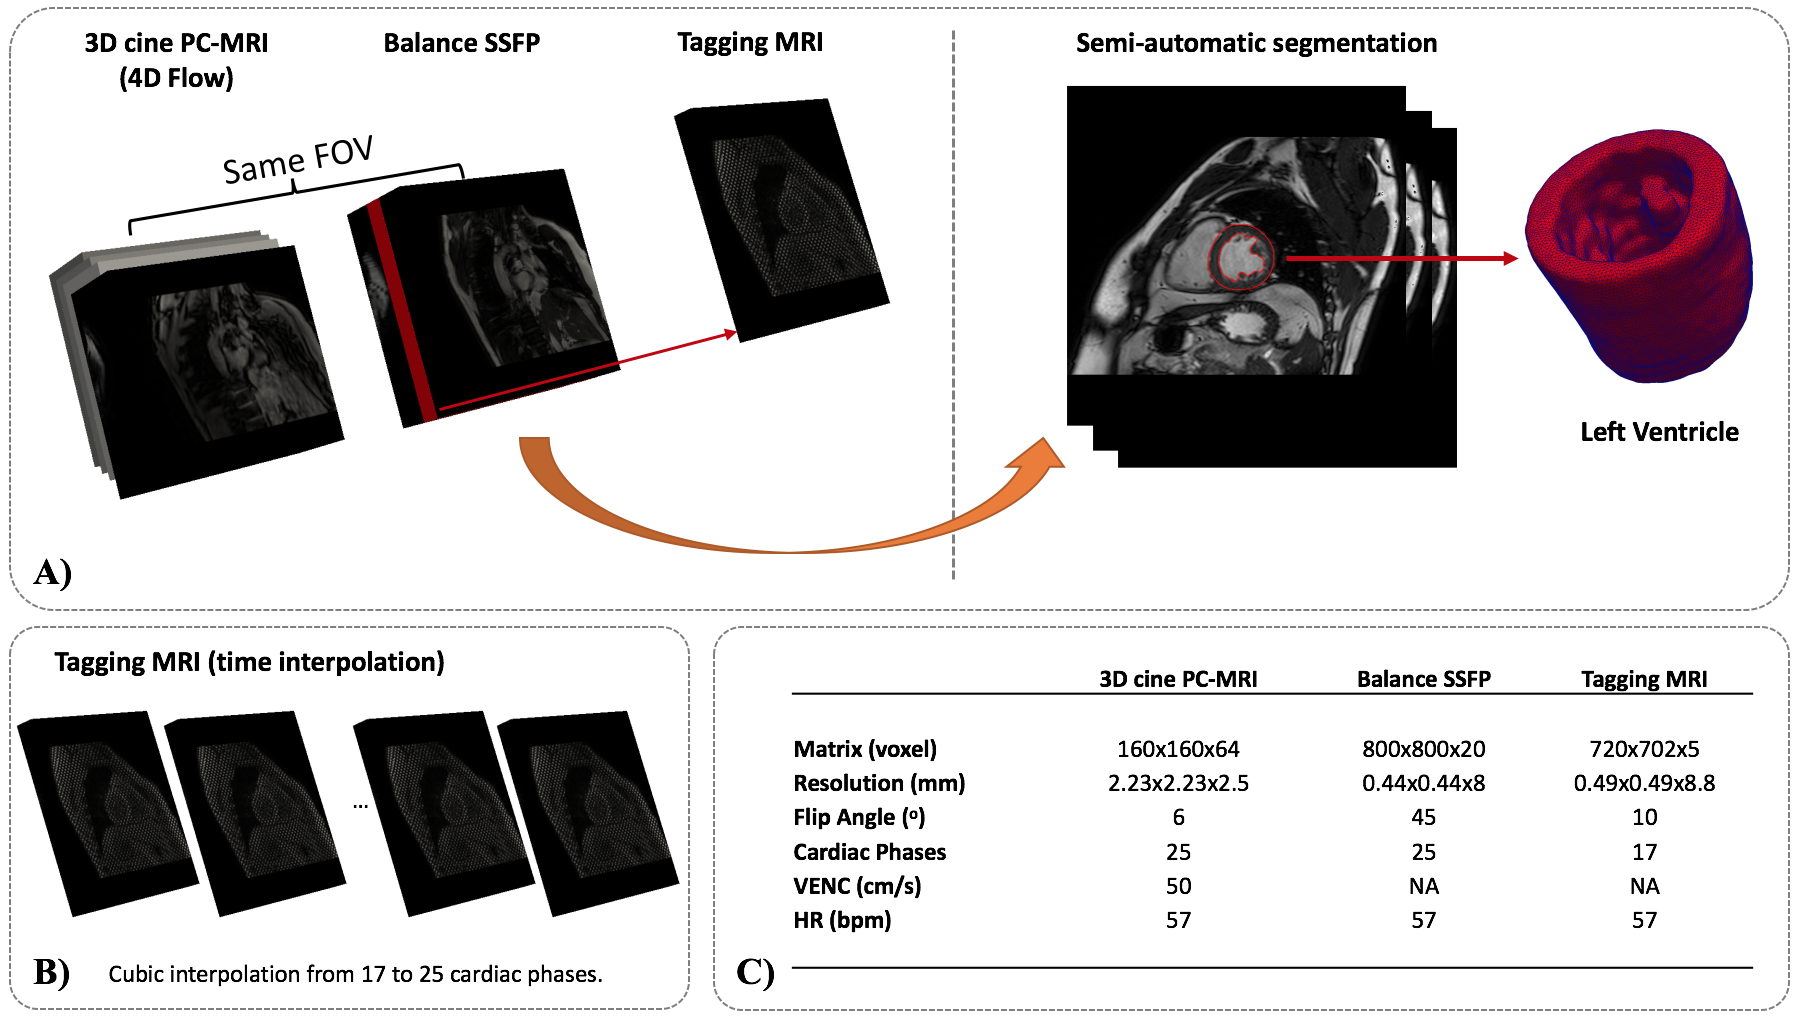
As a preliminary result, 4D-flow data of one healthy volunteer with 25 cardiac phases and a voxel resolution of 2.32x2.32x2.5 mm was acquired in a Clinical 3T Philips Ingenia scanner. All the numerical calculations were performed in Matlab software.
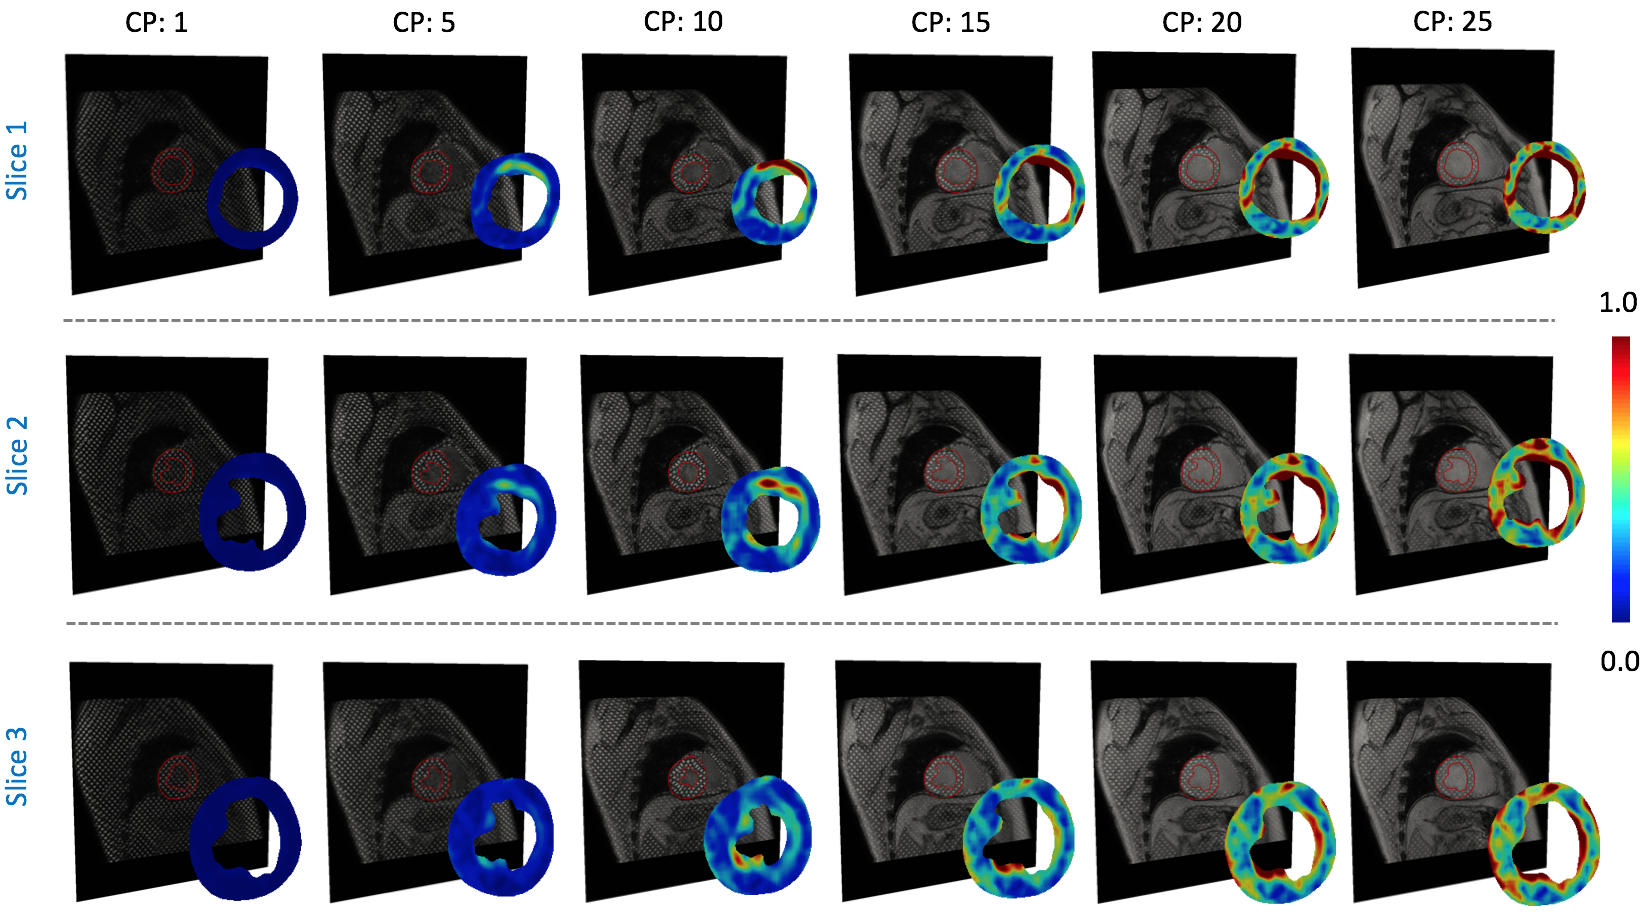
The figures 1 and 2 shows the steps of the segmentation process and the flow work of the mathematical and numerical implementation. The figure 3 show a qualitative comparison between the estimated Von-Mises strain indicator and the tagging acquisition for six cardiac phases. As can be appreciated, our results represents reasonably the deformations of the myocardium, but they have high noise level at the exterior walls. This last behavior is because the meshes obtained after the segmentation process does not couples perfectly with the velocity data, allowing interpolations of values that not represent the cinematic of the cardiac muscle.
Conclusion
We present an efficient method that can be easily implemented to estimate strains in the myocardium. Even though our first results were in a good agreement with tagging MRI data, but further validations in volunteers as well as in patients with myocardial dysfunction are required.Acknowledgements
We thanks to CONICYT - PIA - Anillo ACT1416, CONICYT FONDEF/I Concurso IDeA en dos etapas ID15|10284, and FONDECYT #1141036 grants. Sotelo J. thanks to the School of Engineering, Pontificia Universidad Catolica de Chile, for his Post-Doctoral Fellow.References
1. Reichek, N. (1999), MRI myocardial tagging. J. Magn. Reson. Imaging, 10: 609–616. doi:10.1002/(SICI)1522-2586(199911)10:5<609::AID-JMRI4>3.0.CO;2-2.
2. Kuijer, J. P.A., Hofman, M. B.M., Zwanenburg, J. J.M., Marcus, J. T., van Rossum, A. C. and Heethaar, Rob. M. (2006), DENSE and HARP: Two views on the same technique of phase-based strain imaging. J. Magn. Reson. Imaging, 24: 1432–1438. doi:10.1002/jmri.20749.
3. Correa, C., Hero R. and Ma K-L (2011). A Comparison of Gradient Estimation Methods for Volume Rendering on Unstructured Meshes. IEEE Trans. Visualization and Computer Graphics, 17(3):305-319. doi:10.1109/TVCG.2009.105.
Figures