2853
Phase Contrast MRI with Automatic Inline Second Order Background Phase Correction1Cardiovascular MR R&D, Siemens Healthineers, Chicago, IL, United States, 2Pediatric Cardiology, Emory University School of Medicine, Children's Healthcare of Atlanta, Atlanta, GA, United States, 3Cardiovascular Imaging Research Core, Children's Healthcare of Atlanta, Atlanta, GA, United States, 4Medical Imaging Technologies, Siemens Medical Solutions USA, Inc., Princeton, NJ, United States, 5Cardiovascular MR R&D, Siemens Healthineers, Erlangen, Germany
Synopsis
This work presents an automatic inline method for correction of background phase errors in 2D PC MRI. Flow images were automatically processed during image reconstruction for background phase correction. Uncorrected and corrected images were compared qualitatively and quantitatively. Quantitative flow measurements were performed by two experienced observers using a fully-manual method and a semi-automated method. Mean Qp/Qs of the patient cohort was used as a metric to evaluate the proposed second order background phase correction method.
Introduction
Typically, MR flow measurements require loading 2D PC MRI data into a post-processing application to perform background phase correction and quantitative flow analysis. In previous work1 we presented an automatic inline method for performing first-order background phase correction, automatic segmentation of vessels, automatic data analysis, and DICOM results visualized directly at the scanner. Our new method expands upon previous work by performing second order background phase correction.Materials and Methods
1) Acquisition: Data were acquired on a 1.5T scanner (MAGNETOM Avanto-Fit, Siemens Healthcare, Erlangen, DE) in nine pediatric patients without flow shunts as demonstrated by echocardiography. Using a prototype 2D PC MRI sequence, two acquisition planes were defined for each patient: perpendicular to the aortic root (AO) at the level of the sino-tubular junction, and perpendicular to the main pulmonary artery (MPA) above the valve plane, both scanned at isocenter with appropriate FOV to avoid phase wrap.
2) Inline processing: An inline flow processing prototype was integrated into the MR scanner’s image reconstruction software. In previous work1 inline processing was fully automatic and included static tissue detection, correction of background phase errors, dynamic vessel segmentation, comprehensive flow quantification, and DICOM results. A second order correction was applied in this work. A correction map was calculated as a second order fit to the image pixels having a 1 in a binary mask of detected stationary tissues (static mask). The correction map was automatically subtracted from the uncorrected image to derive the corrected image. Figure 1 shows color-scaled static tissue maps and background phase maps (uncorrected vs. corrected) which provide a visual validation of the performance of the second order background phase correction algorithm.
3) Manual processing: Two experienced observers used a commercially available flow analysis tool (ARGUS, Siemens Healthcare, Erlangen, DE) to manually measure AO and MPA stroke volumes, and one experienced observer used a prototype flow analysis tool (FLOWUI) to semi-automatically measure AO and MPA stroke volumes. Whereas ARGUS requires the user to manually draw all vessel contours, FLOWUI features single-click vessel segmentation by placing a seed at the center of the vessel as described in previous work2,3,4.
Results
The automatic inline static tissue detection and second order background phase correction was successful in 17/18 vessels (Figure 1). The vessel contours of the ARGUS fully-manual vessel segmentation and FLOWUI semi-automated vessel segmentation were generally in close agreement, but in some cases of complex flow patterns they differed significantly (Figure 2). With ARGUS the Qp/Qs values were 1.04 for uncorrected data and 1.05 for corrected data, both with similar standard deviations (Figure 3a). With FLOWUI the Qp/Qs values were 1.09 for uncorrected data and 1.11 for corrected data, both with similar standard deviations (Figure 3b).Discussion
Mean Qp/Qs was used as a metric to evaluate the effectiveness of the proposed second order background phase correction method. For patients without flow shunts or collateral circulation the mean Qp/Qs is generally considered to be 1.05 due to the exclusion of coronary arterial blood flow5. Figure 3a shows that using a fully-manual flow analysis method (ARGUS) the mean uncorrected Qp/Qs is 1.04/0.035 (mean/std), which closely matches the expected value. After correction the mean Qp/Qs is 1.05/0.049 (mean/std), which also closely matches the expected value. Fully-manual segmentation ensures that vessel lumen contours are drawn accurately, and our inter-observer variation was minimal. Although the color-scaled phase maps in Figure 1 demonstrate an obvious post-correction improvement in the spatial homogeneity of the background phase, particularly near the edges of the FOV, there were insignificant differences in mean Qp/Qs and standard deviation measurements post-correction. This is suggestive that the background phase error contributed insignificantly to the Qp/Qs measurements, likely because the AO and MPA are located near the center of the FOV where the error is minimal.Conclusion
An automatic inline method for correction of background phase errors in Phase-Contrast MRI data is presented. Although the second order correction method significantly improved the homogeneity of the background phase as demonstrated by color-scaled phase maps, the mean Qp/Qs was very accurate with both methods, likely because the AO and MPA are located near the center of the FOV where the error is minimal. Future work to evaluate the proposed correction algorithm should include flow evaluations in vessels at various locations away from the central FOV as well as in vessels with turbulent and disorganized flow.Acknowledgements
No acknowledgement found.References
1. Gulsun et.al., ISMRM 2015 2. Gulsun et. al., MICCAI Workshop 2006 3. Goldberg, et. al., JACM 1988; 35(4):921–940 4. Guetter et. al., ISBI, 2011 5. Chernobelsky et.al., Journal of Cardiovascular Magnetic Resonance (2007) 9, 681–68Figures
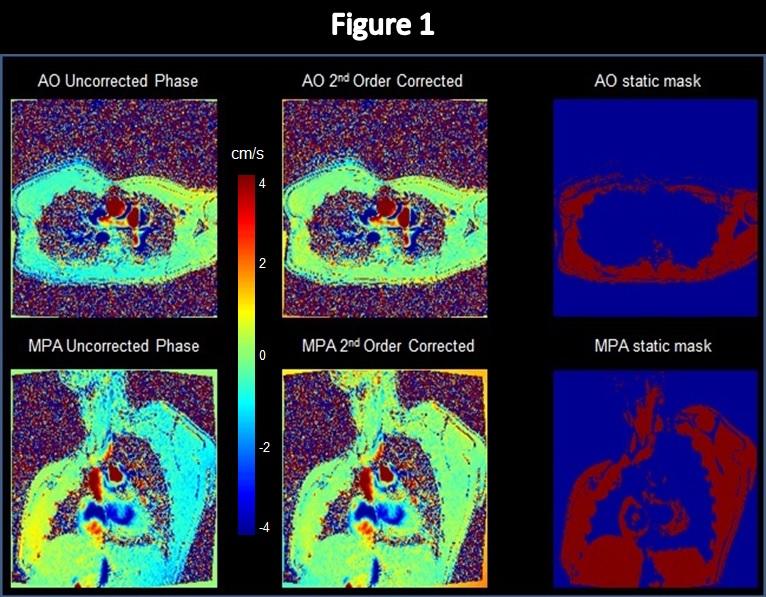
Figure 1: Color-scaled maps of the AO and MPA from inline processing show the uncorrected phase images, the 2nd order corrected phase images, and the static tissue masks. Uncorrected images show typical spatially distributed background phase errors, whereas corrected images demonstrate nearly homogeneous zero background phase in static tissue across the entire image. Static tissue masks show the pixels from which the 2nd order correction was calculated. A full non-wrapped FOV was acquired such that the entire chest was included in the static tissue mask.
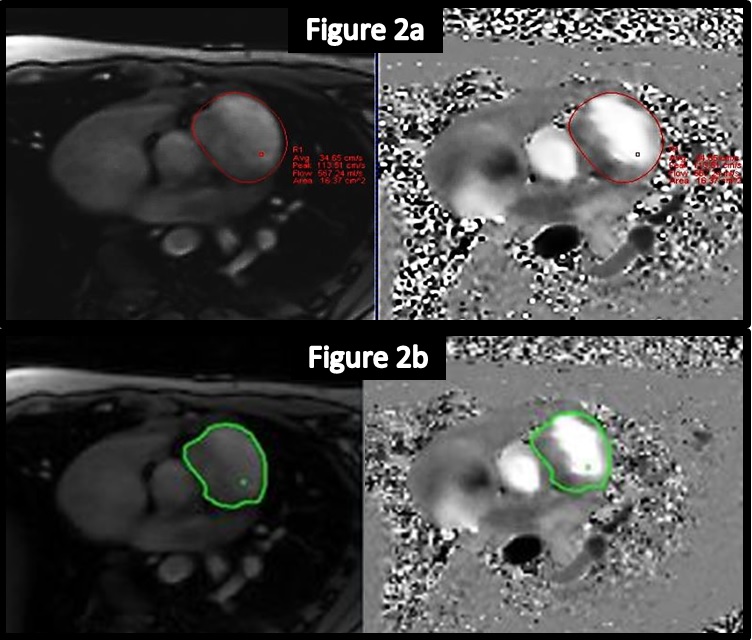
Figure 2: Two methods of vessel segmentation.
ARGUS fully-manual segmentation of the vessel lumens (red contours)
FLOWUI semi-automated segmentation of the vessel lumens (green contours)
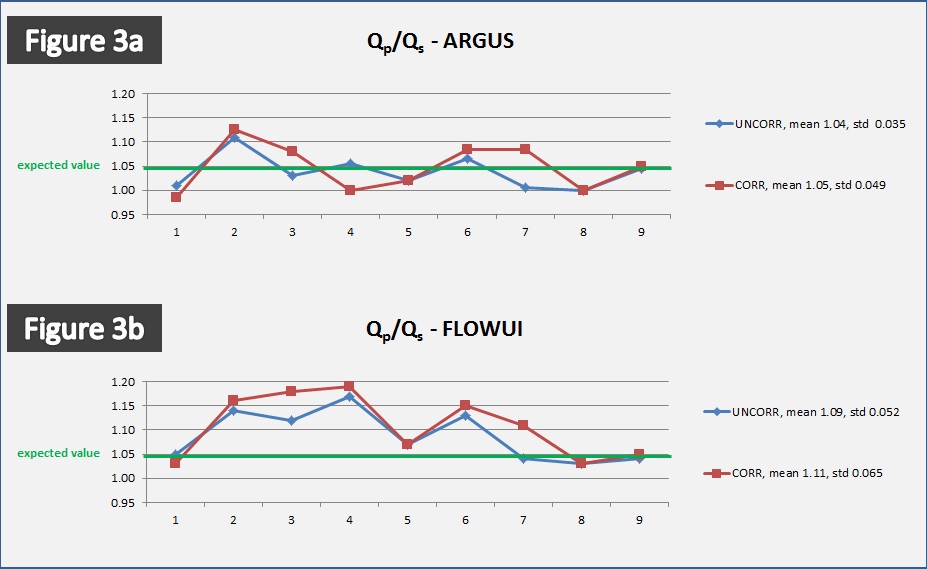
Figure 3: (a) With ARGUS fully-manual analysis the Qp/Qs values were 1.04/0.035 (mean/std) for uncorrected data and 1.05/0.049 (mean/std) for corrected data. (b) With FLOWUI semi-automated analysis the Qp/Qs values were 1.09/0.052 (mean/std) for uncorrected data and 1.11/0.065 (mean/std) for corrected data.