2850
The Magnitude of Static Phantom Corrections for Velocity Encoded Phase Contrast Cine MRI and Clinical Importance1National Heart, Lung, and Blood Institute, National Institutes of Health, Bethesda, MD, United States, 2Physiology Department, Northwestern University, Chicago, IL, United States, 3Computational Neuroscience, IBM / Thomas J Watson Center, Yorktown Heights, NY, 4Cardiology and Radiology, Hofstra Northwell School of Medicine, Manhasset, NY, United States
Synopsis
The purpose of this study was to investigate the magnitude of ex vivo static phantom corrections affecting Qp, Qs, and the Qp-to-Qs ratio measurements in diagnosing patients with intracardiac shunts. In the patients with Cath as the reference standard, phantom correction improved both the bias as well as the limits of agreement for Qp and the Qp:Qs ratio. For Qs, phantom correction improved the bias but did not significantly change the limits of agreement. While phantom correction appears to improve phase contrast MRI measurements, the main benefit is limited to patients with Qp:Qs close to the important diagnostic threshold selected.
Purpose
Velocity encoded phase contrast MR cine imaging is subject to eddy-current induced offset errors and concomitant gradient terms which result in non-zero measurements of static tissue and create offsets when measuring pulmonary (Qp) and systemic flow (Qs).1 The purpose of this study was to investigate the magnitude of ex vivo static phantom corrections affecting Qp, Qs, and the Qp-to-Qs ratio (Qp:Qs) measurements in diagnosing patients with intracardiac shunts.Methods
179 patients were studied on either a 1.5T or 3T Siemens scanner on IRB approved research protocols. 16 out of the 179 patients had Qp, Qs, and Qp:Qs ratio measured by cardiac catheterization (Cath). All patients had CMR Qp, Qs, and the Qp:Qs ratio measured. A static phantom was imaged with identical acquisition parameters and imaging planes to estimate zero velocity. Results are mean ±SD or median [interquartile range]. Bland-Altman statistics were used to compare various measurements.Results
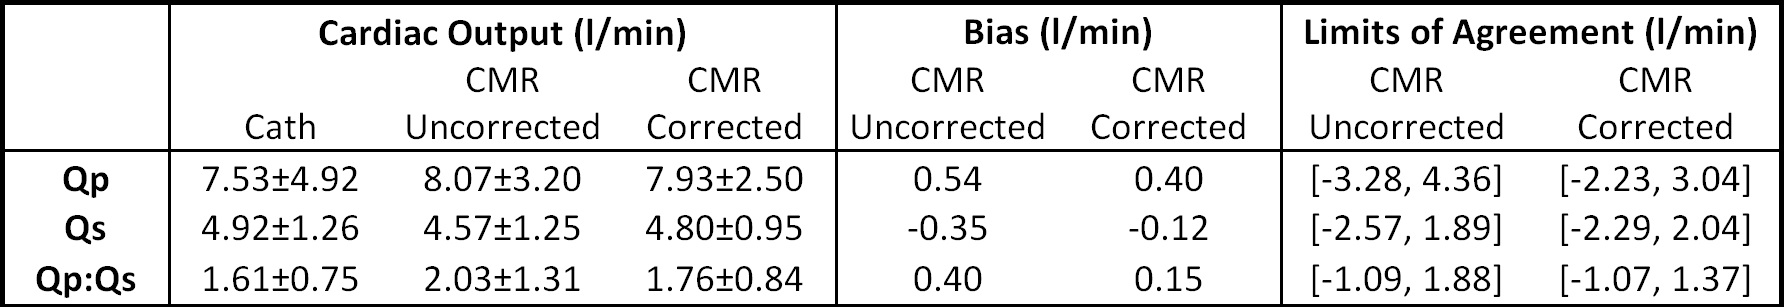
In the patients with Cath as the reference standard, phantom correction improved both the bias as well as the limits of agreement for Qp and the Qp:Qs ratio (Table 1). For Qs, phantom correction improved the bias but did not significantly change the limits of agreement (Table 1).
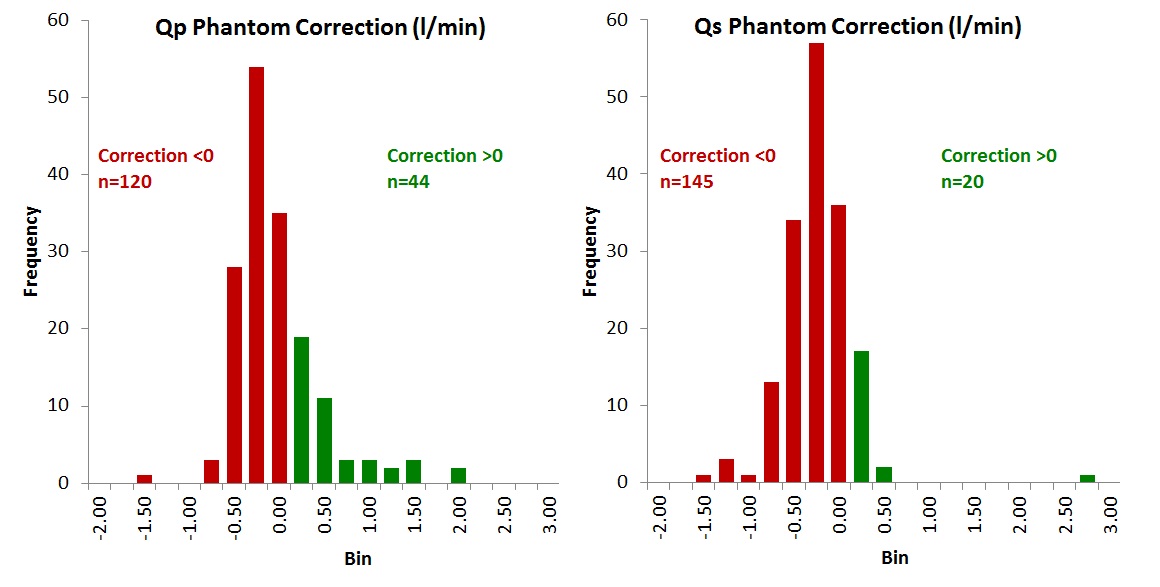
For the entire cohort of patients, the median uncorrected CMR Qs was 4.5 L/min [4.0, 5.5] and was significantly less than the corrected CMR Qs 5.0 l/min [4.3, 5.9] (p<0.001). The median uncorrected CMR Qp was 5.3 L/min [4.5, 6.7] and was significantly less than the corrected CMR Qp 5.5 l/min [4.7, 6.8] (p<0.001). The median phantom correction for Qs was -0.38 l/min [-0.57, -0.16] and was larger than the correction for Qp -0.27 l/min [-0.46, 0.02] (p<0.001). The median percent correction for Qs was -8.1% [-12.3, -3.7] and was greater than the median percent correction for Qp -4.8 [-8.4, 0.48] (p<0.001). However the phantom corrections were as large as 49.7% for Qs and 47.2% for Qp. Negative phantom corrections were more common than positive corrections for both Qs (145 vs 20) and Qp (120 vs 44, Figure 1).
Clinical significance was assessed in the entire cohort as the number of patients re-categorized as having shunts requiring surgical correction using two commonly used thresholds for the Qp:Qs ratio (1.5 and 2.0). Thirteen patients had an uncorrected Qp:Qs ratio between 1.5 and 2.0, and 7 of these patients (53.8%) were re-classified to a non-surgical shunt fraction (i.e. <1.5) as a result of the phantom correction. Fourteen patients had an initial Qp:Qs ratio >2.0, and phantom correction reclassified 3 patients to shunt fractions between 1.5 and 2.0 (21.4%) but none were re-classified to <1.5. Conversely, none of the 138 patients with an uncorrected Qp:Qs ratio <1.5 were re-classified to a shunt fraction >1.5 after phantom correction.
Of the 27 patients with an uncorrected Qp:Qs >1.5, four patients did not have an anatomic intracardiac shunt. After phantom correction, all 20 patients with a Qp:Qs >1.5 had an identifiable anatomic intracardiac shunt. The phantom correction also successfully reclassified those 4 patients that had no anatomic intracardiac shunt to a Qp:Qs ratio <1.5.
Discussion
Factors favoring implementation of phantom corrections include the following: The magnitude of phantom correction was large relative to cardiac output in some patients. Phantom correction improved bias and limits of agreement with Cath as a reference standard. Phantom correction eliminated the misclassification of 4 patients who had no identifiable intracardiac shunt.
Factors against phantom correction include the following: Out of 165 patients, phantom correction only re-classified 3 patients at an uncorrected Qp:Qs threshold of 2.0 and 7 patients at a threshold of 1.5. No patient that had an uncorrected Qp:Qs ratio <1.5 were up-classified to a surgically significant shunt. The phantom correction process increases scanner time as well as the time to process and analyze studies. These extra steps appear to be of limited benefit in the patients that were below a Qp:Qs ratio of <1.5 who were being assessed for shunt fraction.
Conclusion
While phantom correction appears to improve phase contrast MRI measurements, the main benefit is limited to patients with Qp:Qs close to the important diagnostic threshold selected. As the phantom correction appears to increase the quality of velocity encoded phase contrast cine MR measurements, additional analysis in the value of phantom corrections for valvular disease is warranted.Acknowledgements
This work was funded by DHHS, National Institutes of Health.References
1. Lankhaar J-W, Hofman MBM, Marcus JT, et al. Correction of phase offset errors in main pulmonary artery flow quantification. J Magn Reson Imaging 2005;22:73–79.Figures