2849
Quantification of cerebrospinal fluid flow through the cerebral aqueduct using 7T MRI1Department of Radiology, University Medical Center Utrecht, Utrecht, Netherlands, 2Spinoza Center for Neuroimaging, Amsterdam, Netherlands, 3Department of Radiology, Vanderbilt University Medical Center, Nashville, TN, United States
Synopsis
In this work the feasibility of recording high spatial resolution quantitative flow (Qflow) measurements in the cerebral aqueduct at 7T was investigated. Five volunteers were scanned, two encoding velocities (venc) were used: 5 and 13 cm/s. Repeated measurements were performed (venc=5cm/s: n=4; venc=13 cm/s: n=5). Mean net CSF flow through the aqueduct (directed towards the spine) was (mean±std) 332±128 ml/day for venc=5cm/s and 441±149 ml/day for venc=13cm/s, which is in accordance with values found in literature. Reasonable reproducibility of the measurements was found.
Purpose
Cerebrospinal fluid (CSF) plays an important role in the clearance system of the brain and in maintaining homeostasis. With aging, CSF production declines1, which may contribute to age-related cognitive decline. As such, non-invasive measurements of CSF production in combination with advanced brain imaging may provide a novel tool to study the role of CSF changes in aging. The net flow through the aqueduct of Sylvius is a measure for the CSF production in the lateral ventricles. Due to the small diameter of the aqueduct (approximately 2 mm), high spatial resolution velocity imaging is needed for accurate measurements of the net CSF flow. Additionally, the net flow is an order of magnitude lower than the pulsatile fluctuations of the flow over the cardiac cycle.
This work evaluates the feasibility of high resolution CSF flow measurements at 7T. High resolution quantitative flow (Qflow) measurements were performed using two encoding velocities (venc).
Methods
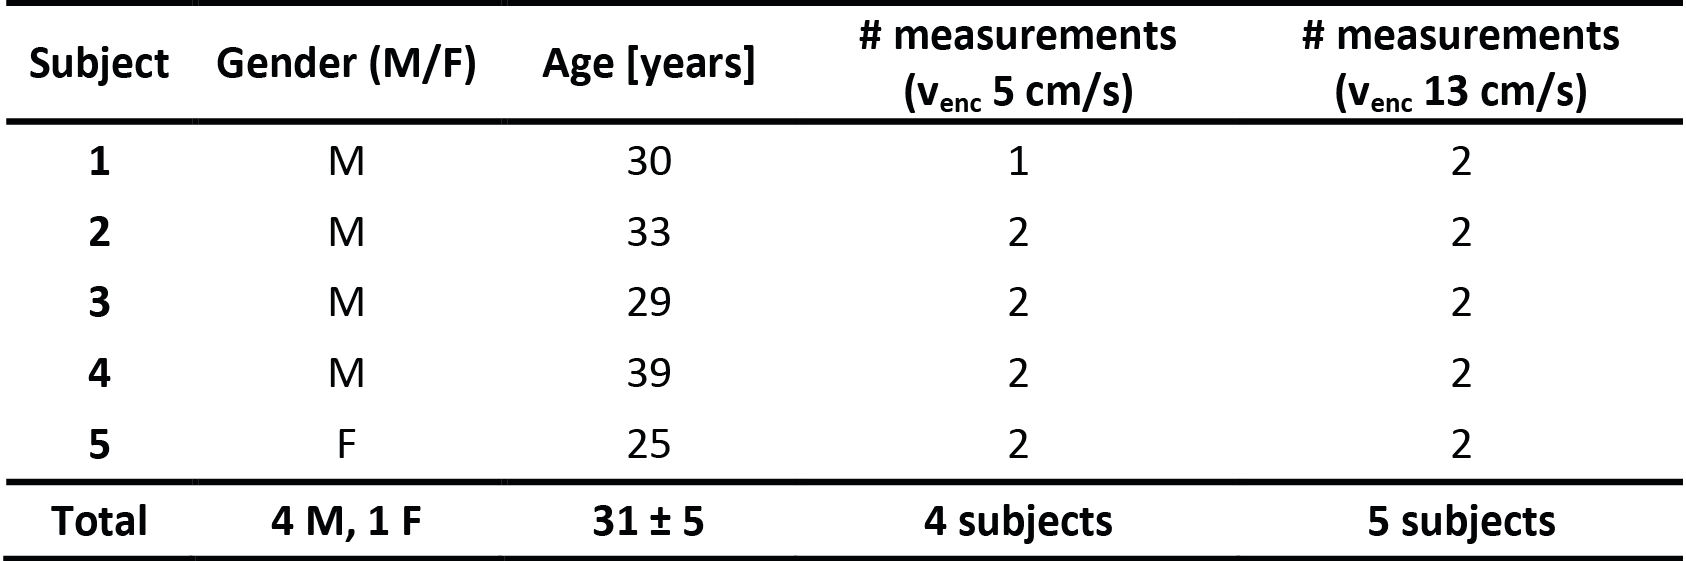
Five volunteers were scanned at 7T (Philips Healthcare) with a 32ch receive head coil and volume transmit coil (Nova Medical). Table 1 summarizes subject characteristics.
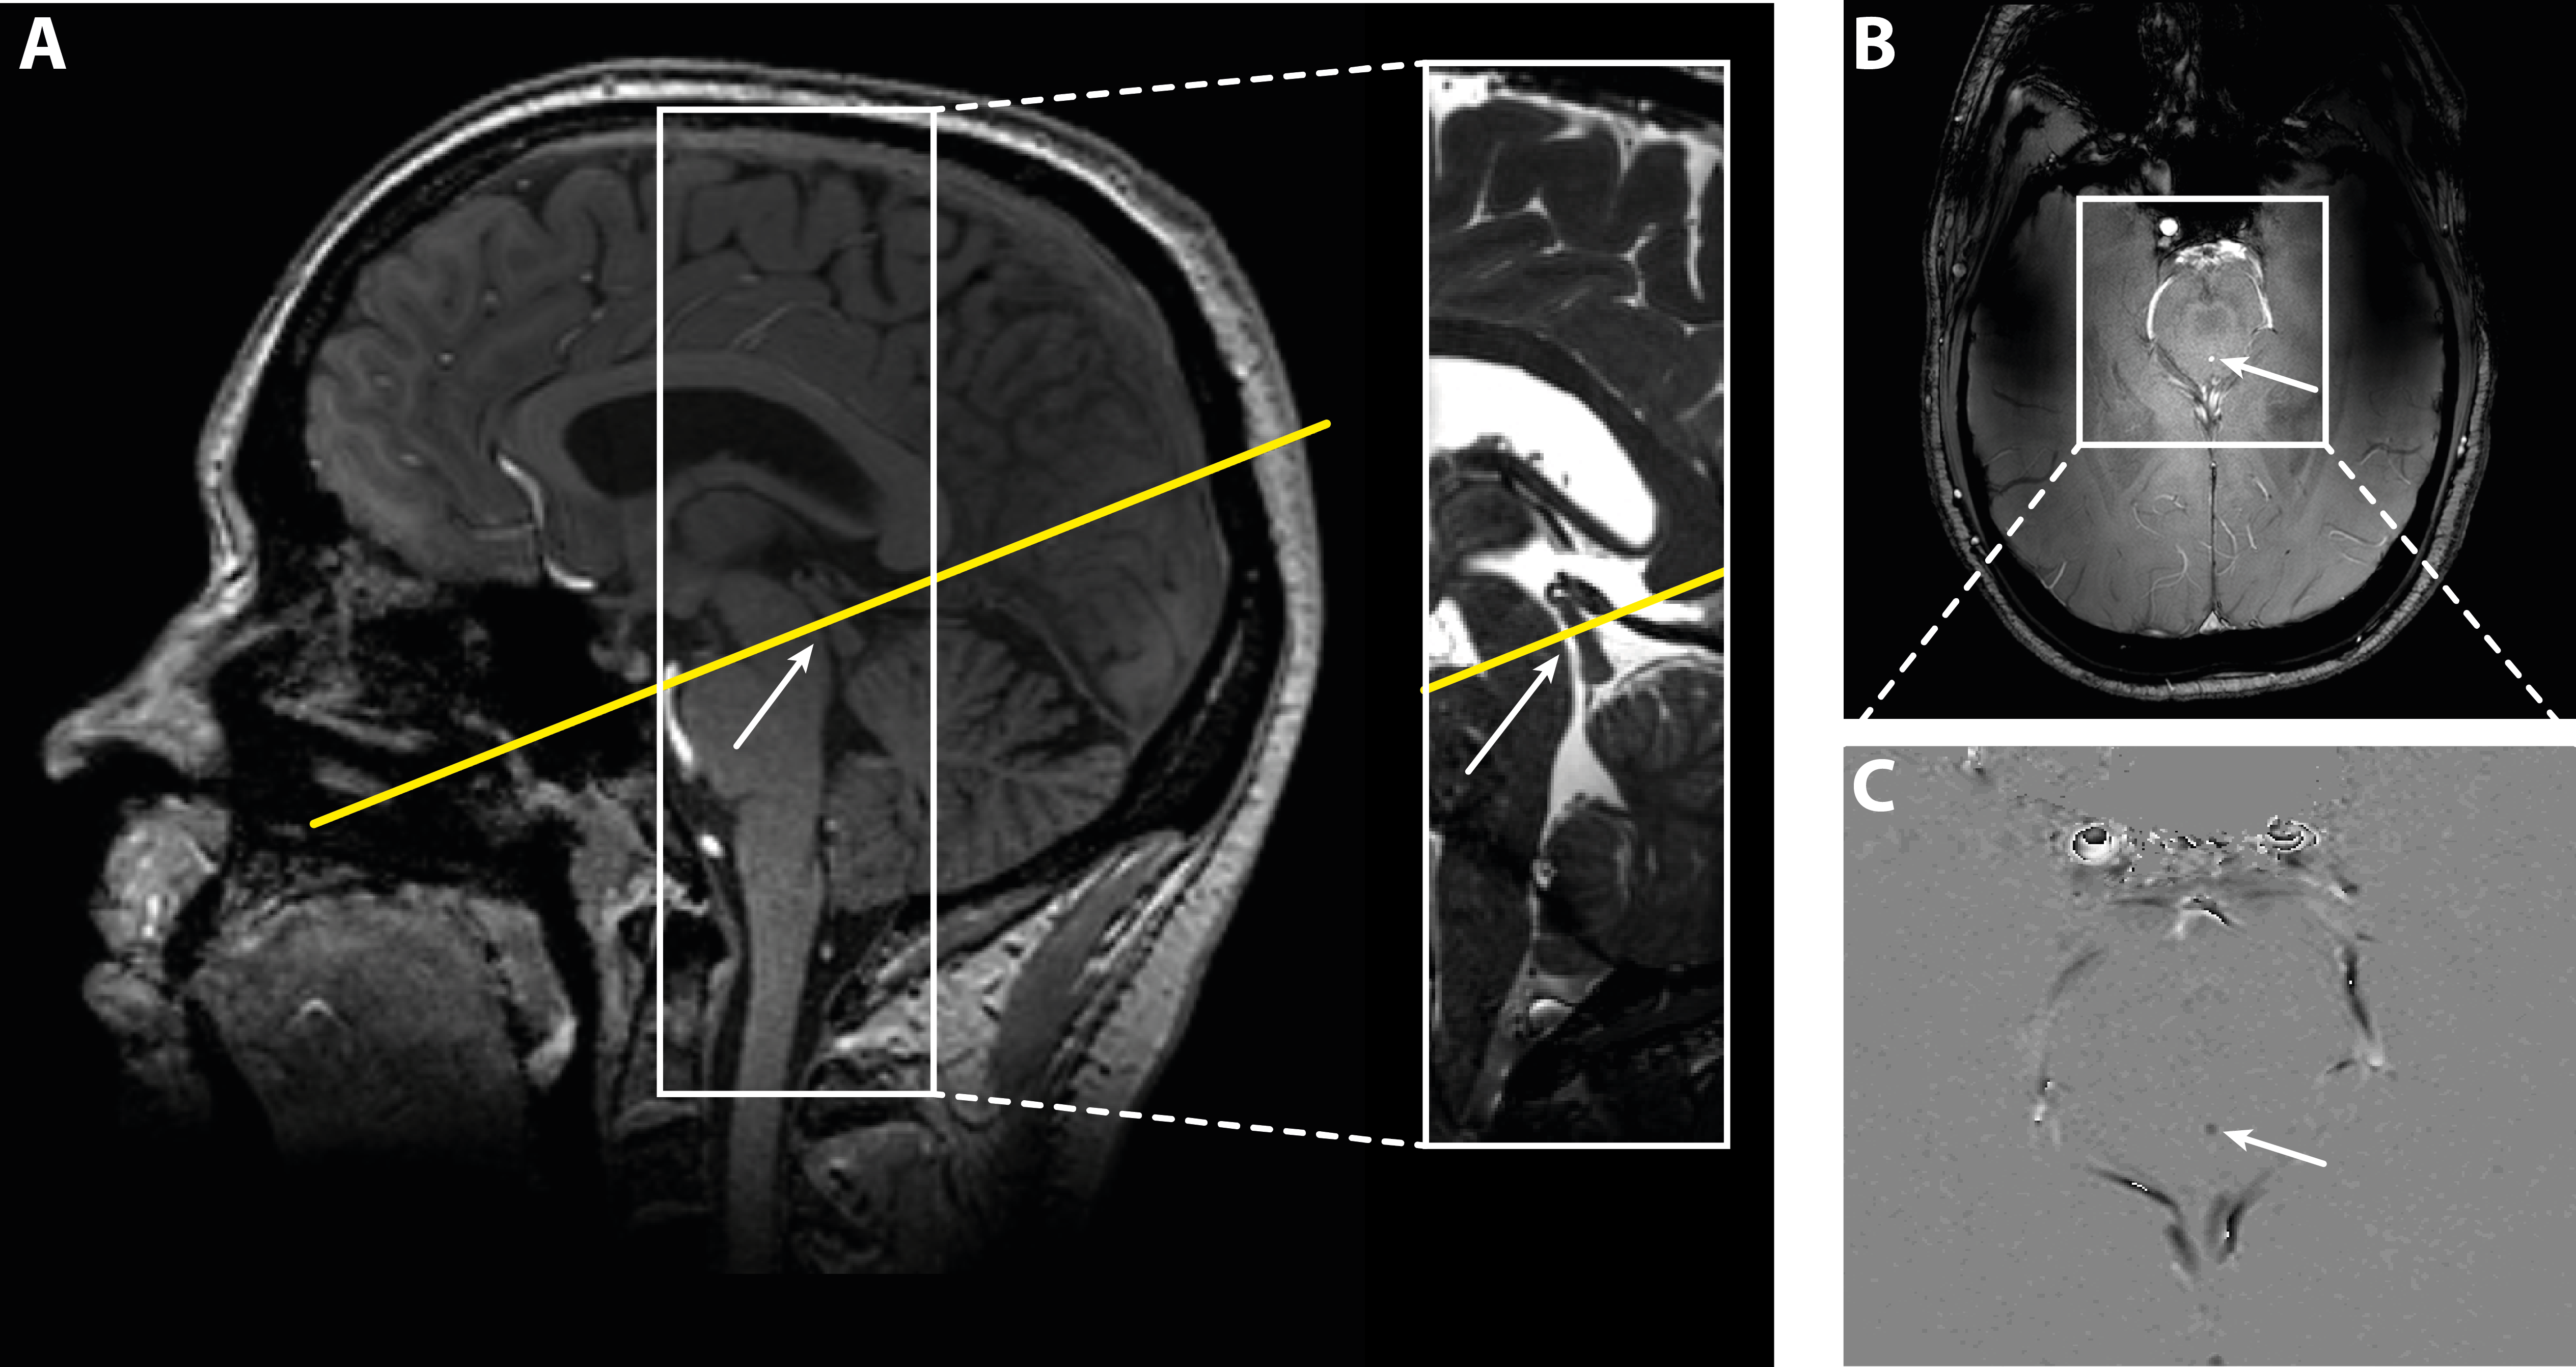
2D-Qflow measurements were performed in the cerebral aqueduct. Two encoding velocities were used: 5 cm/s and 13 cm/s. A single slice was acquired, with resolution 0.5x0.5x4 mm3 reconstructed to 0.25x0.25x4 mm3, FOV 200x200x4 mm3, and 30 frames per cardiac cycle. Scan durations were between 2:47 - 3:39 min (depending on heart rate). In one volunteer in one scan (venc 13 cm/s) accidentally a lower resolution was used: 0.6x0.8x4 mm3, reconstructed to 0.57x0.57x4 mm3 (scan duration 1:47 min). Figure 1 shows the 2D-Qflow slice planning for one volunteer. Reproducibility of the flow measurements was determined by repeating the flow measurements for both vencs.
Background correction was performed with a method previously developed for blood flow velocity quantification in small perforating arteries2. Mean background phase was removed by subtracting a median filtered phase image with median filter size of 8x25 mm2. Voxels within the cerebral aqueduct showing significant flow above the noise floor were automatically determined2. Phase unwrapping was performed using Goldstein’s method in 7 scans (venc = 5 cm/s) that showed phase wrapping3. Net CSF flow was determined by integrating the mean velocity over the cardiac cycle over all aqueduct voxels.
A Bland-Altman plot was made and the Intraclass Correlation Coefficient (ICC) with 95% Confidence Interval (95% CI) was determined.
Results
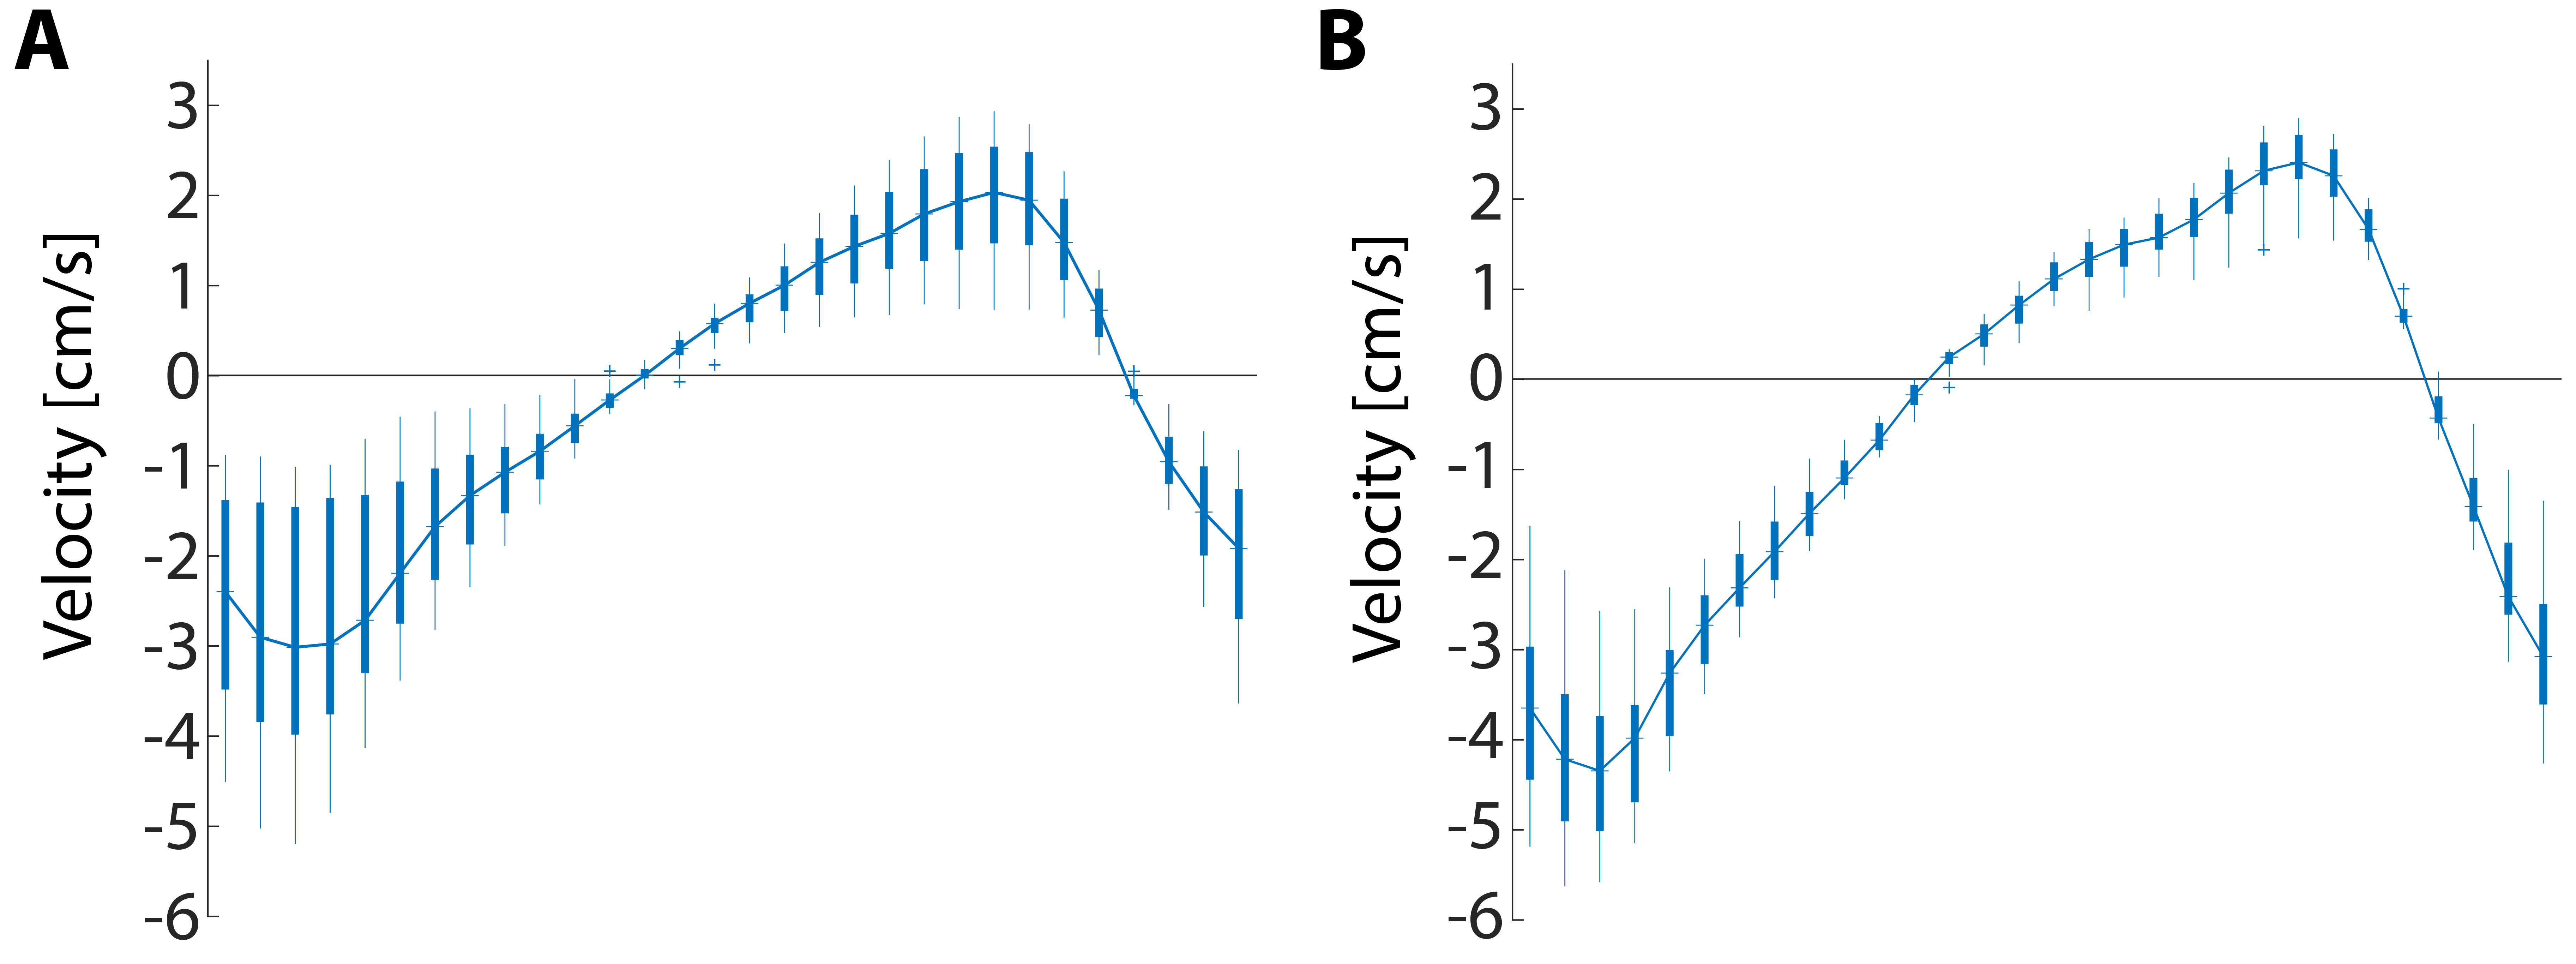
Figure 2 shows the CSF velocity over the cardiac cycle, for one volunteer and for both vencs. For venc 5 cm/s and venc 13 cm/s respectively, CSF flow (mean±std) was 332±128 and 380±231 ml/day (441±149 ml/day excluding the outlier), consistently directed from the brain towards the spine. One outlier was found for venc 13 cm/s (spatial resolution 0.25x0.25x4 mm3), with a net CSF flow of 170 ml/day directed towards the brain rather than the spine.
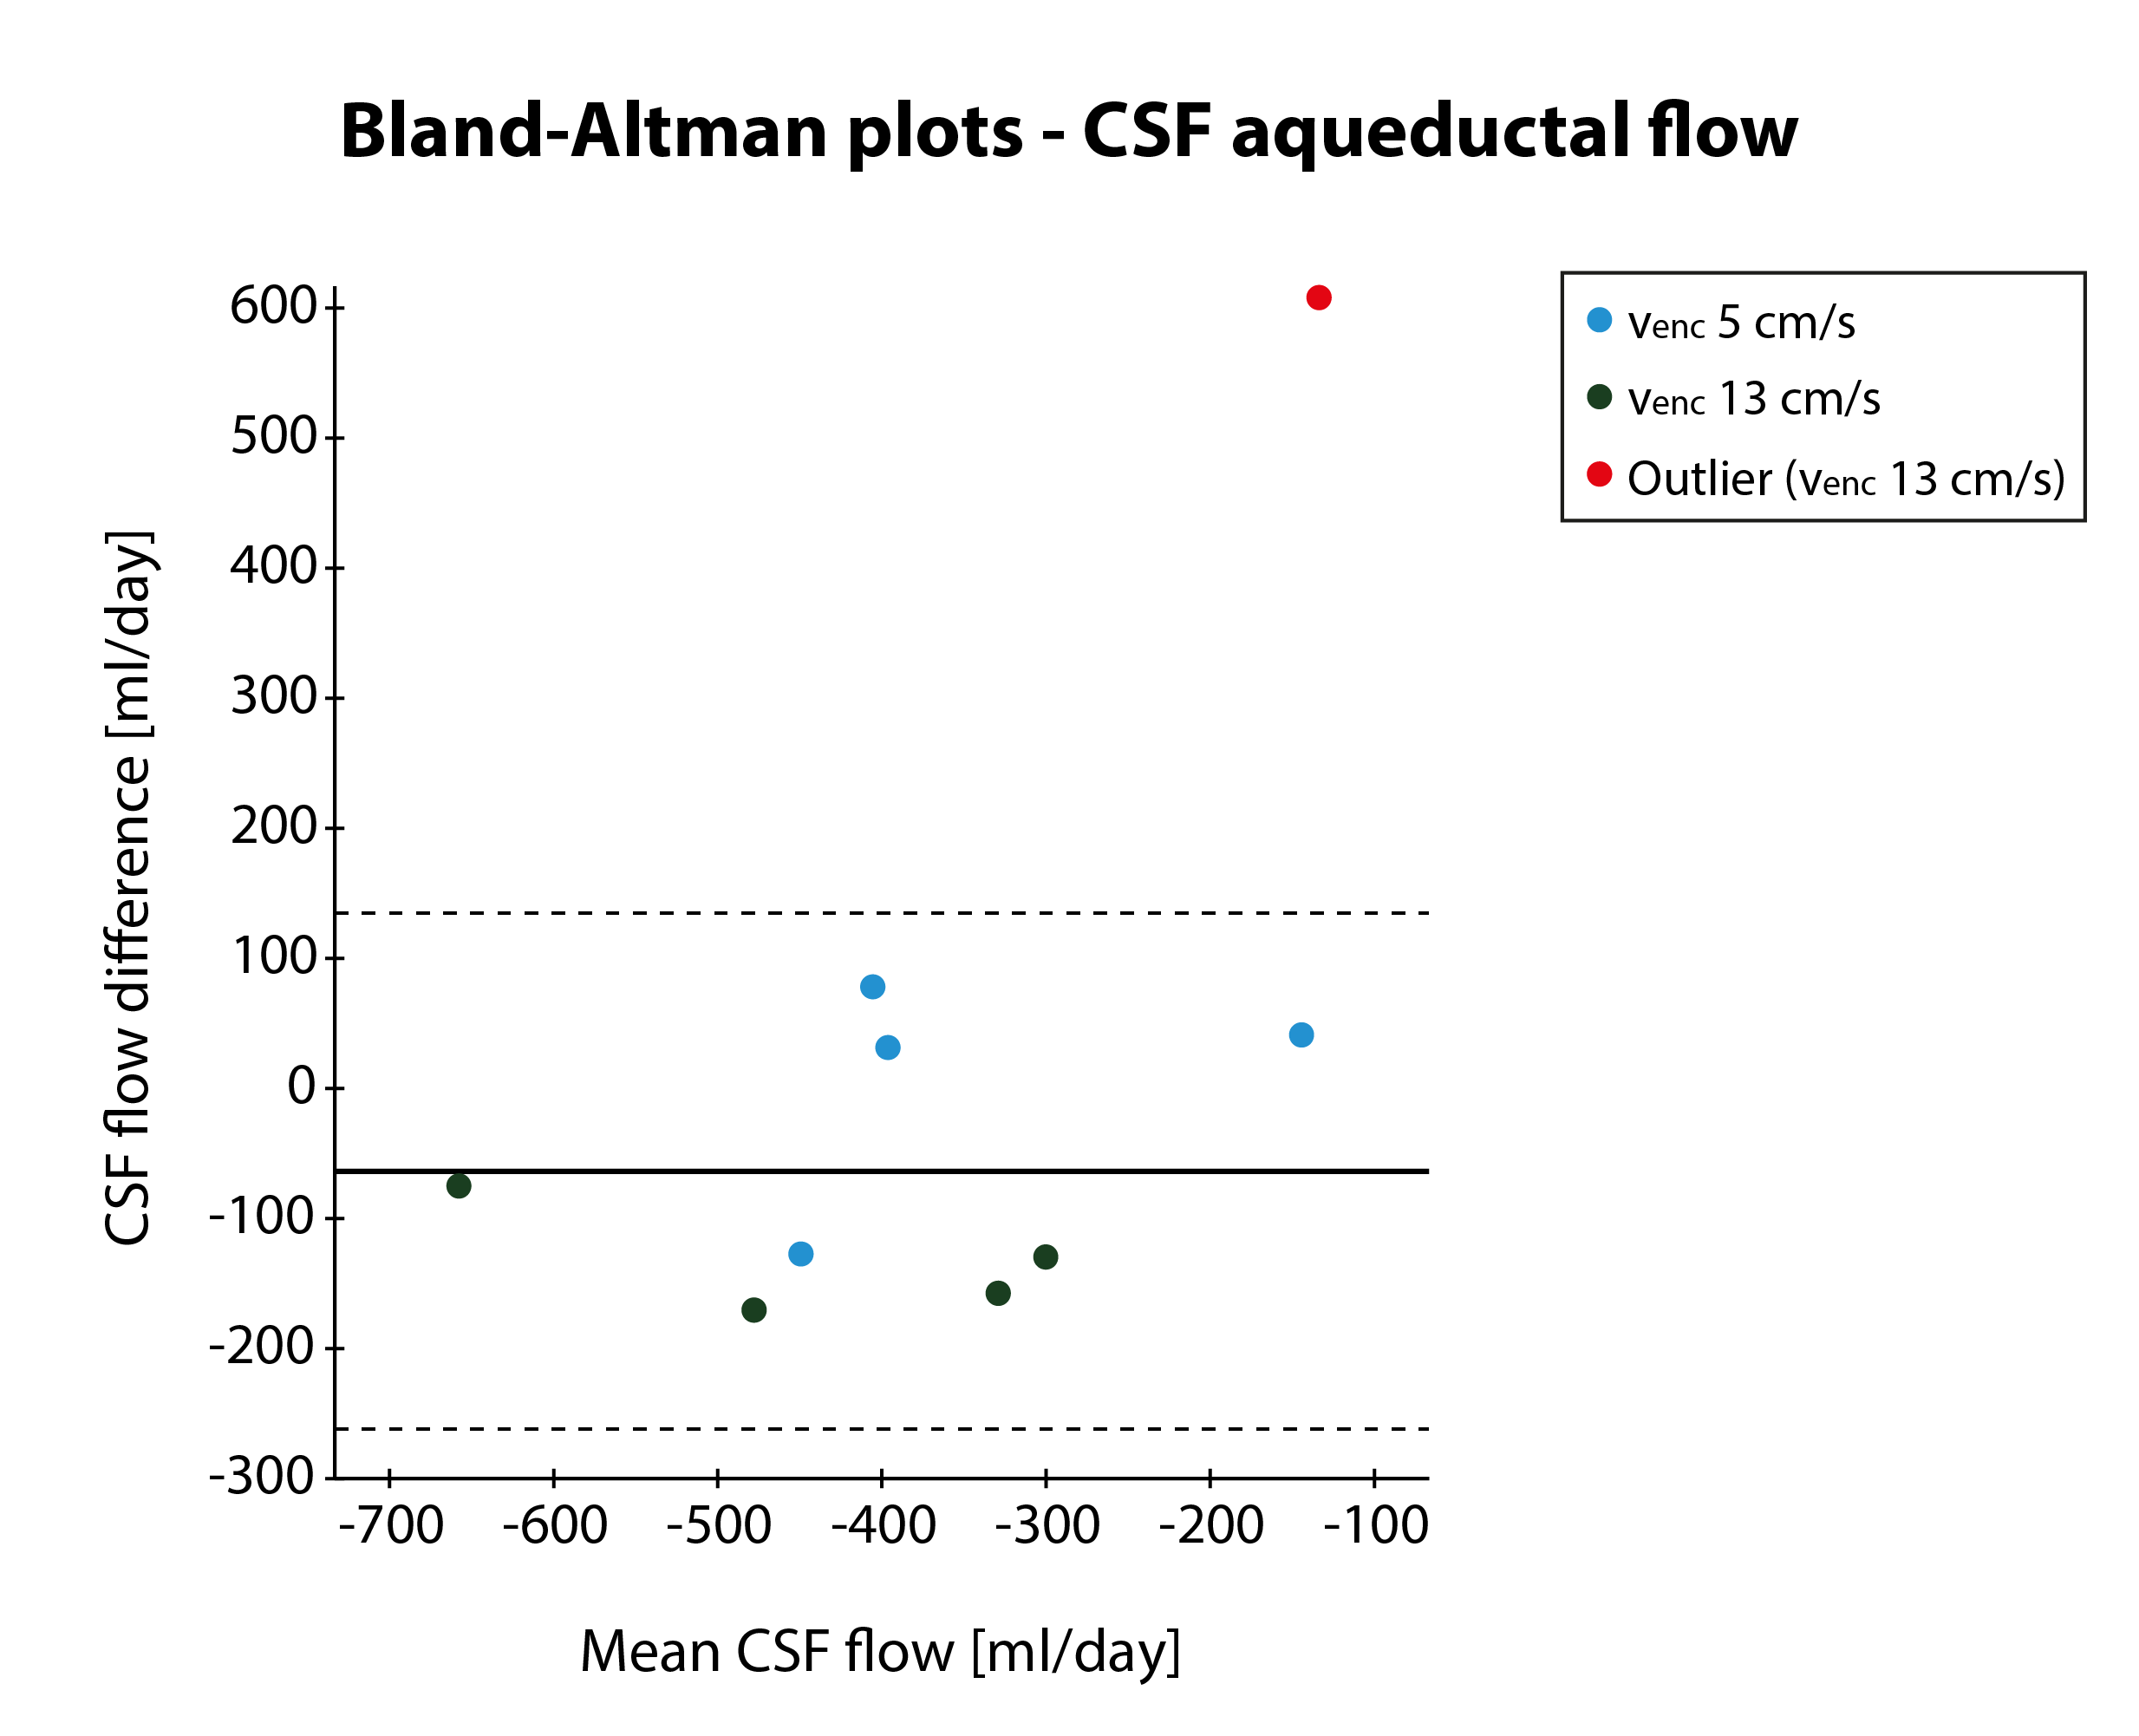
Figure 3 shows the Bland-Altman plot for the repeated measurements. The Limits of Agreement (LoA) were much smaller when the single physiologically impossible outlier was removed from the data.
For venc 5 cm/s ICC was 0.81 (95% CI: -0.25 – 0.99). For venc 13 cm/s ICC was 0.17 (95% CI: -0.75 – 0.86) for all datapoints, and 0.97 (95% CI: 0.59 – 1.0) excluding the outlier.
Discussion
Mean daily CSF flow through the aqueduct is in accordance with values found in literature4–10, which ranges between 374-864 ml/day. Our values fall in the lower end of this range, which may be explained by smaller influence of partial volume, due to the relatively high resolution that was used. CSF production from the choroid plexus in the fourth ventricles is not included in the net CSF flow through the aqueduct. One study measuring total CSF production1 found a production rate of approximately 590 ml/day for volunteers of similar age as in our study. These values are higher than our measurements, as expected.
One outlier was found for venc 13 cm/s, with aqueductal CSF flow directed upwards. Motion was excluded as a possible cause, based on visual inspection. Breathing could affect CSF flow by changing the intracranial pressure (specifically around the k=0 acquisition); this will be further investigated.
High ICCs were found for venc 5 cm/s, and for venc 13 cm/s when the physiologically impossible outlier was excluded. Because of the relatively small number of subjects, separate Bland-Altman analysis of both vencs was not performed. Additional subjects are currently being included for justified outlier detection and more robust evaluation of the performance of quantitative CSF production measurements with 7T MRI.
Conclusion
Aqueductal CSF flow can be measured at 7T, and a reasonable reproducibility was found.Acknowledgements
This work was supported by the European Research Council, ERC grant agreement n°337333.References
1. May C, Kaye J a, Atack JR, et al. Rapoport SI. Cerebrospinal fluid production is reduced in healthy aging. Neurology. 1990;40:500–503.
2. Bouvy WH, Geurts LJ, Kuijf HJ, et al. Assessment of blood flow velocity and pulsatility in cerebral perforating arteries with 7-T quantitative flow MRI. NMR Biomed. 2016;29(9):1295–1304.
3. Goldstein RM, Zebker HA, Werner CL. Satellite Radar Interferometry: Two-dimensional Phase Unwrapping. Radio Sci. 1988;23(4):713–720.
4. Feinberg DA, Mark AS. Human brain motion and cerebrospinal fluid circulation demonstrated with MR velocity imaging. Radiology. 1987;163:793–799.
5. Enzmann DR, Pelc NJ. Cerebrospinal fluid flow measured by phase-contrast cine MR. Am J Neuroradiol. 1993;14:1301–1307.
6. Baledent O, Gondry-Jouet C, Meyer ME, et al. Relationship between cerebrospinal fluid and blood dynamics in healthy volunteers and patients with communicating hydrocephalus. Invest Radiol. 2004;39(1):45–55.
7. Huang T-Y, Chung H, Chen M, et al. Supratentorial Cerebrospinal Fluid Production Rate in Healthy Adults: Quantification with Two-dimensional Cine Phase-Contrast MR Imaging with High Temporal and Spatial Resolution. Radiology. 2004;233(2):603–608.
8. Piechnik SK, Summers PE, Jezzard P, et al. Magnetic resonance measurement of blood and CSF flow rates with phase contrast - Normal values, repeatability and CO2 reactivity. Acta Neurochir Suppl. 2008;102:263–270.
9. Yoshida K, Takahashi H, Saijo M, et al. Phase-contrast MR studies of CSF flow rate in the cerebral aqueduct and cervical subarachnoid space with correlation-based segmentation. Magn Reson Med Sci. 2009;8(3):91–100.
10. Wåhlin A, Ambarki K, Hauksson J, et al. Phase contrast MRI Quantification of pulsatile volumes of brain arteries, veins, and cerebrospinal fluids compartments: Repeatability and physiological interactions. J Magn Reson Imaging. 2012;35(5):1055–1062.
Figures