2844
An outlier rejection scheme to improve background phase correction in PC-MRI1The Ohio State University, Columbus, OH, United States, 2Siemens Healthineers, 3The Ohio State University
Synopsis
The accuracy of flow quantification in phase contrast MRI (PC-MRI) is limited by the presence of eddy current-induced background phase. A widely reported method to correct background phase relies on polynomial fitting of the pixels within regions of static tissue. However, separating regions with steady flow from static tissue can be challenging because such regions lack temporal variations that are often used to identify and eliminate pixels that are not static. In this work, we present and validate a processing method that identifies and eliminates outliers such as pixels belonging to venous flow and thus improves flow quantification.
Purpose
Background phase due to eddy currents can compromise the accuracy of flow quantification in phase-contrast MRI (PC-MRI). In this work, we present a background correction method that is highly effective in the presence of steady flow or other outliers, which can otherwise negatively influence the background phase correction.Materials and Methods
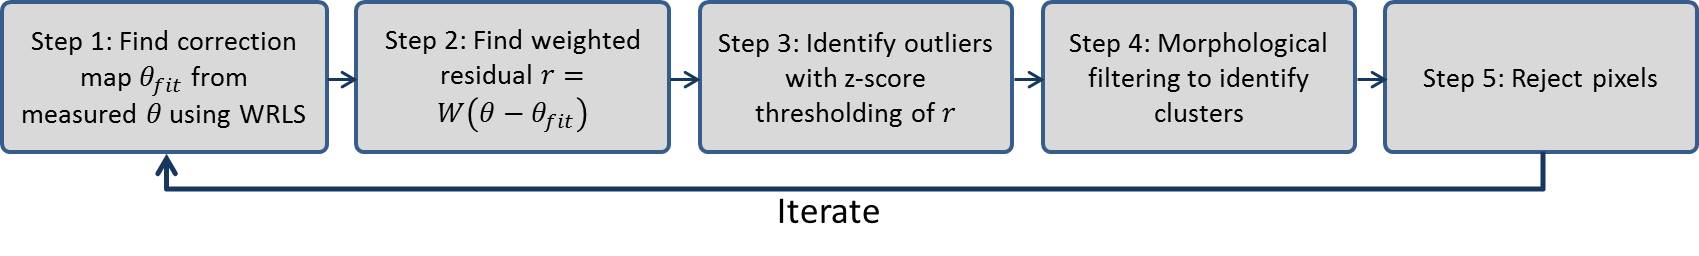
Background phase correction often involves performing polynomial regression using pixels located within static tissue regions. To make this approach insensitive to pulsatile atrial flow, the polynomial regression can be performed using weighted least squares, where the weights are determined by the inverse of the temporal variance of the phase [1]. Recently, we proposed Weighted Regularized Least Squares (WRLS) that merges the weighted least squares with $$$\ell_1$$$ regularization of polynomial coefficients to guard against overfitting when high order polynomials are used [2]. These developments, however, do not account for the steady flow, e.g., in veins, which may have negligible temporal variance. In this work, we extend WRLS with an outlier rejection scheme, called WRLS+OR, to eliminate outliers including pixels with steady flow. The main steps in the implementation of WRLS+OR are as follows. Step 1: Apply magnitude thresholding to discard pixels with no or little flow and perform WRLS with 4th order polynomial. Step 2: Compute weighted residual $$$r=W(\theta-\theta_{fit})$$$, with $$$\theta$$$ being the measured phase map, $$$\theta_{fit}$$$ being the polynomial fit from WRLS, and $$$W$$$ being the inverse of the temporal standard deviation. Step 3: Compute z-scores for $$$r$$$ and identify pixels with z-score of more than 1 or less than -1. Step 4: For the pixels identified in Step 3, perform morphological filtering to discard single pixels that are not clustered. Step 5: Create a binary rejection mask for the remaining pixels in Step 4. These steps are also summarized in Figure 1. We have observed that one iteration (Steps 1 through 5) is adequate to reject most of the outliers, with marginal impact of applying additional iterations.
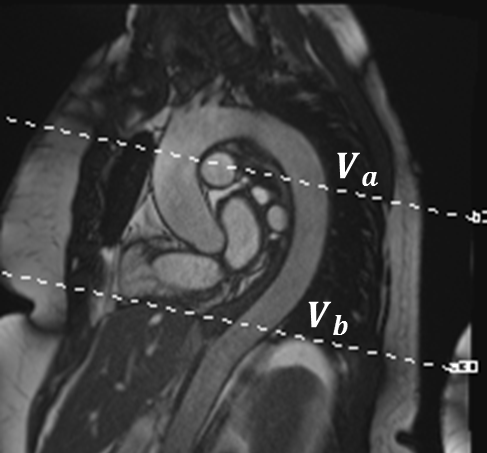
Eight PC-MRI datasets were acquired from five healthy volunteers (3 males, mean age 54.4±14.4). Imaging was performed on a 1.5 T clinical MR scanner (MAGNETOM Aera, Siemens Healthineers, Erlangen, Germany) with a body matrix and spine coils for signal reception. The imaging parameters for PC-MRI were: TE/TR = 2.47/4.64 ms, temporal resolution = 37.36 ms, BW = 450 Hz/Pixel, FA = 15°, IPAT = 2, imaging matrix = 192x130, VENC = 150 cm/s, and slice thickness = 6mm with a 90mm slice distance. Two parallel slices transecting the aorta with the upper slice placed at the level of the main pulmonary artery were acquired in two separate breath-holds (Figure 2). The flow volume in the descending aorta was compared across the two slices by computing the ratio $$$V_a/V_b$$$. The background phase was corrected using both WRLS and WRLS+OR.
Results
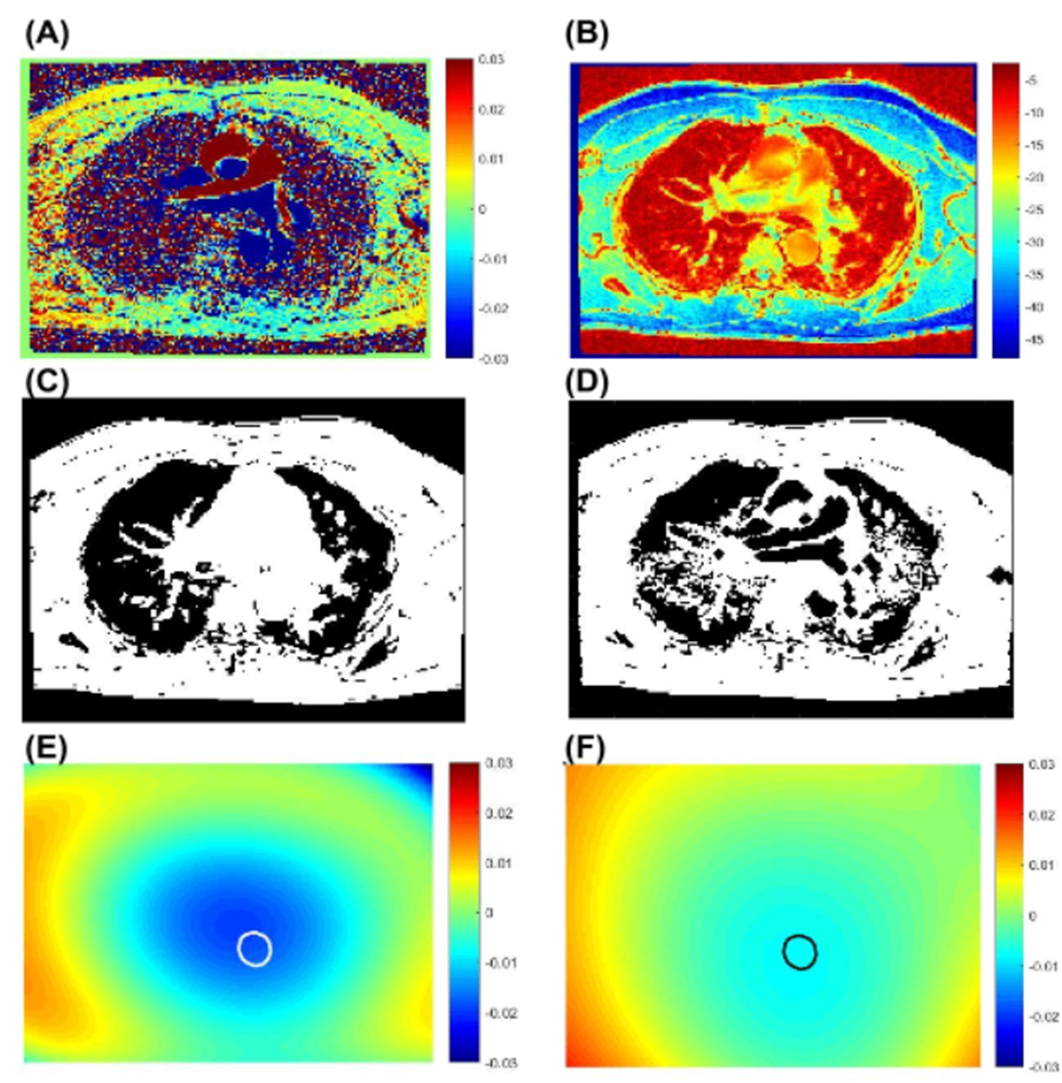
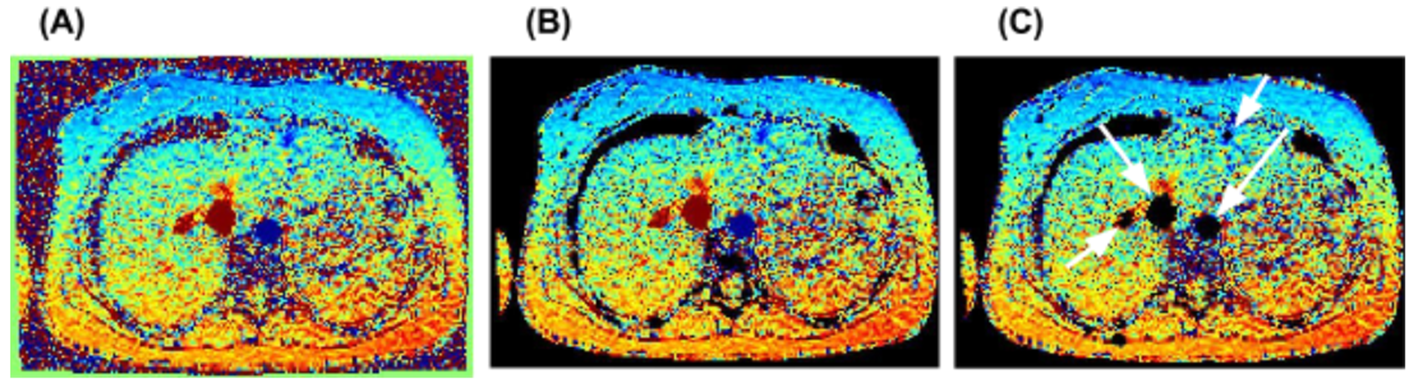
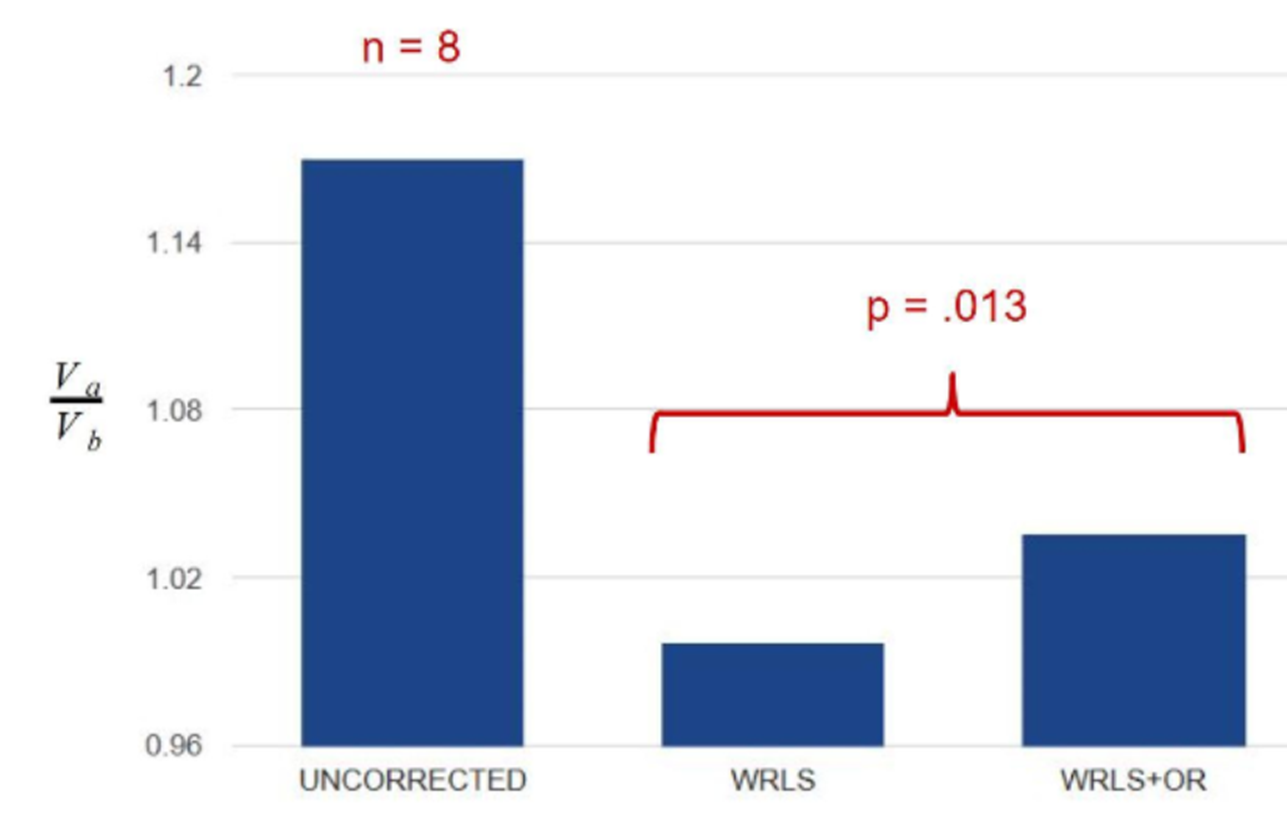
Figure 3 demonstrates how the flow in the great vessels impacts the correction map. In contrast to WRLS correction alone, integrating outlier rejection into WRLS successfully identified and removed the contribution of flow in generating the correction map. At the location of descending aorta, the two correction maps differ by approximately 1% leading to a 11% change in flow quantification. Figure 4 shows another example, where outlier rejection correctly identifies and eliminate major vessels. Figure 5 shows the impact of outlier rejection on flow quantification. Without outlier rejection, the ratio of flow is slightly underestimated, but after incorporating outlier rejection the ratio is slightly greater than one. The expected value of $$$V_a/V_b$$$ is greater than one due to small arteries between the two imaging planes. The difference between WRLS and WRLS+OR was found to be statistically significant using paired t-test.Conclusions
Blood flow in vessels generates a strong localized phase which can negatively impact background phase correction. We have presented a method that identifies and rejects the flow pixels or other outliers, improving the flow quantification. In future, we will apply this technique to a larger volunteer population to investigate its impact on the quantification of Qp/Qs.Acknowledgements
This work was funded by NIH grant R21EB022277.References
[1] Ebbers et al. ISMRM 2008, p1367. [2] Ahmad et al. ISMRM 2016, p2584.Figures