2843
Comprehensive Hemodynamics of Living Donor Liver Transplantion Using MRI-based In-Vitro Experiments and Computational Simulation1Mechanical Engineering, UW Madison, Madison, WI, United States, 2Radiology, UW Madison, Madison, WI, United States, 3Medical Physics, UW Madison, Madison, WI, United States, 4Biomedical Engineering, UW Madison, Madison, WI, United States, 5Medicine, UW Madison, Madison, WI, United States, 6Emergency Medicine, UW Madison, Madison, WI, United States
Synopsis
The purpose of this study was to develop a patient specific experimental methodology to complement computational surgical planning models for living donor liver transplant. 4D flow MRI was performed on one healthy liver donor before and after partial hepatectomy. Physical models of the donor vasculature were created, and experiments were conducted to measure flow and pressure throughout the system. Experimental results were compared with 4D flow measurements and simulation results. Flow measurements were significantly similar between imaging and simulation, and between simulation and experiment. This methodology will be used to improve boundary value assumptions in surgical planning models.
Background
Living donor liver transplantation (LDLT) is a successful therapy used to treat liver failure and/or hepatocellular carcinoma.1 However, the mechanical effects of LDLT on splanchnic hemodynamics of the donor are not fully understood. 4D Flow MRI can be used to quantify these hemodynamic effects after the partial hepatectomy, but is not capable of predicting post-surgery alterations. Computational methods present an alternative to address this limitation, and help predict surgical hemodynamic outcomes2,3. However, the parameters used in such computer models require validation to ensure accurate prediction. Therefore, the purpose of this study was to develop a patient specific experimental methodology for surgical planning for living donor liver transplant.Methods
In this IRB-approved and HIPAA-compliant study, one healthy subject with no known liver disease, was recruited. MR scanning was conducted before and after right hepatectomy on a clinical 3T scanner (Discovery MR 750, GE Healthcare, Waukesha, WI) with a 32-chanel body coil (NeoCoil, Pewaukee, WI). 4D velocity mapping was achieved using 5-point PC-VIPR. 4,5 Image parameters included: imaging volume: 32x32x24cm spherical, 1.25mm acquired isotropic spatial resolution, TR/TE=6.4/2.2ms. The subject received 0.05 mmol/kg of gadoxetic acid (Eovist, Bayer Healthcare, Wayne, NJ) as part of their clinical evaluation. 4D flow MRI data were reconstructed to 14 time frames per cardiac cycle. A computational surgical planning method using this in vivo data was developed and presented in previous work. 2,3
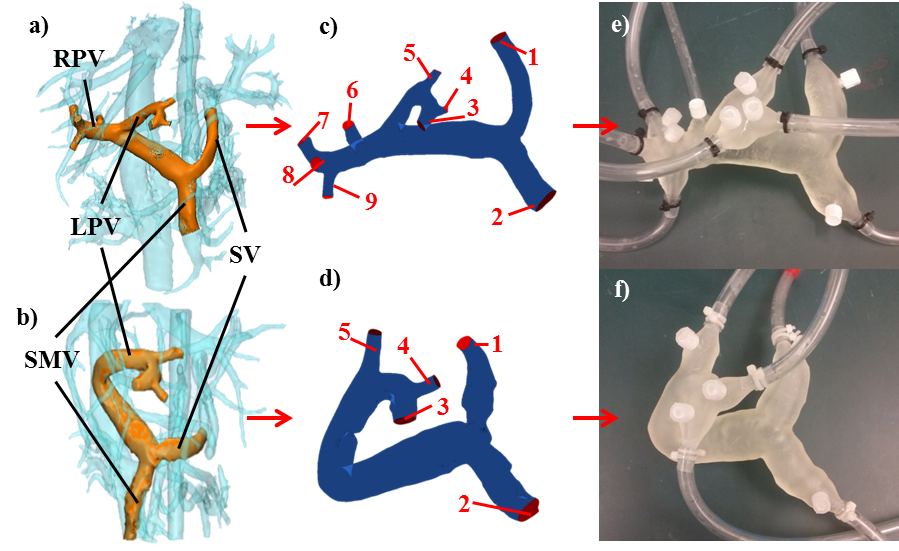
To develop the physical models, liver vasculature was first segmented from 4D flow PC angiograms using MIMICS (Materialise, Leuven, Belgium), as shown in Figures 1a and 1b. The segmented pre- and post-surgery models were then prepared for fabrication using the design software 3-matic (Materialise, Leuven, Belgium). Additionally, “pressure ports” were added to the models at each inlet and outlet boundary to allow for the water-tight insertion of a pressure wire. These patient-derived geometries were then used to produce physical models using the additive manufacturing method of stereolithography (Form 2, Formlabs, Somerville, MA USA ), as shown in Figures 1e and 1f.
The two models were connected to a perfusion pump (Stockert SIII Heart-Lung Machine). Water was pumped through the system at steady rates of 1 and 2 liters per minute to simulate physiologic conditions, while flow and pressure measurements were recorded at each inlet and outlet location using a flow probe (Transonic PXL Flowsensor) and a fiber optic pressure measurement system (OpSens, Québec, Canada), respectively. The in vitro set-up was then transferred to a clinical 3T scanner (Discovery MR 750, GE Healthcare, Waukesha, WI), where the flow experiments were repeated and 4D flow MRI was performed following the same protocol used in vivo. The 4D Flow MR data were then analyzed using cut planes in Ensight (CEI, Apex, NC).
The models were also used to perform computational fluid dynamics simulations using in the commercial software FLUENT (ANSYS). The inlet and outlet boundary locations matched the pressure port locations on the physical experimental models, as shown in Figures 1c and 1d. Experimentally determined inlet flow rates and outflow percentages were imposed at the inlet and outlet boundaries, respectively. The simulation flow results were recorded and compared with flow probe and 4D flow measurements with a 2-sided t-test with p<0.05 indicating statistical difference in flow. Similarly, the pressure results were recorded.
Results
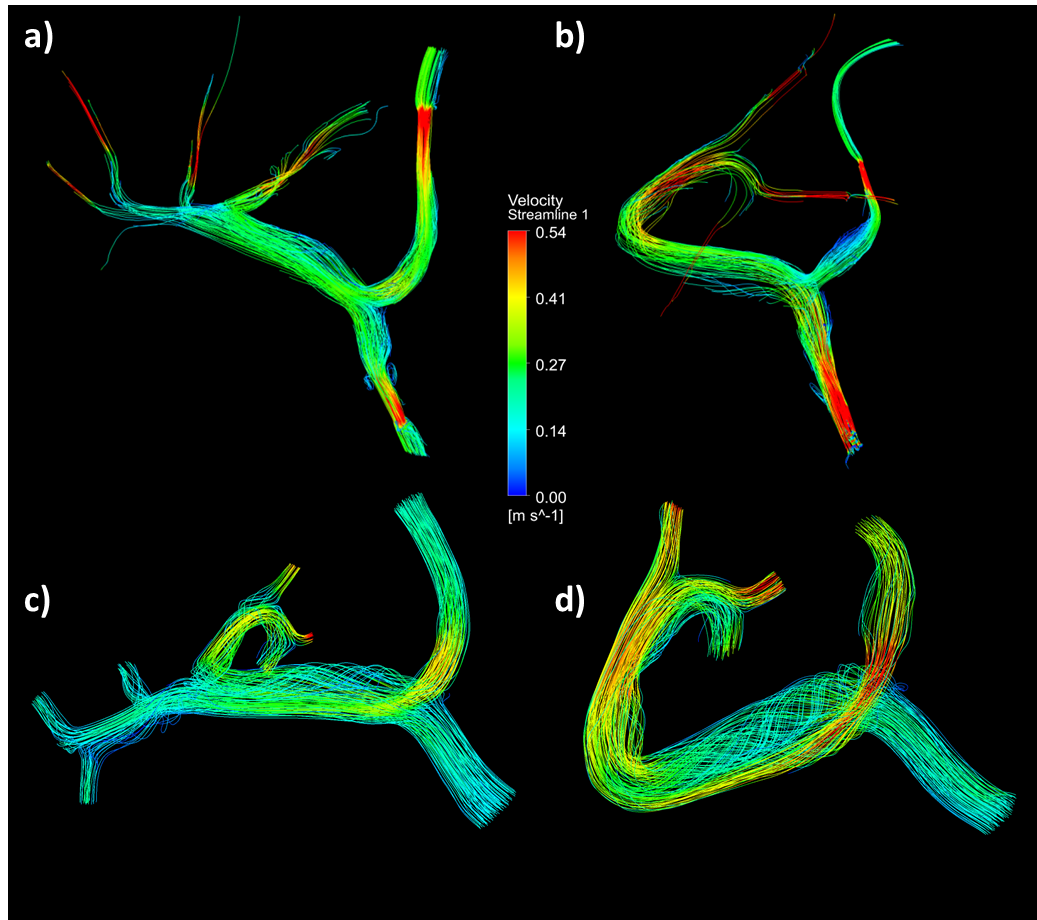
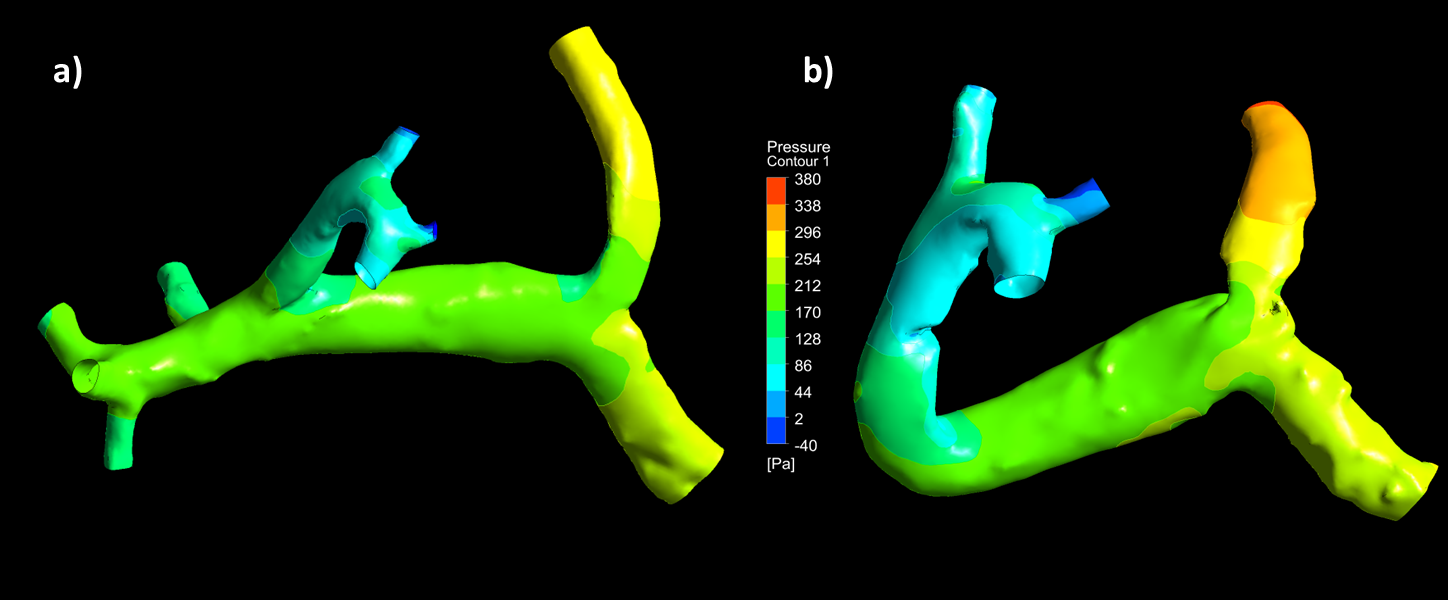
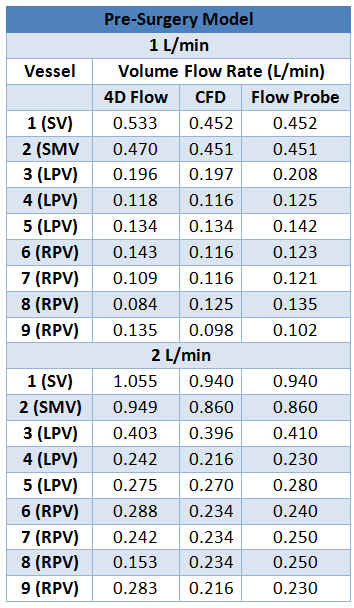
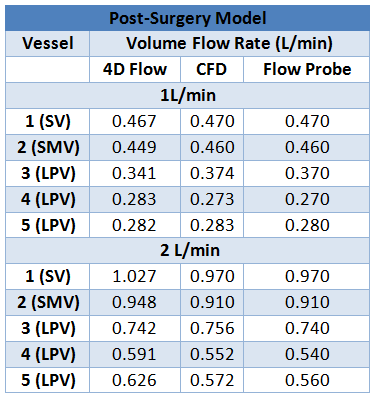
Tables 1 and 2 present a summary of the quantitative results of the experiments and simulations, and Figure 2 displays a qualitative representation of the flow streamlines. There was no significant difference between flow measurements obtained through 4D flow and simulation (p=0.2942), and between 4D flow and flow probe experiments (p=0.5946). In vitro pressure measurements were recorded for boundary reference, whereas the CFD simulations provided estimates of pressure gradients within the system, as shown in Figure 3.Discussion and Conclusion
4D flow MRI and computational simulations are important potential tools for surgical planning in living liver donors. The results derived from these methods require further validation to ensure their accuracy. This study showed that experimentally derived flow results can be consistent with both imaging and simulation data. Additionally, a pressure measurement method was developed that provided insight into the pressure range of the model system. Future work will further develop this experimental method with the intention of implementing the derived boundary conditions and improving the accuracy of surgical planning models.Acknowledgements
The research presented was supported under NIH awards UL1TR000427, TL1TR000429, R01 DK096169, and K24 DK102595, as well GE Healthcare who provides research support to the University of Wisconsin.References
1. Yagi, S, T Iida, and K Taniguchi. "Impact of portal venous pressure on regeneration and graft damage after living-donor liver transplantation." Liver Transplantation 11.1 (2004): 68-75. ;
2. Rutkowski DR, Reeder SB, Fernandez L, Roldán-Alzate A. “Patient Specific Virtual Surgery Modeling Using Meal Challenge Vessel Strain Values.” The 28th Society for Magnetic Resonance Angiography, Chicago, IL. September 21-23, 2016.
3. Rutkowski DR, Reeder SB, Fernandez L, Roldán-Alzate A. “Patient Specific Virtual Surgery for Living Donor Liver Transplant: Right vs. Left Lobectomy.” Quantitative MR Flow: Innovation & Implementation for Clinical & Physiological Insights, San Francisco, CA, USA, Oct 20-23.2016
4. Johnson, K M, O Wieben, and A A Samsonov. "Phase-contrast velocimetry with simultaneous fat/water separation." Magnetic Resonance in Medicine Magn. Reson. Med. 63.6 (2010): 1564-574
5. Gu T, F R Korosec , W F Block, et al. PC VIPR: a high-speed 3D phasecontrast method for flow quantification and high-resolution angiography. AJNR Am J Neuroradiol 2005;26:743–749.
Figures