2840
Assessment of global cerebral flow: comparing 2D and 4D flow strategiesKarin Markenroth Bloch1, Jonas Svensson2, Mariam Al-Mashat3, Marcus Carlsson3, and Danielle van Westen4
1Lund University Bioimaging Center, Lund University, Lund, Sweden, 2Dept. of Medical Radiation Physics, Lund University, Lund, Sweden, 3Lund University, Dept. of Clinical Sciences Lund, Clinical Physiology, Skane University Hospital, Lund, Sweden, 4Dept. of Diagnostic Radiology, Lund University, Lund, Sweden
Synopsis
Quantifying the total blood supply to the brain and relating that to brain tissue mass gives a measure of global cerebral blood flow (CBFglo). The cerebral blood flow can be measured using phase contrast MRI in the supplying arteries. For accuracy, separate 2D flow measurements for each vessel has been recommended. An alternative is to use one 4D flow measurement that covers all vessels of interest and allows flexible definition of measurement planes. The aim of this work is to compare the flow results obtained from a single 2D flow measurement to those from a 4D flow scan.
Introduction
A global measure of cerebral blood flow (CBFglo) can be obtained by determining the ratio of the total supplying blood flow to the brain tissue mass. The total blood flow to the brain is obtained by summing the flow in the internal carotid arteries (ICA) and vertebral arteries (VA) as measured by phase contrast MRI, and the mass can be obtained from estimates of brain volume from morphological MRI images. The method has for example been used to measure the metabolic rate in the brain [1, 2], and an analogous technique is used to assess global myocardial blood flow [3]. As the anatomy of the vessels in the neck varies, it is challenging to place one slice that is perpendicular to all vessels. Therefore, separate 2D flow measurements in each vessel have been recommended [2]. An alternative could be to instead use a 4D flow scan that covers all vessels of interest and allows for flexible definition of measurement planes. The aim of this work is therefore to compare flow results obtained from a single 2D flow measurement with throughplane velocity encoding with those from a 4D flow scan where the three velocity components are encoded.Methods
Eleven subjects were scanned on a 3T MRI system (Skyra, Siemens Healthcare, Erlangen, Germany). For the 2D flow measurement, the retrospectively triggered clinical routine scan was used. To reduce the scan time, the 4D flow was acquired without cardiac triggering, see below. The number of averages were adjusted to get comparable SNR. Sequence parameters are given in Figure 1. Both sequences were positioned on a TOF-angio, placing the 2D slice at a suitable location above the carotid bifurcation and below the skull base, and the 4D slab with its lowest slice at the bifurcation (fig. 2a). The 4D overlapped the 2D slice in all cases but two, and in these cases there was no suitable positioning for the 2D slice within the 4D slab. Data processing was performed in GTFlow (Gyrotools, Zürich, Switzerland), and included linear phase correction using stationary tissue. For each data set, six vessels were defined: right and left ICA, right and left VA, and right and left jugular vein (JV) (fig. 2b). In all, 62 vessels were measured (4 vessels were not identified, presumably due to anatomical variation). For 2D flow, the average flow over the cardiac cycle was computed for each vessel, and was compared with the flow for the corresponding vessel in the 4D flow dataset. In the 4D flow data, vessel ROIs were placed perpendicular to the vessels on the angiograms (Fig. 2c).Results
The 2D and 4D flow measurements correlate well (r2=0.75, Fig. 3). However, in 4 of the vessels the difference was larger than 75%, discrepancies that were due to malpositioning of the 2D slice (3 cases) or inadequate resolution to separate adjacent vessels in the 2D flow data (one case). After removing the outliers, the correlation improved (r2=0.83, fig. 3). When excluding the outliers, a Bland-Altman analysis showed a positive bias for the 2D flow data (bias=0.76, fig. 4). The bias was retained when comparing per vessel (fig. 5).Discussion
Use of 4D flow data allows for an optimal ROI position for each vessel, regardless of the specific vessel geometries. This greatly facilitates planning, and removes any need for repeated scans. In addition, 4D flow data acquisition provides an isotropic, high-resolution data set in a clinically acceptable scan time. Use of non-triggered 4D flow data is supported by the results in [2], showing that the 2D flow results can be compared between triggered and untriggered scans, as well as by in-house tests.Conclusions
Flow results based on 4D flow data can be used to estimate global blood supply to the brain. The advantages of 4D flow over 2D flow are ease of slab positioning and the flexible ROI selection, thereby reducing the number of flawed measurements due to malpositioning. For correctly positioned measurement planes, we found a small positive bias for 2D flow data.Acknowledgements
The authors gratefully acknowledge the skilled assistance of radiographers Amir Vahabi and Makda Haile Michael at Skane University hospital.References
[1] F. Xu et al., MRM:62, p.141 (2009)
[2] P. Y. Liu et al., MRM:69,
p.675 (2013)
[3] K. Markenroth Bloch et al., BMC MI:9, p.9
(2009)
Figures
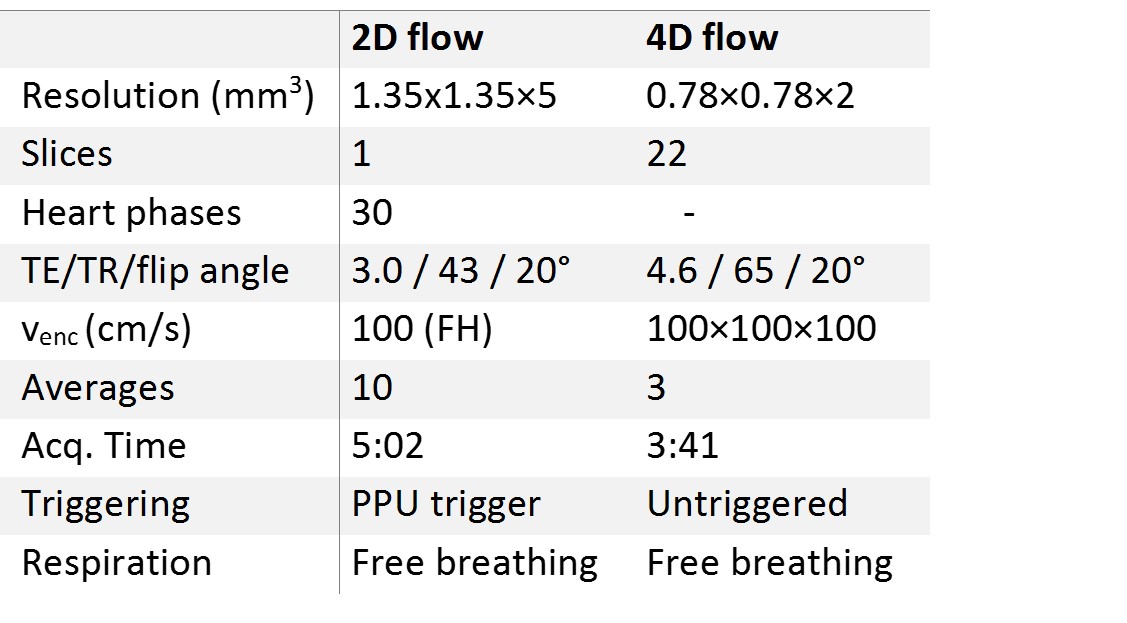
The main sequence parameters for the 2D and 4D flow sequences.
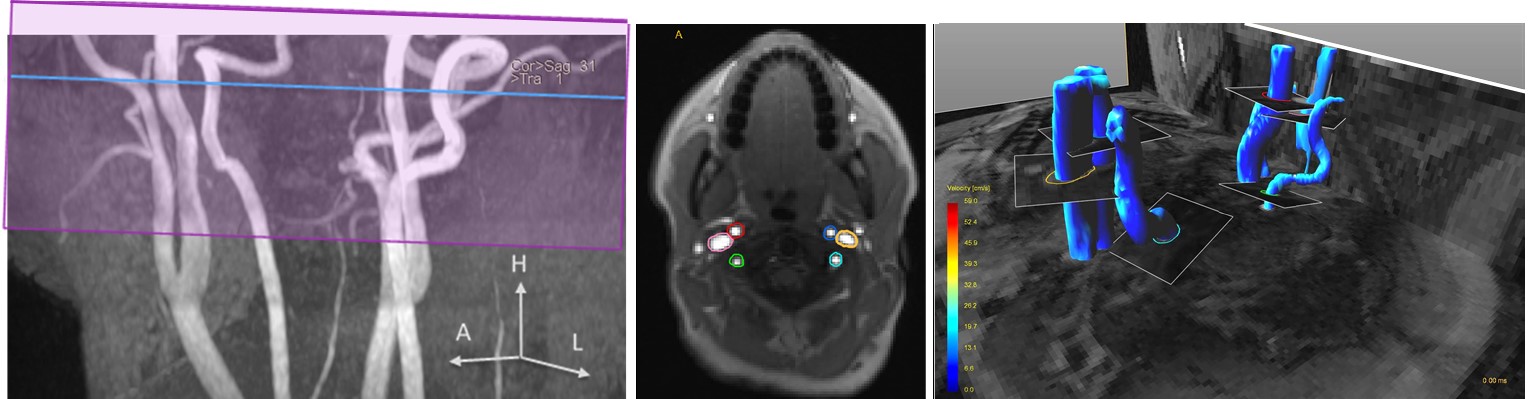
An example
of 2D and 4D flow datasets: (a) MIP of TOF-angio with the positions of the 2D flow slice and 4D flow
slab indicated, (b) the six 2D flow ROIs overlayed on the magnitude image, (c) the
six 4D flow ROIs positioned on an angiogram.
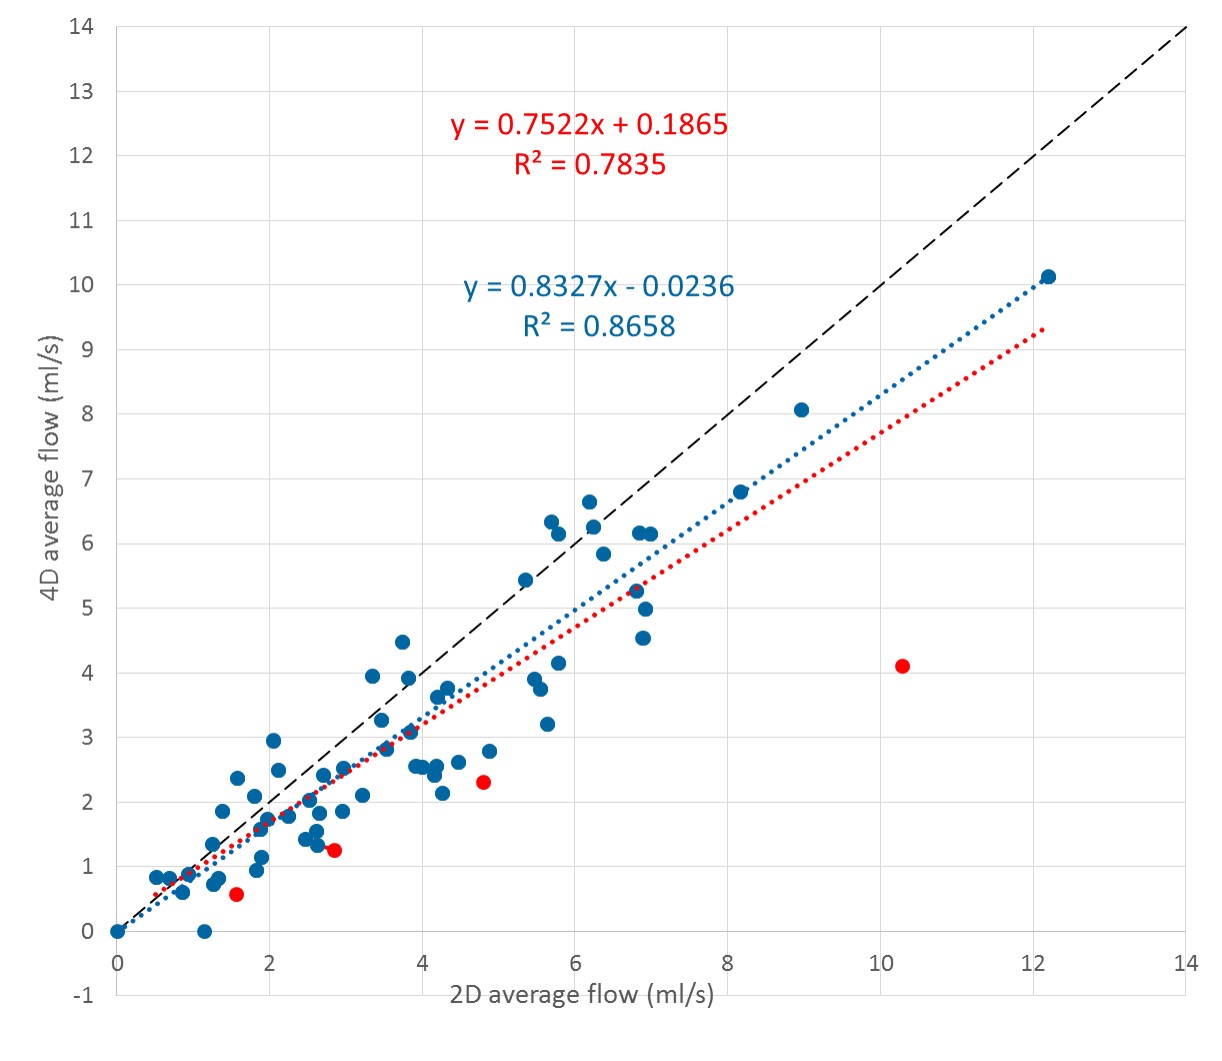
Correlation between 2D and
4D average flow (ml/s) for all vessels. Outliers are marked in red. The red
dotted line is a linear regression using all data points, while the blue line
excludes the outliers. The black line is the identity line.

Bland-Altman plot excluding the outliers that were
explained by erroneous positioning shows that there is a small bias= 0.76 (black line). The dashed lines indicates the 95% confidence interval (lower bound: -0.83, higher bound: 2.16).
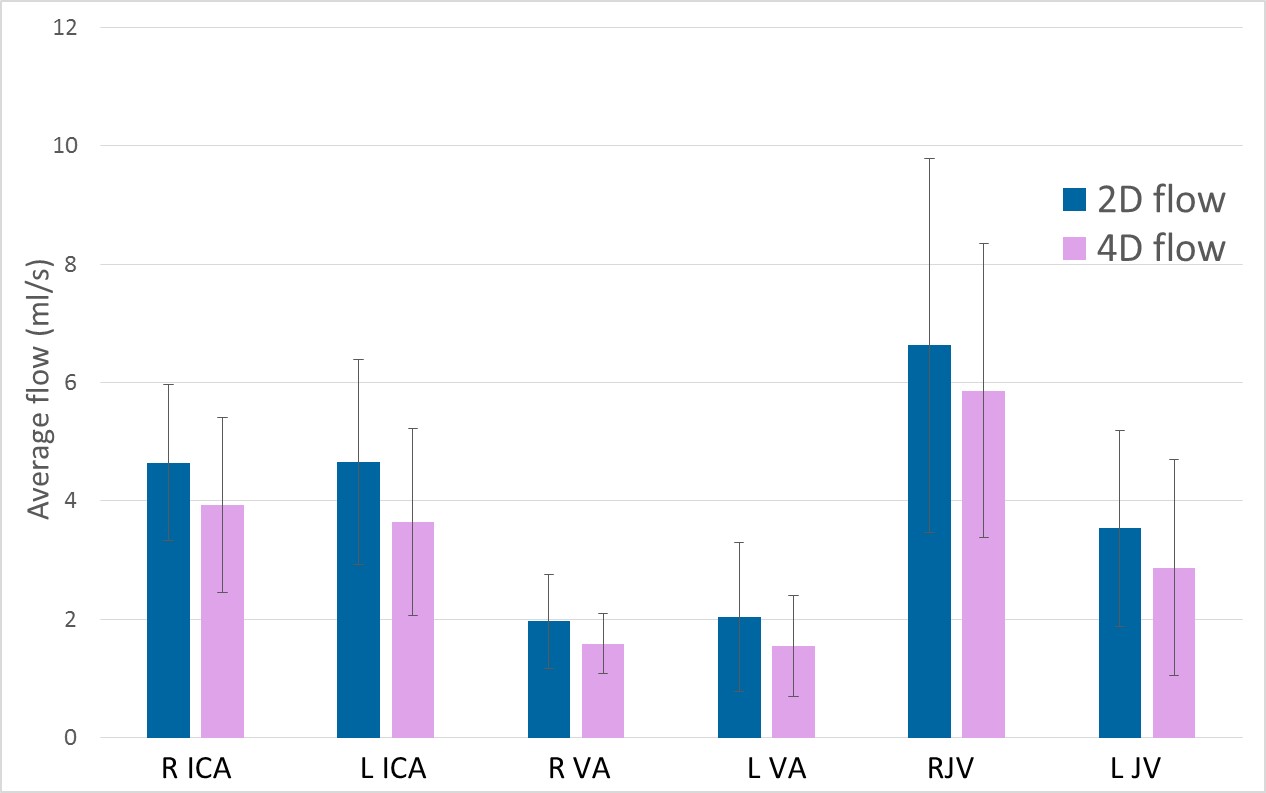
Average flow in the different vessels,
averaged over subjects. The error bars show the standard deviation.
Paired t-tests show that the differences are statistically significant
(p=0.01-0.05).