2839
Influence of the k-t Principal Component Analysis acceleration factor on the accuracy of flow measurement in 4D PC-MRI1BioFlow Image, University of Picardie Jules Verne, Amiens, France, 2Maxillo-facial surgery, University Hospital of Amiens, Amiens, FL, France, Metropolitan, 3Biomechanics & Bioengineering Laboratory, Université de Technologie de Compiègne, Compiègne, France, Metropolitan, 4Department of image processing, University Hospital of Amiens, Amiens, France, Metropolitan
Synopsis
The main purpose of this phantom study is to assess the influence of k-t Principal Component Analysis reconstruction technique on the 4D PC-MRI velocity measurements through millimetrics vessels. 4D PC-MRI sequence is repeated 4 times with a k-t PCA acceleration factor set at 0, 2, 4 and 8. Flow curves are reconstructed and their mean flow and amplitude are compared. Results shows it is possible to reduce the acquisition time and still maintain a good mean flow measurement accuracy. However, the k-t PCA acceleration factor causes loss of information, resulting in a decrease of the amplitude of the flow curve.
Purpose
4D Phase-Contrast MRI (PC-MRI)
is mainly performed in vessels with an important diameter, such as the aorta1.
Only a few studies show its potential when used in intracranial vessels2
or arteries from the head and neck area, since their study implies a good
spatial resolution, resulting in a long acquisition time. The application of an
acceleration factor, using Principal Component Analysis (k-t PCA) can help solving this problem. Based on under-sampling the
k-space, PCA reduces highly dimensional data into lower dimensions, using correlations
within the data3. The main purpose of this study is to assess the influence
of k-t PCA on the flow measurement of a phantom composed by branches with small
diameters.Methods
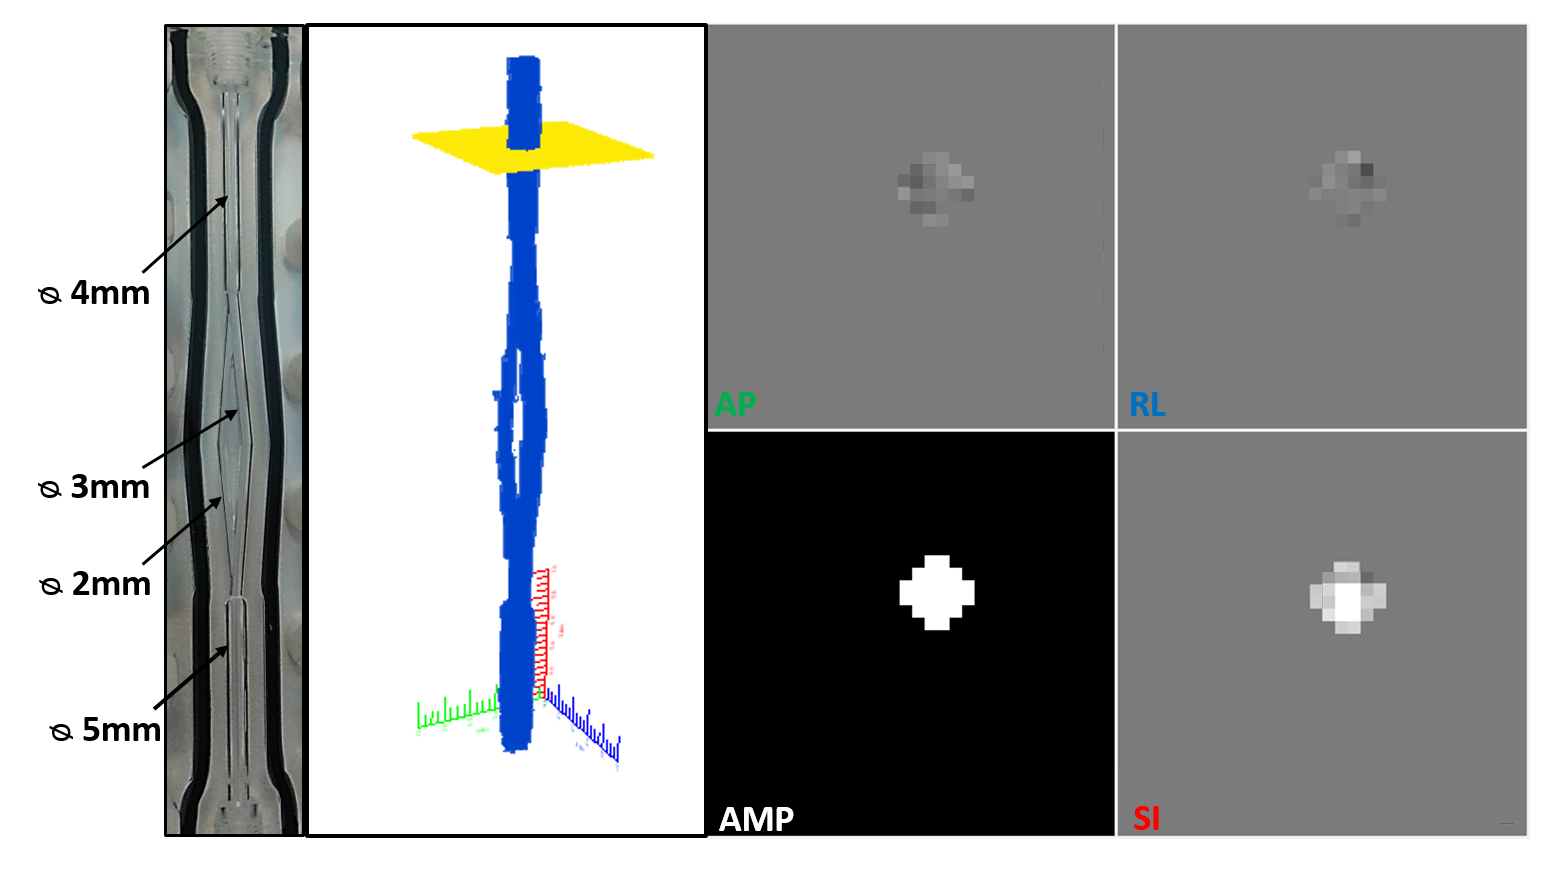
This study is performed with a MRI compatible Plexiglas phantom, composed by 6 branches with diameters similar to those found on the face and neck area, Figure 1. A pump (Masterflex), connected by pipes, provides a pulsatile flow to the phantom with a frequency selected at 100 cycles/min for an average flow rate of 87 ml/min. Before MRI acquisitions, an accurate flow sensor (Transonic System Inc.) is placed before the phantom input to measure the flow curve with high accuracy. The sensor is then placed in the same conditions in the 3T, Achieva dStream, Philips MR system to perform the 4D PC-MRI acquisitions. Sequences are acquired using a 32 head coils channels in the axial plane with the following parameters: FOV=50x50mm2, TE/TR=3/8ms, spatial resolution=0.6x0.6x0.6mm3, 1 repetition, SENSE=0, 140 slices, and 16 frames for each cycle. The velocity encoding is selected at 50cm/s in all three flow directions, above the maximum velocity observed in the phantom. The sequence is repeated 4 times using a k-t PCA acceleration factor set at 0, 2, 4 and 8 (factor of the under-sampling of the k-space). A homemade software has been developed to process images from 4D PC-MRI sequences, using a semi-automatic segmentation, based on a Fast Fourier Transform4, to reconstruct the acquired volume. A slice is manually placed on the volume reconstructed from the 4D PC-MRI images to rebuild a 2D slice of the segmented branch, Figure 1. 4D flow data analysis included corrections for background phase error and velocity aliasing. For each branch of the phantom (except the input branch, since it is too far from the coil to have enough signal), the flow curve is reconstructed along the pulsatile cycle. This operation is repeated 3 times for 3 different slice positions on the same branch. A mean flow curve is then calculated for each branch. Accuracy of the flow measurement is evaluated by calculating the difference between the expected and the measured flow in each branch. The difference between the values is normalized in percent of the expected flow rate. The amplitude of each flow curve is measured by calculating the difference between the maximum and minimum peaks of the flow curve.Results
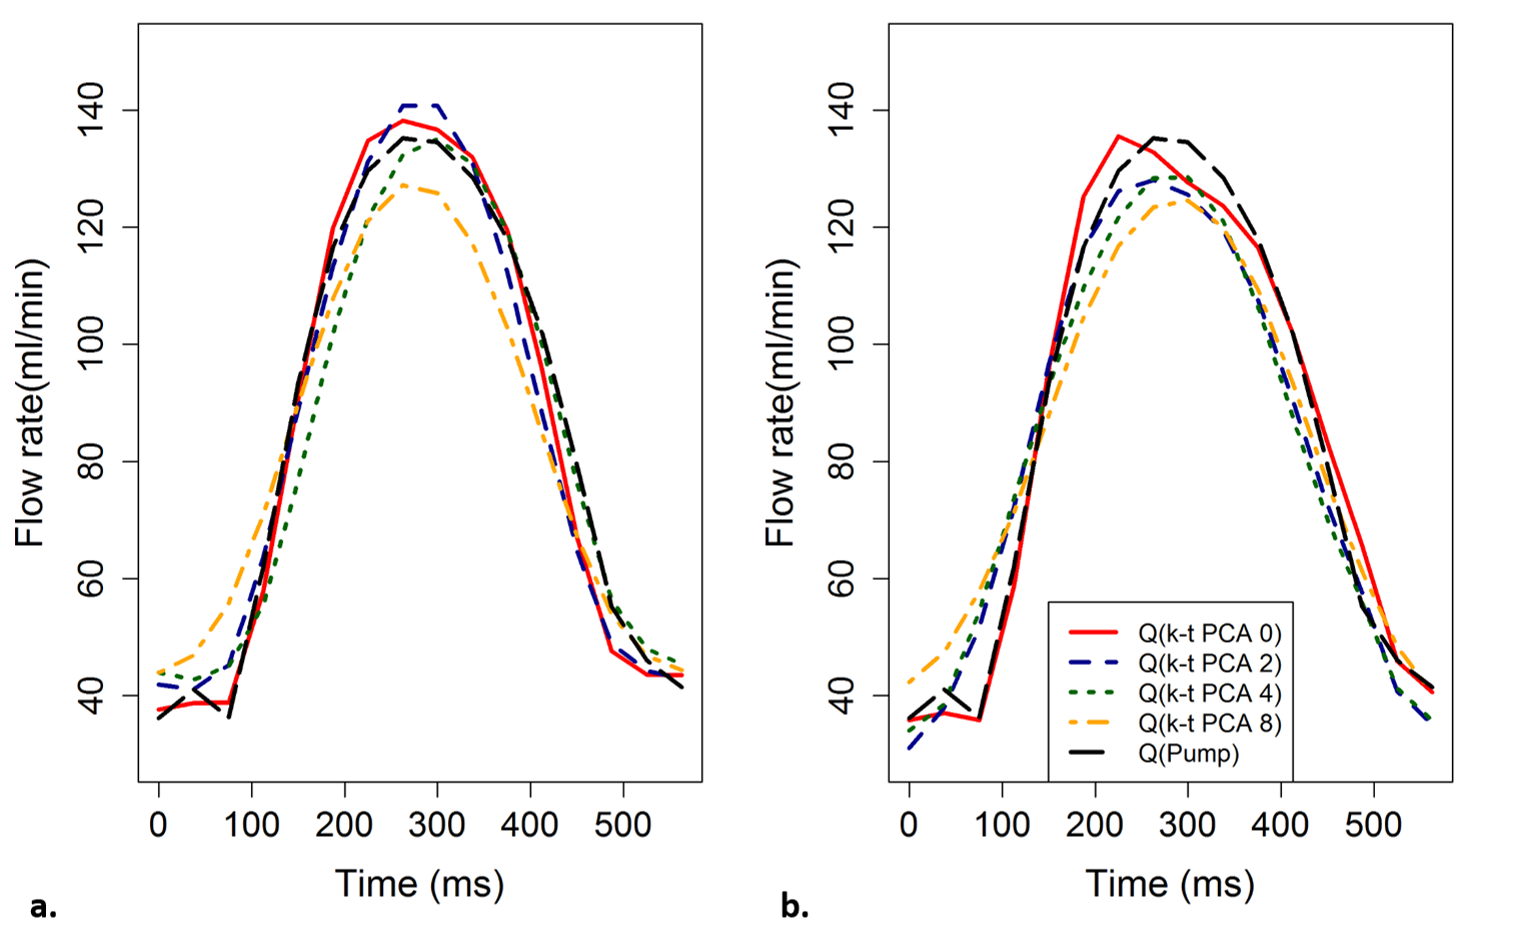
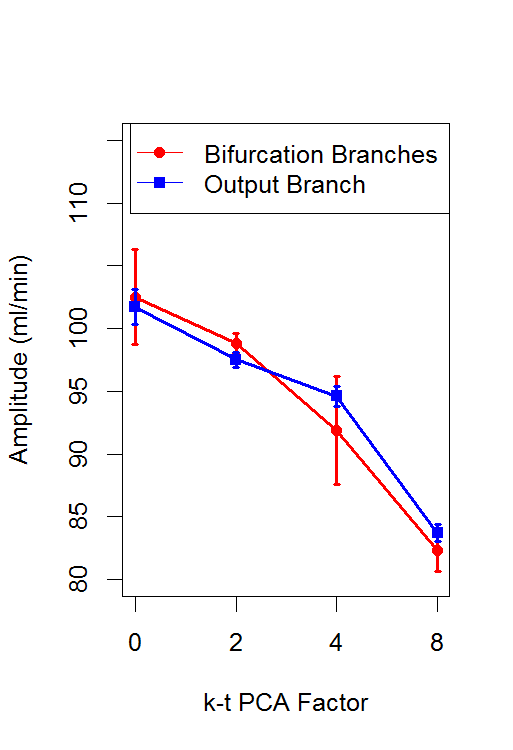
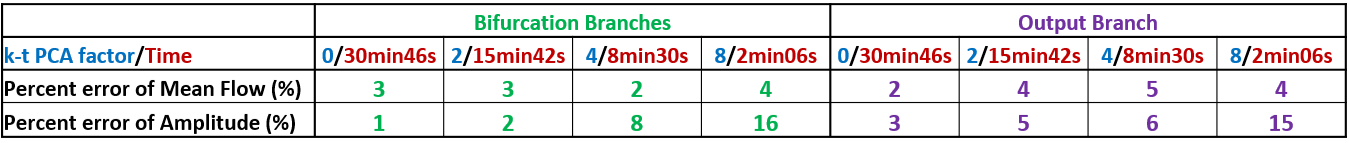
The mean flow curves for each value of acceleration factor are shown in Figure 2 and the evolution of the amplitude obtained in each branch for each value of acceleration factor is shown in Figure 3. Table 1 shows the percent error of mean flow and the amplitude calculated in each branch as function of the acceleration factor.Discussion
For each acceleration factor the percent error is less than 5%. Therefore, it is possible to divide by 15 the acquisition time and still maintain a good measurement accuracy. However, the results also show a decrease in the amplitude of the flow curves by 25% using the acceleration factor 8. These results are consistent with those found by Greil et al.5 in great vessels. This result can be explained by the method used to under-sample the k-space, which mainly samples the high frequencies3: if mean flow is kept constant, when the under-sampling factor increases, the amplitude of the signal decreases. This decrease can be more significant in high frequency signals, such as from arterial blood flow. In fact, this could reflect a possible limitation of the k-t PCA acceleration factor when it is used to calculate the Wall Shear Stress, which uses amplitude as the main parameter to determine its value.Conclusion
In an experimental setup providing physiological pulsatile flow with frequency and average flow rate that can be found in human beings, it is possible to obtain accurate mean flow measurement in vessels with diameters of one millimeter with an acquisition time clinically acceptable. However, the k-t PCA acceleration factor causes loss of information for peaks detection, resulting in a decrease of the amplitude of the flow curve.Acknowledgements
No acknowledgement found.References
1. Markl et al. Comprehensive velocity mapping of the heart and great vessels by cardiovascular magnetic resonance. CMR (2011)
2. Wetsel et al. In Vivo assessment and visualization of arterial hemodynamics with flow sensitized 4D. AJNR (2007)
3. Pedersen et al. k-t PCA Temporally constrained k-t BLAST reconstruction using principal component analysis. MRM (2009)
4. Balédent et al. Cerebrospinal fluid dynamics and relation with blood flow: a magnetic resonance study with semiautomated cerebrospinal fluid segmentation. Invest. Rad. (2001)
5. Giese et al. Toward highly accelerated Cartesian time-resolved 3D flow cardiovascular magnetic resonance in the clinical setting. J. Cardiovasc. Magn. Reson. (2014)
Figures