2837
Magnetic Resonance Imaging Reveals Elevated Aortic Pulse Wave Velocity in Overweight Adolescents1Physiology and Experimental Medicine, Hospital for Sick Children, Toronto, ON, Canada, 2Department of Exercise Sciences, University of Toronto, Toronto, ON, Canada, 3Faculty of Kinesiology and Physical Education, University of Toronto, ON, Canada, 4Labatt Family Heart Centre, Hospital for Sick Children, Toronto, ON, Canada, 5Faculty of Kinesiology and Physical Education, University of Toronto, Toronto, ON, Canada, 6Department of Pediatrics, Faculty of Medicine, University of Toronto, Toronto, ON, Canada
Synopsis
This study provides a comparison of four commonly-used estimates of PWV to evaluate aortic stiffness, and compares these estimates of PWV with factors indicating cardiometabolic risk in obese youth. Hemodynamic parameters and phase-contrast CMR of the aortic arch at 3.0T were measured in 19 participants (12 obese, 7 normal-weight). Four methods of estimating PWV were used (cross-correlation, foot-to-foot, half-peak, area under the curve). There was an association between increasing measures of inflammation (C-reactive protein) and BMI, indicating that aortic PWV may be associated with changes in arterial stiffness in adolescents with subclinical biomarkers of cardiovascular disease. Careful consideration should be given to the method of PWV estimation due to measurement bias.
Purpose
Phase contrast magnetic resonance imaging can be used to estimate pulse wave velocity as a non-invasive marker to detect early changes in vascular structure and function[1]. While aortic PWV (aPWV) measured by velocity-encoded CMR may uncover early vascular abnormalities in obese youth at risk for cardiovascular disease, numerous techniques can be used to measure the time-shift (Δt) between two points in the pulse wave, which results in measurement error. This study assessed inter-method agreement in aortic PWV (aPWV) using two standard algorithms (cross-correlation (CC), time-to-foot (TTF)) and two methods interpolating time points on the flow curve (half-peak (HP), integral (INT))[2]. We also investigated the relationship between aPWV and markers of cardiometabolic risk in a cohort of overweight/obese (Ow/Ob) adolescentsMethods
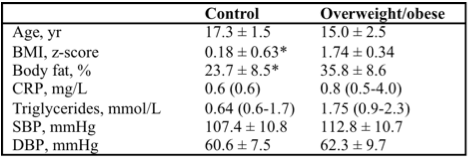
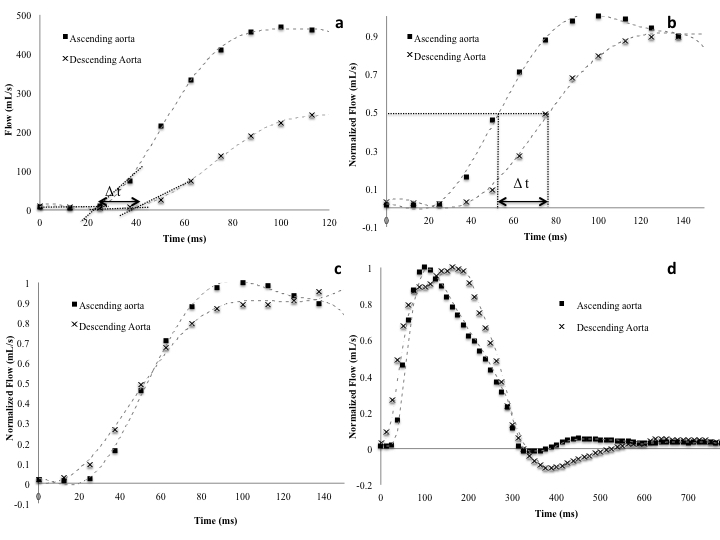
Nineteen (n=12 Ow/Ob, Table 1) adolescents had cardiac imaging performed on a 3T MRI system (Siemens Magnetom TrioTim, Germany). Flow waves were obtained using phase-contrast images perpendicular to the ascending and descending aorta at the level of the right pulmonary artery. PC images were acquired with a non-breath-hold single-slice ECG-gated sequence. Imaging parameters were: TE/TR = 2.72/19.16ms, flip angle = 25°, in-plane resolution = 1.6mm x1.6 mm, slice thickness = 4mm, venc=150cm/s, NSA=2, iPAT= GRAPPA, acceleration factor 2. This resulted in an effective temporal resolution for flow-velocity calculation of 10-14ms depending on the heart rate. Aortic arch length measurements were obtained with a turbo spin echo breath-hold sequence oriented along the long axis of the aortic arch. Flow waves were analyzed with commercially-available software Qflow (Medis, Netherlands), and aortic arch distance measured between the ascending and descending aorta using Qmass (Medis, Netherlands). aPWV was obtained for all four methods (CC, TTF, HP, INT) using custom programs in MATLAB, and a mean aPWV was computed from the average of the four methods. Bland-Altman analysis assessed inter-method agreement, and regression analyses were used to compare aPWV with measures of cardiometabolic risk.Results
Inter-method results showed no significant bias across the CC and INT methods (mean difference ± SD= 0.91±0.56 m/s), CC and HP (mean difference ± SD= 1.23±0.29 m/s), or HP and INT (mean difference ± SD = 0.32±0.29 m/s). FTF had significant bias against CC, HP, and INT methods. aPWV was significantly higher in Ow/Ob participants versus healthy normal weight controls when corrected for age and sex (Ow/Ob= 3.8±0.49 m/s; control= 3.07±0.52 m/s, p=0.014). BMI z-score (β=0.51, r2=0.61, p=0.017) and C-reactive protein significantly predicted increasing aPWV (β=0.61, r2=0.61, p=0.004) when controlling for age and sex.Discussion and Conclusion
Increasing arterial stiffness measured by aPWV was associated with increasing body weight and inflammatory status in overweight and obese adolescents without hypertension or metabolic dysfunction. Importantly, poor time resolution has a significant effect on PWV estimation, and can affect experimental interpretation. Interpolated methods (integral and time to half peak) of measuring aPWV show the greatest agreement in our adolescent cohort, with significant bias between foot-to-foot and the other three methods of estimation. The method used to calculate Δt in the estimation of aPWV should be carefully considered given these differences.Acknowledgements
No acknowledgement found.References
[1] Rider, OJ et al. (2010). Obesity, 18(12), 2311-2316. [2] Dogui, A et al. (2011). JMRI, 33(6), 1321-1329.Figures